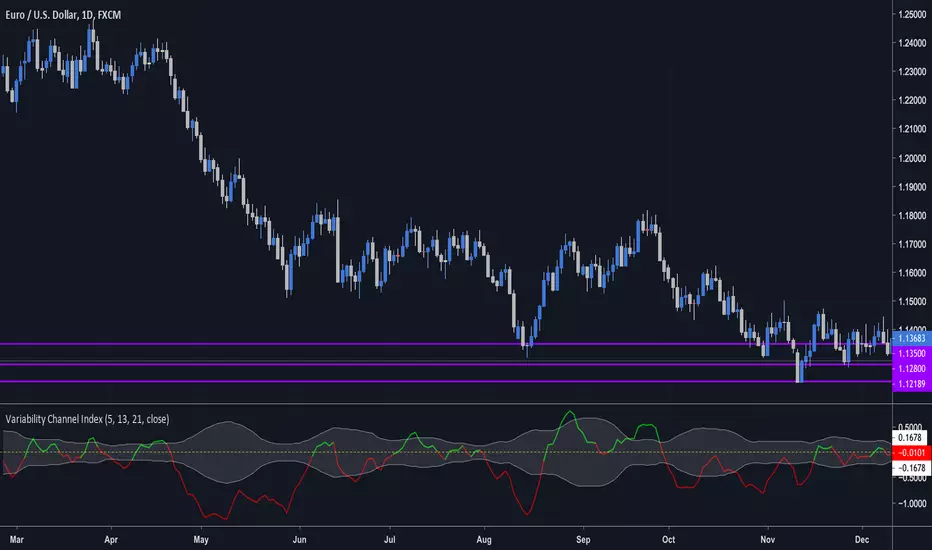
Variability Channel Index (by vitelot)This is a momentum, trend, as well as a divergence indicator.
It is similar to CCI, though it is based on a slow and fast EMA in connection to ATR, which
allows to interprete it easily.
Both EMAs and ATR have customisable period.
Further explanation and basic usage can be found in the comment section inside the script.
Pesquisar nos scripts por "Divergence"

CMYK RMI◊ Introduction
I started using this script because of its fast reaction, and good tell for buy/sell moments on a short timescale.
For larger timescales, the overall trend should be taken into account regarding the levels.
In the future i will update this indicator, to automatically adjust those.
◊ Origin
The Relative Momentum Index was developed by Roger Altman and was introduced in his article in the February, 1993 issue of Technical Analysis of Stocks & Commodities magazine.
While RSI counts up and down days from close to close, the Relative Momentum Index counts up and down days from the close relative to a close x number of days ago.
This results in an RSI that is smoother.
◊ Adjustments
CMYK color theme applied.
Four levels to indicate intensity.
Two Timescales, to overview the broader trend, and fast movements.
◊ Usage
RMI indicates overbought and oversold zones, and can be used for divergence and trend analysis.
◊ Future Prospects
Self adjusting levels, relative to an SMA trend.
Alternative RMI, which functions as an overlay.
◊ ◊ ◊ ◊ ◊ ◊ ◊ ◊ ◊ ◊ ◊ ◊ ◊ ◊ ◊ ◊ ◊ ◊ ◊ ◊ ◊ ◊ ◊ ◊ ◊ ◊ ◊ ◊ ◊ ◊ ◊ ◊ ◊ ◊ ◊ ◊ ◊ ◊ ◊ ◊ ◊ ◊ ◊ ◊ ◊ ◊ ◊ ◊ ◊ ◊ ◊ ◊ ◊ ◊ ◊ ◊ ◊ ◊ ◊ ◊ ◊ ◊ ◊ ◊ ◊ ◊ ◊ ◊ ◊ ◊ ◊ ◊ ◊ ◊ ◊ ◊ ◊ ◊ ◊ ◊ ◊ ◊ ◊ ◊ ◊ ◊ ◊ ◊ ◊ ◊ ◊ ◊ ◊ ◊ ◊ ◊ ◊ ◊ ◊ ◊ ◊ ◊ ◊ ◊ ◊ ◊

MTF Polarity Grid [DW]This is an experimental study designed to track directional polarities across multiple timeframes and express them as a simple two color grid.
The polarity in this calculation is determined by divergence between a fast and slow McGinley Dynamic.
Your current resolution's polarity is the top row, the rows below are are for higher timeframes of your choice.

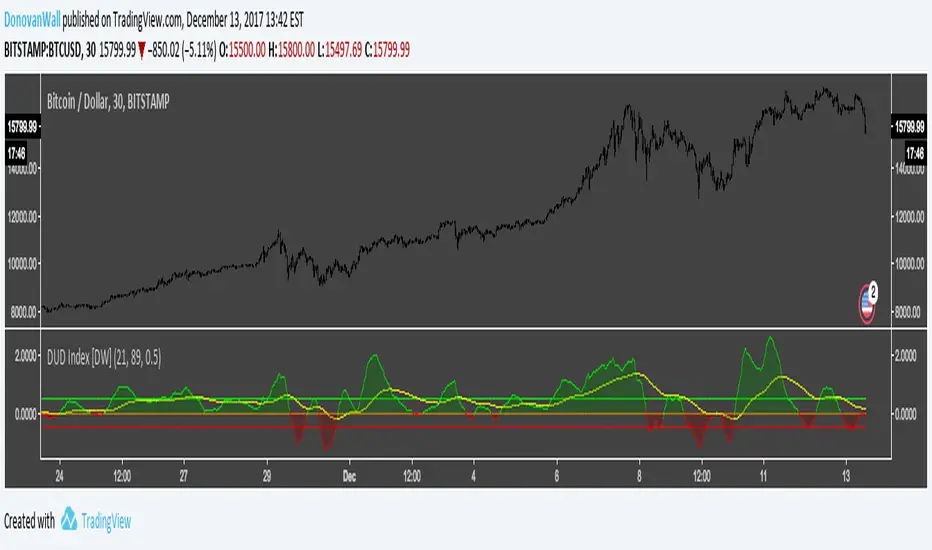
Dual Ulcer Divergence Index [DW]This study is an experimental variation of Peter Martin's Ulcer Index built using the framework of my Dual Ulcer Index indicator.
In this version, the difference between the long and short UI is calculated.
This index is a measure of volatility and momentum that can be used to locate low risk trading opportunities.
VDUB BB %B REVERSAL_v4.2 revised by JustUncleLThis is an revised Open Public version of Vdub Bollinger Band %B reversal indicator. This version includes optional Divergence Finder with selectable channel width, optional Market Session time highlighting and optional Binary Option expiry markers.

Open Close Cross Alert R6 by JustUncleLThis revision of this indicator is an Open Public release. The indicator alert based on JayRogers "Open Close Cross Strategy R2" and is used in conjunction with the revised "Open Close Cross Strategy R5".
Description:
This indicator alert created for TradingView alarm sub-system (via the alertcondition() function, which currently does not work in a "Strategy" script). Also this indicator plots the Difference Factor between the Close and Open Moving Averages, this gives a good indication of strength of move. Also included in this release is optional Divergence finder with variable width channel.

MACD + RSI TSA simple strategy that use EMAs convergence/divergence and RSI peeks to take position. Fractals are really useful to positioning your stop loss.
It works well on commodities and forex markets.

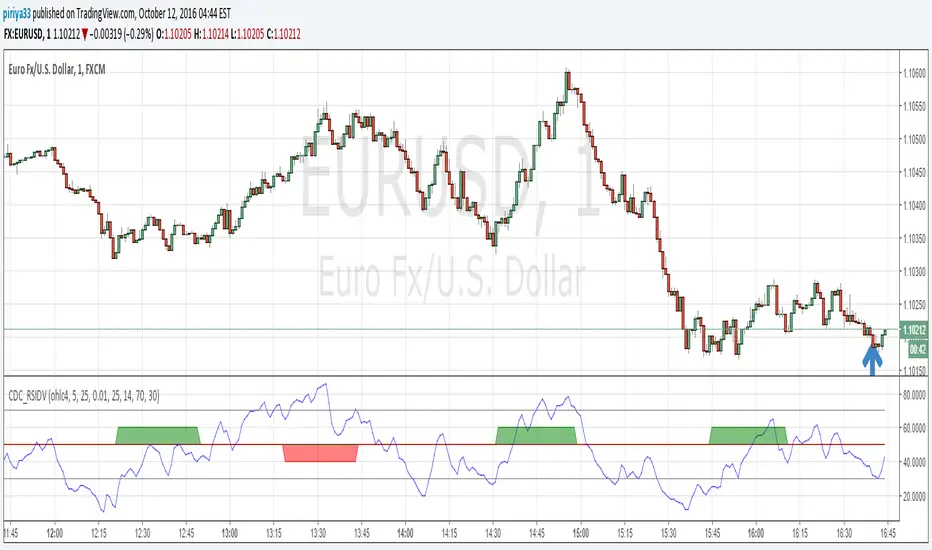
CDC RSI DivergenceThis script alerts when a bullish or bearish divergence occurs.
The alert have minor repainting so do not use this as an entry / exit signal
but rather a guideline to be considered with other indicators. (MACD for example)
PPO Divergence AlertsThis is a pretty straightforward script that adds alerts to Pekipek's excellent PPO Divergence indicator and changes the visuals a bit. You can have the alerts fire on these events:
Purple Circle (bullish signal)
Orange Circle (bearish signal)
Green Dot (High Point)
Red Dot (Low Point)
I use this on daily Forex charts to get alerts when purple or orange dots show. As you can see, it catches a lot of big moves, some of which can give insane returns if you're 200x leveraged on the likes of 1Broker.com. In regards to reducing false signals, I'm getting good results with a Williams %R but would love to hear any suggestions.
Edit: Oops. Box #6 in the example should be yellow, not purple.

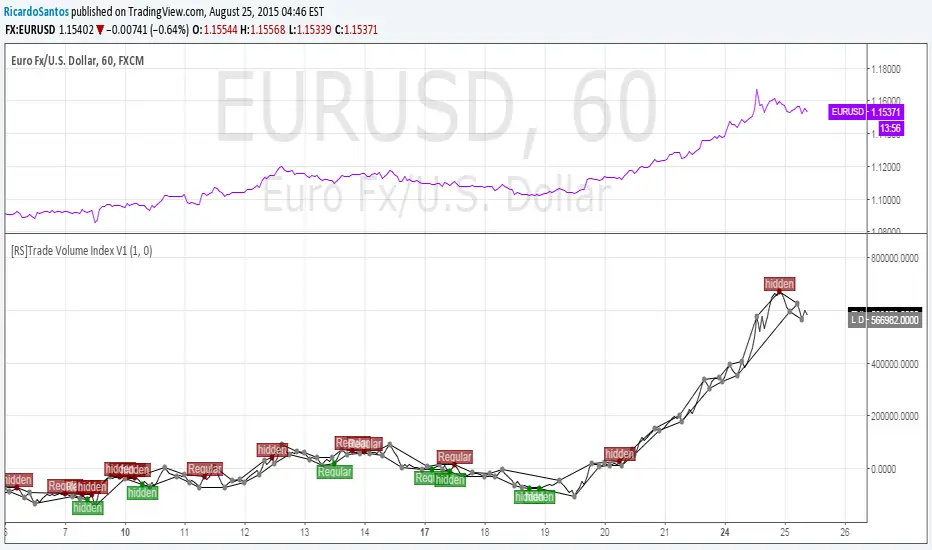
[RS]Convergence Divergence Impulse Counter V0EXPERIMENTAL:
Counts the number of impulses with the same direction within a larger trend.
Willams %R extreme and MACD DivergenceThis is two different indicators combine into one.
First is the two different period of Williams% 5 mins and 15 mins.
Second is the MACD line of 5 mins chart.
Both will be primarily use on the 5 mins chart, you can use on another time frame if you wish
Williams %:
green = uptrending
red = downtrending
Bright green: overbought condition, look to Short at the end of the signal
Bright Red: oversold condition, look to Long at the end of the signal
MACD:
I also added the MACD line which you can use for divergence
when price move higher and MACD is moving down, expecting price to drop sometime soon or vice versa. See chart for example.


[RS]Leading Momentum Oscilator V0EXPERIMENTAL: Momentum oscilator based on offset, can also be used for divergence/convergence


ridenz rsi"Divergence is when the price of an asset is moving in the opposite direction of a technical indicator, such as an oscillator, or is moving contrary to other data. Divergence warns that the current price trend may be weakening, and in some cases may lead to the price changing direction.
If the stock is rising and making new highs, ideally the RSI is reaching new highs as well. If the stock is making new highs, but the RSI starts making lower highs, this warns the price uptrend may be weakening. This is negative divergence.
Positive divergence is the opposite situation. Imagine the price of a stock is making new lows while the RSI makes higher lows with each swing in the stock price. Investors may conclude that the lower lows in the stock price are losing their downward momentum and a trend reversal may soon follow.
Divergence is one of the common uses of many technical indicators, primarily the oscillators."

Continuation Gauge - Bull vs BearDivergence/ strength detector - great for tracking entry at key divergences and visualizing volatility.

VMDivergences◈ DIVERGENCE DETECTION SYSTEM ◈
════════════════════════════════════════════════════════════
▀▀▀▀▀▀▀▀▀▀▀▀▀▀▀▀▀▀▀▀▀▀▀▀▀▀▀▀▀▀▀▀▀▀▀▀▀▀▀▀▀▀▀▀▀▀▀▀▀▀▀▀▀▀▀▀▀
█ 🎯 OVERVIEW █
▄▄▄▄▄▄▄▄▄▄▄▄▄▄▄▄▄▄▄▄▄▄▄▄▄▄▄▄▄▄▄▄▄▄▄▄▄▄▄▄▄▄▄▄▄▄▄▄▄▄▄▄▄▄▄▄▄
VMDiv is a professional-grade divergence detection system built on a unique
hybrid oscillator that combines the best of momentum analysis and mean-reversion
theory. Unlike standard divergence indicators that rely on RSI or MACD, this
system uses a custom Volume Momentum oscillator with adjustable characteristics.
═══════════════════════════════════════════════════════════
🔧 THE VM OSCILLATOR ENGINE
═════════════════════════════════════════════════════════════
The core innovation is a hybrid oscillator combining TWO analytical approaches:
┌──────────────────────────────────────────────────────┐
│ COMPONENT 1: EMA MOMENTUM │
│ ════════════════════════ │
│ • Fast EMA minus Slow EMA (similar to MACD) │
│ • Normalized by standard deviation for consistency │
│ • Captures trend strength and directional momentum │
├─────────────────────────────────────────────────────────┤
│ COMPONENT 2: BOLLINGER BAND DISTANCE │
│ ════════════════════════════════════ │
│ • Price distance from Bollinger Band midline │
│ • Normalized to show position within bands (-1 to +1 typically) │
│ • Captures overextension and mean-reversion potential │
├─────────────────────────────────────────────────────────┤
│ THE BLEND │
│ ════════════ │
│ • "Momentum Blend" parameter controls the mix │
│ • 1.0 = Pure momentum oscillator │
│ • 0.0 = Pure mean-reversion oscillator │
│ • 0.5 = Balanced hybrid (often optimal) │
└───────────────────────────────────────────────────┘
═══════════════════════════════════════════════════════
📊 DIVERGENCE TYPES DETECTED
══════════════════════════════════════════════════════
This indicator detects SIX types of divergence patterns:
┌───────────────────────────────────────────────────────┐
│ 🔴 REGULAR BEARISH DIVERGENCE │
│ ══════════════════════════════ │
│ Price: Makes HIGHER HIGH ↗ │
│ Oscillator: Makes LOWER HIGH ↘ │
│ │
│ Interpretation: Momentum is weakening despite higher prices. │
│ Signal: Potential reversal to the DOWNSIDE │
│ Reliability: HIGH - Classic reversal signal at tops │
├────────────────────────────────────────────────────────┤
│ 🟢 REGULAR BULLISH DIVERGENCE │
│ ══════════════════════════════ │
│ Price: Makes LOWER LOW ↘ │
│ Oscillator: Makes HIGHER LOW ↗ │
│ │
│ Interpretation: Momentum is strengthening despite lower prices. │
│ Signal: Potential reversal to the UPSIDE │
│ Reliability: HIGH - Classic reversal signal at bottoms │
├──────────────────────────────────────────────────┤
│ 🟠 HIDDEN BEARISH DIVERGENCE │
│ ════════════════════════════ │
│ Price: Makes LOWER HIGH ↘ │
│ Oscillator: Makes HIGHER HIGH ↗ │
│ │
│ Interpretation: Downtrend showing internal strength. │
│ Signal: Trend CONTINUATION - expect further downside │
│ Best used: During confirmed downtrends │
├──────────────────────────────────────────────────────┤
│ 🟡 HIDDEN BULLISH DIVERGENCE │
│ ════════════════════════════ │
│ Price: Makes HIGHER LOW ↗ │
│ Oscillator: Makes LOWER LOW ↘ │
│ │
│ Interpretation: Uptrend showing internal strength. │
│ Signal: Trend CONTINUATION - expect further upside │
│ Best used: During confirmed uptrends │
├───────────────────────────────────────────────────┤
│ 🟣 DOUBLE TOP DIVERGENCE │
│ ═════════════════════════ │
│ Price: Two SIMILAR HIGHS (within ATR tolerance) │
│ Oscillator: Second high LOWER than first │
│ │
│ Interpretation: Resistance tested twice with weakening momentum. │
│ Signal: Strong reversal setup - HIGH PROBABILITY bearish │
│ Best used: At major resistance levels │
├───────────────────────────────────────────────────────────┤
│ 🔵 DOUBLE BOTTOM DIVERGENCE │
│ ═══════════════════════════ │
│ Price: Two SIMILAR LOWS (within ATR tolerance) │
│ Oscillator: Second low HIGHER than first │
│ │
│ Interpretation: Support tested twice with strengthening momentum. │
│ Signal: Strong reversal setup - HIGH PROBABILITY bullish │
│ Best used: At major support levels │
└──────────────────────────────────────────────────┘

Spirit Time SMT 1M DIVDivergences from 90Min-1Min
apparently i have to explain more of what this does.
pretty self explanatory
Hope this enough text

Divergence Channels Indicator — JudasBulletUnique Buy/Sell Indicator. Place stoploss above/below 18 EMA. Low risk/high reward. My No.1 indicator on every chart.
