RSI+EMA+MZONES with DivergencesFeatures:
1. RSI Calculation:
Uses user-defined periods to calculate the RSI and visualize momentum shifts.
Plots key RSI zones, including upper (overbought), lower (oversold), and middle levels.
2. EMA of RSI:
Includes an Exponential Moving Average (EMA) of the RSI for trend smoothing and confirmation.
3. Bullish and Bearish Divergences:
Detects Regular divergences (labeled as “Bull” and “Bear”) for classic signals.
Identifies Hidden divergences (labeled as “H Bull” and “H Bear”) for potential trend continuation opportunities.
4. Customizable Labels:
Displays divergence labels directly on the chart.
Labels can be toggled on or off for better chart visibility.
5. Alerts:
Predefined alerts for both regular and hidden divergences to notify users in real time.
6. Fully Customizable:
Adjust RSI period, lookback settings, divergence ranges, and visibility preferences.
Colors and styles are easily configurable to match your trading style.
How to Use:
RSI Zones: Use RSI and its zones to identify overbought/oversold conditions.
EMA: Look for crossovers or confluence with divergences for confirmation.
Divergences: Monitor for “Bull,” “Bear,” “H Bull,” or “H Bear” labels to spot key reversal or continuation signals.
Alerts: Set alerts to be notified of divergence opportunities without constant chart monitoring.
Pesquisar nos scripts por "Divergence"

Fisher+ [OSC]The Fisher Transform Indicator is classified as an oscillator, meaning that its value swings above and below a central point. This characteristic allows traders to identify overbought and oversold conditions, providing potential clues about market reversals. As mentioned previously, it is an oscillator so the strength of the move is displayed by how long the fisher line stays above/below zero. Indicator can be used to aid in confluence near supply/demand zones.
White Line = Fisher
Red/Blue Line = Moving Average
--Changes color whether fisher line is above/below the MA
Red/Blue Shaded Line = Moving Average
--Changes color based on a smoothing factor
Red/Blue Shaded Fill = Asset in Overbought/Oversold Conditions
Red/Blue Circles = Asset in Extreme Overbought/Oversold Conditions
Red/Blue Triangles = MACD Signals Below/Above "0"
Divergence Labels = Asset Signaling Divergence
The moving average line will turn red/blue as long as the fisher line is below/above the moving average. The shaded MA line will switch colors based on if it is moving in an up/down trend. The MA can also be used as a signal and treated similar to an oscillator. Market trending conditions will either keep the MA below/above the dashed zero line.
MACD code credited to LazyBear's MACD Leader indicator. It is used to filter out/confirm any signals such as divergences. As long as the MACD Leader line is above both the MACD line and signal lines then it'll signal with with a triangle. MACD divergences will be added at a later time.

Multi-Divergence Buy/Sell IndicatorThe "Multi-Divergence Buy/Sell Indicator" is a technical analysis tool that combines multiple divergence signals from different indicators to identify potential buy and sell opportunities in the market. Here's a breakdown of how the indicator works and how to use it:
Input Parameters:
RSI Length: Specifies the length of the RSI (Relative Strength Index) calculation.
MACD Short Length: Specifies the short-term length for the MACD (Moving Average Convergence Divergence) calculation.
MACD Long Length: Specifies the long-term length for the MACD calculation.
MACD Signal Smoothing: Specifies the smoothing length for the MACD signal line calculation.
Stochastic Length: Specifies the length of the Stochastic oscillator calculation.
Stochastic Overbought Level: Defines the overbought level for the Stochastic oscillator.
Stochastic Oversold Level: Defines the oversold level for the Stochastic oscillator.
Calculation of Indicators:
RSI: Calculates the RSI based on the specified RSI Length.
MACD: Calculates the MACD line, signal line, and histogram based on the specified MACD parameters.
Stochastic: Calculates the Stochastic oscillator based on the specified Stochastic parameters.
Divergence Detection:
RSI Divergence: Identifies a bullish divergence when the RSI crosses above its 14-period simple moving average (SMA).
MACD Divergence: Identifies a bullish divergence when the MACD line crosses above the signal line.
Stochastic Divergence: Identifies a bullish divergence when the Stochastic crosses above its 14-period SMA.
Buy and Sell Conditions:
Buy Condition: Triggers a buy signal when all three divergences (RSI, MACD, and Stochastic) occur simultaneously.
Sell Condition: Triggers a sell signal when both RSI and MACD divergences occur, but Stochastic divergence does not occur.
Plotting Buy/Sell Signals:
The indicator plots green "Buy" labels below the price bars when the buy condition is met.
It plots red "Sell" labels above the price bars when the sell condition is met.
Usage:
The indicator can be used on any timeframe and for any trading instrument.
Look for areas where all three divergences (RSI, MACD, and Stochastic) align to generate stronger buy and sell signals.
Consider additional technical analysis and risk management strategies to validate the signals and manage your trades effectively.
Remember, no indicator guarantees profitable trades, so it's essential to use this indicator in conjunction with other tools and perform thorough analysis before making trading decisions.
Feel free to ask any questions

RSI Pivots with Divergence Overlay█ OVERVIEW
The RSI Pivots with Divergence Overlay indicator is an advanced tool based on RSI, displaying dynamic bands on the price chart to simplify the identification of overbought and oversold conditions. Pivot points and divergences between them are derived from these bands, providing a comprehensive view of the market and enabling the creation of various trading strategies based on this single indicator.
█ CONCEPTS
Areas where RSI exits the bands are often reversal points in the market. The concept of this indicator is to highlight places where the probability of a trend reversal increases. Therefore, pivots and divergences have been added to better identify these key moments. Additionally, the bands allow viewing the market context in relation to the RSI indicator, facilitating analysis of momentum and volatility.
█ KEY FEATURES
Dynamic Bands and RSI Signals: The bands are calculated based on the closing price and RSI value, with dynamic scaling adjusted to market volatility. The upper band corresponds to overbought levels, the lower to oversold, and the midline is their average. The price level relative to the bands serves as a visual RSI signal, indicating potential overbought or oversold conditions.
Pivot Points: The indicator identifies local price highs and lows in relation to RSI levels. The pivot level is taken from the high/low of the candle. A high pivot is detected when the high of the candle reaches a local maximum after crossing the upper RSI level (overbought), signaling a potential reversal. A low pivot appears after a local price minimum following a drop below the lower RSI level (oversold), indicating a possible uptrend reversal. The pivot length (default 2 bars) defines the search range for these extremes, meaning that with a length of 2, a potential divergence signal will appear with a 2-candle delay, as this is the minimum time required to confirm a local pivot. Pivot lines are drawn on the chart, and labels display the RSI value (from the close of the candle) and price at the detection moment. Pivot lines disappear after the detection of the next low pivot for lower lines and high pivot for upper lines, but unbreached lines or those with high volume may still serve as support or resistance levels.
Divergence Detection: The indicator automatically detects divergences to predict trend changes. Bearish divergence occurs when the price forms a higher high pivot, but the RSI (from the close of the candle) is lower than in the previous pivot, indicating weakening upward momentum and a potential bearish reversal. Bullish divergence appears when the price forms a lower low pivot, but the RSI is higher, suggesting building momentum and a possible bullish reversal. Divergences are marked in pivot labels (e.g., "Bear Div" or "Bull Div") and supported by alerts upon detection.
Return Signals: The indicator generates buy and sell signals based on RSI (price) returning to the bands after extreme conditions, independently of pivots and divergences. A buy signal is triggered when RSI (price) crosses above the lower level (exiting oversold), suggesting a potential price rise toward the midline or upper band. A sell signal occurs when RSI (price) falls below the upper level (exiting overbought), indicating a possible price drop toward the lower band. Signals are visualized as arrows (up/down triangles) on the chart, with customizable colors.
█ CONFIGURATION
The indicator offers extensive customization options:
RSI Length (rsiLength): Sets the number of periods used to calculate RSI (default 14).
RSI Upper Level (rsiUpper): Defines the overbought threshold (default 70).
RSI Lower Level (rsiLower): Defines the oversold threshold (default 30).
Band Scaling (scale): Determines the scaling multiplier for bands based on market volatility (default 15.0).
SMA Length for Candle Midpoint (length): Number of periods for calculating the moving average of candle midpoints (default 200). This parameter is used to smooth price data, enabling more accurate volatility assessment and band width adjustment to market dynamics.
Pivot Length (pivotLength): Sets the range (in bars) for detecting local price extremes (default 2).
Pivot Label Offset (pivotLabelOffset): Multiplier for the candle range to position pivot labels (default 0.3).
Show Bands (showBands): Enables/disables the display of bands on the chart.
Show Fill (showFill): Enables/disables the fill between bands and the midline.
Show Pivot Lines (showPivotLines): Enables/disables pivot lines on the chart.
Show Pivot Labels (showPivotLabels): Enables/disables labels with RSI and price values at pivots.
Show Return Signals (showReturnSignals): Enables/disables the display of buy and sell signals.
Colors and Style: Customizable colors for bands, fills, pivot lines, labels, and line widths (default 1).
█ USAGE
The indicator performs best when combined with other technical analysis tools, such as Fibonacci levels, moving averages, or trendlines, to confirm pivot, divergence, and return signals. It enables traders to identify key reversal points, detect hidden trend weaknesses through divergences, and confirm trade entries with return signals.
Usage Examples:
Price bounces off a previous pivot with high volume – this increases the probability of a trend change or correction.
A similar situation when RSI is outside the bands strengthens the signal.
If divergence occurs in addition, we have further confirmation.
This can be combined with Fibonacci levels to check if Fibo zones overlap with pivot lines – this may increase the chance of a strong price reaction.
█ ALERTS
The indicator supports alerts for:
Buy and sell signals (RSI returning to bands).
Detection of bearish and bullish divergences.

Cumulative Volume Delta with Divergence🧠 Core Functionality:
1. Cumulative Volume Delta (CVD):
Purpose: Visualizes the difference between buying and selling pressure over time.
Mechanism:
It uses lower-timeframe volume delta data, retrieved from ta.requestVolumeDelta(), to build a candle-style visualization of the net volume movement.
Plotted candles show whether buying (up volume) or selling (down volume) was dominant within each period.
Teal candles: More buying than selling (CVD up).
Red candles: More selling than buying (CVD down).
Volume Source: Based on intrabar up/down volume approximation from lower timeframes.
🧭 Divergence Detection (New Feature):
2. Regular Bullish Divergence:
Condition:
Price makes a lower low.
CVD (lastVolume) makes a higher low.
Interpretation: Selling pressure is weakening despite price making new lows — a potential reversal signal to the upside.
Displayed As:
Green line and label "Bull" under the CVD at the divergence point.
3. Regular Bearish Divergence:
Condition:
Price makes a higher high.
CVD makes a lower high.
Interpretation: Buying pressure is fading despite price rising — a potential reversal signal to the downside.
Displayed As:
Red line and label "Bear" above the CVD at the divergence point.
🧰 User Controls:
Use custom timeframe: Overrides default volume delta resolution for finer or broader analysis.
Calculate Divergence: Turns the divergence detection on or off.
Adjustable via script inputs.
🔔 Alerts:
Two alert conditions are included:
One for bullish divergence.
One for bearish divergence.
Alerts trigger at the bar where the divergence is confirmed, not where it starts.
📈 Use Case:
This tool is ideal for traders looking to:
Spot early reversals or momentum shifts.
Combine volume analysis with price action.
Time entries or exits more accurately using volume-confirmed divergence.

VV Moving Average Convergence Divergence # VMACDv3 - Volume-Weighted MACD with A/D Divergence Detection
## Overview
**VMACDv3** (Volume-Weighted Moving Average Convergence Divergence Version 3) is a momentum indicator that applies volume-weighting to traditional MACD calculations on price, while using the Accumulation/Distribution (A/D) line for divergence detection. This hybrid approach combines volume-weighted price momentum with volume distribution analysis for comprehensive market insight.
## Key Features
- **Volume-Weighted Price MACD**: Traditional MACD calculation on price but weighted by volume for earlier signals
- **A/D Divergence Detection**: Identifies when A/D trend diverges from MACD momentum
- **Volume Strength Filtering**: Distinguishes high-volume confirmations from low-volume noise
- **Color-Coded Histogram**: 4-color system showing momentum direction and volume strength
- **Real-Time Alerts**: Background colors and alert conditions for bullish/bearish divergences
## Difference from ACCDv3
| Aspect | VMACDv3 | ACCDv3 |
|--------|---------|---------|
| **MACD Input** | **Price (Close)** | **A/D Line** |
| **Volume Weighting** | Applied to price | Applied to A/D line |
| **Primary Signal** | Volume-weighted price momentum | Volume distribution momentum |
| **Use Case** | Price momentum with volume confirmation | Volume flow and accumulation/distribution |
| **Sensitivity** | More responsive to price changes | More responsive to volume patterns |
| **Best For** | Trend following, breakouts | Volume analysis, smart money tracking |
**Key Insight**: VMACDv3 shows *where price is going* with volume weight, while ACCDv3 shows *where volume is accumulating/distributing*.
## Components
### 1. Volume-Weighted MACD on Price
Unlike standard MACD that uses simple price EMAs, VMACDv3 weights each price by its corresponding volume:
```
Fast Line = EMA(Price × Volume, 12) / EMA(Volume, 12)
Slow Line = EMA(Price × Volume, 26) / EMA(Volume, 26)
MACD = Fast Line - Slow Line
```
**Benefits of Volume Weighting**:
- High-volume price movements have greater impact
- Filters out low-volume noise and false moves
- Provides earlier trend change signals
- Better reflects institutional activity
### 2. Accumulation/Distribution (A/D) Line
Used for divergence detection, measuring buying/selling pressure:
```
A/D = Σ ((2 × Close - Low - High) / (High - Low)) × Volume
```
- **Rising A/D**: Accumulation (buying pressure)
- **Falling A/D**: Distribution (selling pressure)
- **Doji Handling**: When High = Low, contribution is zero
### 3. Signal Lines
- **MACD Line** (Blue, #2962FF): The fast-slow difference showing momentum
- **Signal Line** (Orange, #FF6D00): EMA or SMA smoothing of MACD
- **Zero Line**: Reference for bullish (above) vs bearish (below) bias
### 4. Histogram Color System
The histogram uses 4 distinct colors based on **direction** and **volume strength**:
| Condition | Color | Meaning |
|-----------|-------|---------|
| Rising + High Volume | **Dark Green** (#1B5E20) | Strong bullish momentum with volume confirmation |
| Rising + Low Volume | **Light Teal** (#26A69A) | Bullish momentum but weak volume (less reliable) |
| Falling + High Volume | **Dark Red** (#B71C1C) | Strong bearish momentum with volume confirmation |
| Falling + Low Volume | **Light Pink** (#FFCDD2) | Bearish momentum but weak volume (less reliable) |
Additional shading:
- **Light Cyan** (#B2DFDB): Positive but not rising (momentum stalling)
- **Bright Red** (#FF5252): Negative and accelerating down
### 5. Divergence Detection
VMACDv3 compares A/D trend against volume-weighted price MACD:
#### Bullish Divergence (Green Background)
- **Condition**: A/D is trending up BUT MACD is negative and trending down
- **Interpretation**: Volume is accumulating while price momentum appears weak
- **Signal**: Smart money accumulation, potential bullish reversal
- **Action**: Look for long entries, especially at support levels
#### Bearish Divergence (Red Background)
- **Condition**: A/D is trending down BUT MACD is positive and trending up
- **Interpretation**: Volume is distributing while price momentum appears strong
- **Signal**: Smart money distribution, potential bearish reversal
- **Action**: Consider exits, avoid new longs, watch for breakdown
## Parameters
| Parameter | Default | Range | Description |
|-----------|---------|-------|-------------|
| **Source** | Close | OHLC/HLC3/etc | Price source for MACD calculation |
| **Fast Length** | 12 | 1-50 | Period for fast EMA (shorter = more sensitive) |
| **Slow Length** | 26 | 1-100 | Period for slow EMA (longer = smoother) |
| **Signal Smoothing** | 9 | 1-50 | Period for signal line (MACD smoothing) |
| **Signal Line MA Type** | EMA | SMA/EMA | Moving average type for signal calculation |
| **Volume MA Length** | 20 | 5-100 | Period for volume average (strength filter) |
## Usage Guide
### Reading the Indicator
1. **MACD Lines (Blue & Orange)**
- **Blue Line (MACD)**: Volume-weighted price momentum
- **Orange Line (Signal)**: Smoothed trend of MACD
- **Crossovers**: Blue crosses above orange = bullish, below = bearish
- **Distance**: Wider gap = stronger momentum
- **Zero Line Position**: Above = bullish bias, below = bearish bias
2. **Histogram Colors**
- **Dark Green (#1B5E20)**: Strong bullish move with high volume - **most reliable buy signal**
- **Light Teal (#26A69A)**: Bullish but low volume - wait for confirmation
- **Dark Red (#B71C1C)**: Strong bearish move with high volume - **most reliable sell signal**
- **Light Pink (#FFCDD2)**: Bearish but low volume - may be temporary dip
3. **Background Divergence Alerts**
- **Green Background**: A/D accumulating while price weak - potential bottom
- **Red Background**: A/D distributing while price strong - potential top
- Most powerful at key support/resistance levels
### Trading Strategies
#### Strategy 1: Volume-Confirmed Trend Following
1. Wait for MACD to cross above zero line
2. Look for **dark green** histogram bars (high volume confirmation)
3. Enter long on second consecutive dark green bar
4. Hold while histogram remains green
5. Exit when histogram turns light green or red appears
6. Set stop below recent swing low
**Example**:
```
Price: 26,400 → 26,450 (rising)
MACD: -50 → +20 (crosses zero)
Histogram: Light teal → Dark green → Dark green
Volume: 50k → 75k → 90k (increasing)
```
#### Strategy 2: Divergence Reversal Trading
1. Identify divergence background (green = bullish, red = bearish)
2. Confirm with price structure (support/resistance, chart patterns)
3. Wait for MACD to cross signal line in divergence direction
4. Enter on first **dark colored** histogram bar after divergence
5. Set stop beyond divergence area
6. Target previous swing high/low
**Example - Bullish Divergence**:
```
Price: Making lower lows (26,350 → 26,300 → 26,250)
A/D: Rising (accumulation)
MACD: Below zero but starting to curve up
Background: Green shading appears
Entry: MACD crosses signal line + dark green bar
Stop: Below 26,230
Target: 26,450 (previous high)
```
#### Strategy 3: Momentum Scalping
1. Trade only in direction of MACD zero line (above = long, below = short)
2. Enter on dark colored bars only
3. Exit on first light colored bar or opposite color
4. Quick in and out (1-5 minute holds)
5. Tight stops (0.2-0.5% depending on instrument)
#### Strategy 4: Histogram Pattern Trading
**V-Bottom Reversal (Bullish)**:
- Red histogram bars start rising (becoming less negative)
- Forms "V" shape at the bottom
- Transitions to light red → light teal → **dark green**
- Entry: First dark green bar
- Signal: Momentum reversal with volume
**Λ-Top Reversal (Bearish)**:
- Green histogram bars start falling (becoming less positive)
- Forms inverted "V" at the top
- Transitions to light green → light pink → **dark red**
- Entry: First dark red bar
- Signal: Momentum exhaustion with volume
### Multi-Timeframe Analysis
**Recommended Approach**:
1. **Higher Timeframe (15m/1h)**: Identify overall trend direction
2. **Trading Timeframe (5m)**: Time entries using VMACDv3 signals
3. **Lower Timeframe (1m)**: Fine-tune entry prices
**Example Setup**:
```
15-minute: MACD above zero (bullish bias)
5-minute: Dark green histogram appears after pullback
1-minute: Enter on break of recent high with volume
```
### Volume Strength Interpretation
The volume filter compares current volume to 20-period average:
- **Volume > Average**: Dark colors (green/red) - high confidence signals
- **Volume < Average**: Light colors (teal/pink) - lower confidence signals
**Trading Rules**:
- ✓ **Aggressive**: Take all dark colored signals
- ✓ **Conservative**: Only take dark colors that follow 2+ light colors of same type
- ✗ **Avoid**: Trading light colored signals during high volatility
- ✗ **Avoid**: Ignoring volume context during news events
## Technical Details
### Volume-Weighted Calculation
```pine
// Volume-weighted fast EMA
fast_ma = ta.ema(src * volume, fast_length) / ta.ema(volume, fast_length)
// Volume-weighted slow EMA
slow_ma = ta.ema(src * volume, slow_length) / ta.ema(volume, slow_length)
// MACD is the difference
macd = fast_ma - slow_ma
// Signal line smoothing
signal = ta.ema(macd, signal_length) // or ta.sma() if SMA selected
// Histogram
hist = macd - signal
```
### Divergence Detection Logic
```pine
// A/D trending up if above its 5-period SMA
ad_trend = ad > ta.sma(ad, 5)
// MACD trending up if above zero
macd_trend = macd > 0
// Divergence when trends oppose each other
divergence = ad_trend != macd_trend
// Specific conditions for alerts
bullish_divergence = ad_trend and not macd_trend and macd < 0
bearish_divergence = not ad_trend and macd_trend and macd > 0
```
### Histogram Coloring Logic
```pine
hist_color = (hist >= 0
? (hist < hist
? (vol_strength ? #1B5E20 : #26A69A) // Rising: dark/light green
: #B2DFDB) // Positive but falling: cyan
: (hist < hist
? (vol_strength ? #B71C1C : #FFCDD2) // Rising (less negative): dark/light red
: #FF5252)) // Falling more: bright red
```
## Alerts
Built-in alert conditions for divergence detection:
### Bullish Divergence Alert
- **Trigger**: A/D trending up, MACD negative and trending down
- **Message**: "Bullish Divergence: A/D trending up but MACD trending down"
- **Use Case**: Potential reversal or continuation after pullback
- **Action**: Look for long entry setups
### Bearish Divergence Alert
- **Trigger**: A/D trending down, MACD positive and trending up
- **Message**: "Bearish Divergence: A/D trending down but MACD trending up"
- **Use Case**: Potential top or trend reversal
- **Action**: Consider exits or short entries
### Setting Up Alerts
1. Click "Create Alert" in TradingView
2. Condition: Select "VMACDv3"
3. Choose alert type: "Bullish Divergence" or "Bearish Divergence"
4. Configure: Email, SMS, webhook, or popup
5. Set frequency: "Once Per Bar Close" recommended
## Comparison Tables
### VMACDv3 vs Standard MACD
| Feature | Standard MACD | VMACDv3 |
|---------|---------------|---------|
| **Price Weighting** | Equal weight all bars | Volume-weighted |
| **Sensitivity** | Fixed | Adaptive to volume |
| **False Signals** | More during low volume | Fewer (volume filter) |
| **Divergence** | Price vs MACD | A/D vs MACD |
| **Volume Analysis** | None | Built-in |
| **Color System** | 2 colors | 4+ colors |
| **Best For** | Simple trend following | Volume-confirmed trading |
### VMACDv3 vs ACCDv3
| Aspect | VMACDv3 | ACCDv3 |
|--------|---------|--------|
| **Focus** | Price momentum | Volume distribution |
| **Reactivity** | Faster to price moves | Faster to volume shifts |
| **Best Markets** | Trending, breakouts | Accumulation/distribution phases |
| **Signal Type** | Where price + volume going | Where smart money positioning |
| **Divergence Meaning** | Volume vs price disagreement | A/D vs momentum disagreement |
| **Use Together?** | ✓ Yes, complementary | ✓ Yes, different perspectives |
## Example Trading Scenarios
### Scenario 1: Strong Bullish Breakout
```
Time: 9:30 AM (market open)
Price: Breaks above 26,400 resistance
MACD: Crosses above zero line
Histogram: Dark green bars (#1B5E20)
Volume: 2x average (150k vs 75k avg)
A/D: Rising (no divergence)
Action: Enter long at 26,405
Stop: 26,380 (below breakout)
Target 1: 26,450 (risk:reward 1:2)
Target 2: 26,500 (risk:reward 1:4)
Result: High probability setup with volume confirmation
```
### Scenario 2: False Breakout (Avoided)
```
Time: 2:30 PM (slow period)
Price: Breaks above 26,400 resistance
MACD: Slightly positive
Histogram: Light teal bars (#26A69A)
Volume: 0.5x average (40k vs 75k avg)
A/D: Flat/declining
Action: Avoid trade
Reason: Low volume, no conviction, potential false breakout
Outcome: Price reverses back below 26,400 within 10 minutes
Saved: Avoided losing trade due to volume filter
```
### Scenario 3: Bullish Divergence Bottom
```
Time: 11:00 AM
Price: Making lower lows (26,350 → 26,300 → 26,280)
MACD: Below zero but curving upward
Histogram: Red bars getting shorter (V-bottom forming)
Background: Green shading (divergence alert)
A/D: Rising despite price falling
Volume: Increasing on down bars
Setup:
1. Divergence appears at 26,280 (green background)
2. Wait for MACD to cross signal line
3. First dark green bar appears at 26,290
4. Enter long: 26,295 (next bar open)
5. Stop: 26,265 (below divergence low)
6. Target: 26,350 (previous swing high)
Result: +55 points (30 point risk, 1.8:1 reward)
Key: Divergence + volume confirmation = high probability reversal
```
### Scenario 4: Bearish Divergence Top
```
Time: 1:45 PM
Price: Making higher highs (26,500 → 26,520 → 26,540)
MACD: Positive but flattening
Histogram: Green bars getting shorter (Λ-top forming)
Background: Red shading (bearish divergence)
A/D: Declining despite rising price
Volume: Decreasing on up bars
Setup:
1. Bearish divergence at 26,540 (red background)
2. MACD crosses below signal line
3. First dark red bar appears at 26,535
4. Enter short: 26,530
5. Stop: 26,555 (above divergence high)
6. Target: 26,475 (support level)
Result: +55 points (25 point risk, 2.2:1 reward)
Key: Distribution while price rising = smart money exiting
```
### Scenario 5: V-Bottom Reversal
```
Downtrend in progress
MACD: Deep below zero (-150)
Histogram: Series of dark red bars
Pattern Development:
Bar 1: Dark red, hist = -80, falling
Bar 2: Dark red, hist = -95, falling
Bar 3: Dark red, hist = -100, falling (extreme)
Bar 4: Light pink, hist = -98, rising!
Bar 5: Light pink, hist = -90, rising
Bar 6: Light teal, hist = -75, rising (crosses to positive momentum)
Bar 7: Dark green, hist = -55, rising + volume
Action: Enter long on Bar 7
Reason: V-bottom confirmed with volume
Stop: Below Bar 3 low
Target: Zero line on histogram (mean reversion)
```
## Best Practices
### Entry Rules
✓ **Wait for dark colors**: High-volume confirmation is key
✓ **Confirm divergences**: Use with price support/resistance
✓ **Trade with zero line**: Long above, short below for best odds
✓ **Multiple timeframes**: Align 1m, 5m, 15m signals
✓ **Watch for patterns**: V-bottoms and Λ-tops are reliable
### Exit Rules
✓ **Partial profits**: Take 50% at first target
✓ **Trail stops**: Use histogram color changes
✓ **Respect signals**: Exit on opposite dark color
✓ **Time stops**: Close positions before major news
✓ **End of day**: Square up before close
### Avoid
✗ **Don't chase light colors**: Low volume = low confidence
✗ **Don't ignore divergence**: Early warning system
✗ **Don't overtrade**: Wait for clear setups
✗ **Don't fight the trend**: Zero line dictates bias
✗ **Don't skip stops**: Always use risk management
## Risk Management
### Position Sizing
- **Dark green/red signals**: 1-2% account risk
- **Light signals**: 0.5% account risk or skip
- **Divergence plays**: 1% account risk (higher uncertainty)
- **Multiple confirmations**: Up to 2% account risk
### Stop Loss Placement
- **Trend trades**: Below/above recent swing (20-30 points typical)
- **Breakout trades**: Below/above breakout level (15-25 points)
- **Divergence trades**: Beyond divergence extreme (25-40 points)
- **Scalp trades**: Tight stops at 10-15 points
### Profit Targets
- **Minimum**: 1.5:1 reward to risk ratio
- **Scalps**: 15-25 points (quick in/out)
- **Swing**: 50-100 points (hold through pullbacks)
- **Runners**: Trail with histogram color changes
## Timeframe Recommendations
| Timeframe | Trading Style | Typical Hold | Advantages | Challenges |
|-----------|---------------|--------------|------------|------------|
| **1-minute** | Scalping | 1-5 minutes | Fast profits, many setups | Noisy, high false signals |
| **5-minute** | Intraday | 15-60 minutes | Balance of speed/clarity | Still requires quick decisions |
| **15-minute** | Swing | 1-4 hours | Clearer trends, less noise | Fewer opportunities |
| **1-hour** | Position | 4-24 hours | Strong signals, less monitoring | Wider stops required |
**Recommendation**: Start with 5-minute for best balance of signal quality and opportunity frequency.
## Combining with Other Indicators
### VMACDv3 + ACCDv3
- **Use**: Confirm volume flow with price momentum
- **Signal**: Both showing dark green = highest conviction long
- **Divergence**: VMACDv3 bullish + ACCDv3 bearish = examine price action
### VMACDv3 + RSI
- **Use**: Overbought/oversold with momentum confirmation
- **Signal**: RSI < 30 + dark green VMACD = strong reversal
- **Caution**: RSI > 70 + light green VMACD = potential false breakout
### VMACDv3 + Elder Impulse
- **Use**: Bar coloring + histogram confirmation
- **Signal**: Green Elder bars + dark green VMACD = aligned momentum
- **Exit**: Blue Elder bars + light colors = momentum stalling
## Limitations
- **Requires volume data**: Will not work on instruments without volume feed
- **Lagging indicator**: MACD inherently follows price (2-3 bar delay)
- **Consolidation noise**: Generates false signals in tight ranges
- **Gap handling**: Large gaps can distort volume-weighted values
- **Not standalone**: Should combine with price action and support/resistance
## Troubleshooting
**Problem**: Too many light colored signals
**Solution**: Increase Volume MA Length to 30-40 for stricter filtering
**Problem**: Missing entries due to waiting for dark colors
**Solution**: Lower Volume MA Length to 10-15 for more signals (accept lower quality)
**Problem**: Divergences not appearing
**Solution**: Verify volume data available; check if A/D line is calculating
**Problem**: Histogram colors not changing
**Solution**: Ensure real-time data feed; refresh indicator
## Version History
- **v3**: Removed traditional MACD, using volume-weighted MACD on price with A/D divergence
- **v2**: Added A/D divergence detection, volume strength filtering, enhanced histogram colors
- **v1**: Basic volume-weighted MACD on price
## Related Indicators
**Companion Tools**:
- **ACCDv3**: Volume-weighted MACD on A/D line (distribution focus)
- **RSIv2**: RSI with A/D divergence detection
- **DMI**: Directional Movement Index with A/D divergence
- **Elder Impulse**: Bar coloring system using volume-weighted MACD
**Use Together**: VMACDv3 (momentum) + ACCDv3 (distribution) + Elder Impulse (bar colors) = complete volume-based trading system
---
*This indicator is for educational purposes. Past performance does not guarantee future results. Always practice proper risk management and never risk more than you can afford to lose.*

Delta Candle ColorsThe Delta Divergences indicator provides a visual representation of volume delta, which measures the difference between buying pressure and selling pressure within a candle. This is achieved by using intrabar (lower timeframe) volume and price fluctuations to estimate the delta between buying and selling pressure within each bar.
By color-coding candles based on this volume delta, traders can gain insight into the strength behind price movements and spot potential divergences. When a candle closes positively (higher than the previous close) but the volume delta is negative (more selling than buying), or when a candle closes negatively with a positive delta (more buying than selling), it indicates a divergence. These divergences can signal potential trend exhaustion or possible reversals.
The indicator includes custom alerts that notify the trader when these divergences occur:
Positive close with negative delta: Signals that the price is rising, but selling pressure is higher.
Negative close with positive delta: Signals that the price is falling, but buying pressure is higher.
In addition to color-coding candles based on delta, the indicator provides an option to display delta labels directly on the chart for each candle.
Finally, the option to only show divergences can be turned on. When enabled, non-divergent candles are colored normally, while only candles with delta divergences are highlighted, allowing traders to focus on the most relevant market information.

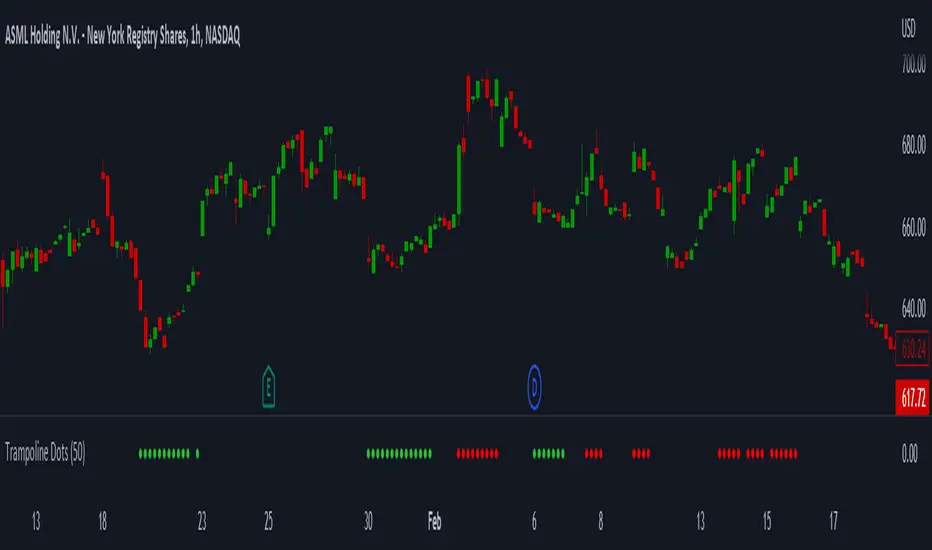
Trampoline DotsTrampoline Dots (Price Divergence)
Higher Time Frame Price Divergence:
Trampoline Dots serve as a "quick bounce" tool. These little dots will trigger whenever the higher aggregation MACD is above / below zero and the price is below / above the 50 period simple moving average. When these criteria are met, the price is usually under pressure of strong divergence, more often than not price will sharply reverse into the trend direction usually within the next few bars.
The Use of The Trampoline Dots:
This indicator can serve multiple ways. Obviously the main use case is the price divergence. These "dots" will not give you any precise & exact entry. But rather a zone of possible incoming reversal. There is no timing to it. All these dots will do is warn you about potential sharp reversal in the upcoming bars. It can be used by itself alone for sure, but the best way to utilize the dots is to use them in combination of other trend or momentum studies. The best signals are the ones that are within the larger time frame trend. Another great thing is that the visuals are really straight-forward and simple. It is either green dot or a red dot. Nothing more, nothing less. Also since the indicator is pretty small, it can be easily layered onto other studies as well which can create an additional confirmation for different patterns or setups.
Which Time Frame Are Reliable?
This indicator works on any time frame. But the most "stable" one is the daily & hourly time frame. My personal favorite is the hourly since these divergences can produce amazing entries in the daily trends (which are usually hidden on the daily chart). In the most aggresive trends, I like to see the green dots triggering around the 8 EMA and 13 EMA. Daily chart can show the daily and weekly (big divergences) that can take multiple days & weeks to resolve.
Hope it helps.
Cheat Code's RedemptionWELCOME TO THE CHEAT CODE REDEMPTION PACK!!!!
I want to take a deep dive into what this indicator consists of and how you can use it to improve your trading strategy.
-What does the CCR consist of?
The Oscillator:
The oscillator is a combination of a true strength index sampled from on-balance volume and a regular RSI at default settings. The reason I added the on-balance volume is that it does not tend to remain at overbought or oversold conditions as traditional momentum oscillators do.
The Histogram:
The histogram is copied to a tee from the MACD histogram, the only difference here is that I extended the moving averages to depict a special pairing; the ema55 slow and ema21 fast. I then converted it into another true strength index, as the calculations fit all time frames.
The Divergences:
The divergences of an indicator can be extremely useful in catching scalp opportunities, a DARK RED/GREEN represents a REGULAR divergence, while a SALMON/LIGHT GREEN color represents a HIDDEN divergence.
The moving average:
The moving average built into this indicator is depicted as an aqua or yellow line, when the oscillator is moving in an uptrend, the moving average will appear aqua, when the oscillator is in a downtrend it will appear yellow. Use this as confirmation bias or as the third derivative of market position.
Oscillator Colors:
The Oscillator color is an important thesis of this indicator. When the line is green, it means the market is effectively in an uptrend, when it is red, it means the market is in a downtrend. Use this to prevent longing in a serious downtrend and vice versa.
If you have any questions regarding the indicator(s), feel free to reach out to me in the comments or through Direct Message!!!
Safe Trading, Don't get Rekt
- CheatCode1 <3

BE-Synergistic RSI Fusion Strategy█ Overview of the Script:
The Synergistic RSI Fusion Strategy is a sophisticated technical analysis tool designed to detect market turning points (reversals) and high-momentum breakouts. Unlike standard indicators that simply tell you to "Buy" or "Sell" based on a crossed line or overbought/oversold levels, this script builds a structural trade setup using zones. It waits for price action to confirm the signal before acting.
█ Why "Synergistic RSI Fusion"?:
The core engine of the indicator makes it all:
Fusion : Standard RSI only looks at the closing price relative to the previous closing price. This script calculates a comprehensive RSI that incorporates the candle's Highs and Lows.
Why is this more powerful? Imagine a "Hammer" candle where price drops significantly during the session but recovers to close near the open. A standard RSI sees almost no change because the Close is near the Open. However, Fusion RSI captures the full volatility of that dip and recovery, recognizing the massive "effort" and hidden battle between buyers and sellers that standard RSI completely misses.
Synergy : It combines this advanced momentum reading with ATR (Average True Range) to define volatility-based entry and exit zones. It blends momentum (RSI) with market structure (Price Action Zones).
█ How it Stands Unique:
The Core engine: Capturing the true efforts of the movement in price.
Multi-Peak Divergence: Instead of simple A-to-B divergence, this script uses a state machine to track local peaks by filtering out weak signals and waits for a significant disagreement between price and momentum.
The Zone System: It doesn't plot signals blindly. When divergence is found, it draws two "waiting rooms" (Green and Red zones). The trade is only taken if the candle closes inside one of these zones.
█ Divergence Trades: The Two-Way Setup:
A unique feature of this script is that when a Divergence signal appears, it generates two potential entry zones: a Bullish zone and a Bearish zone.
The Rational Behind the Two-Way Approach:
New traders often assume a Divergence means "Reversal." However, experienced traders know that Divergence simply means "Tension is building."
Scenario A (The Reversal): The RSI is screaming that momentum is dying, but price is pushing higher. If price respects the divergence, it will drop into the reversal zone. This is the standard divergence trade.
Scenario B (The Failure/Trap): sometimes, momentum is so strong that it blows through the divergence. If price ignores the RSI warning and breaks into the continuation zone, it signals that the trend is incredibly powerful.
Why Trade Both Ways?
By placing zones on both sides, the script essentially says: " I know a big move is coming because of the tension (Divergence), but I will let the market prove direction first. " This prevents you from " catching a falling knife " by trying to pick the exact top or bottom.
The Counter-Trading Logic (The Trap):
The script includes advanced logic for failed trades. If you enter a trade and the Stop Loss is hit immediately (a "fake-out"), the script adjusts the opposing zone by considering the liquidity of that particular candle.
Why? If the market traps Long traders and hits their stops, that selling pressure often fuels a massive move downwards. This logic allows the script to flip bias instantly and join the real move.
█ Continuation Trends: Why Price Runs After TP:
You may notice that often, after the Take Profit (TP) is hit, the price continues to run in that direction for a long time.
The "Breakout" Effect:
The Take Profit levels in this script are calculated using ATR (Average True Range). This is a conservative target based on recent average volatility.
Structural Breaks: The entry zones are usually positioned at key structural pivots. When price has enough energy to enter the zone and hit 100% of the ATR target, it effectively confirms a Break of Structure.
Momentum Release: The Divergence phase acts like a coiled spring. When that spring finally snaps (the trade entry), the release of energy is often far greater than just one ATR unit.
Psychology: When the TP is hit, it confirms the analysis was correct. This draws in other traders and algorithms who missed the initial entry, adding fuel to the fire and extending the trend.
█ Major Support & Resistance Zone:
The untested zones are typically the safe haven to place your SLs, which definitely act as Support & Resistance once the price approaches these zones.

Range Oascilator + LessDivergences + MACD+StochRSIRange Oscillator + EMA Filter
Calculates a custom oscillator based on the highest high and lowest low over a chosen period.
Generates BUY signals when the oscillator crosses up from the oversold zone and price is above the EMA.
Generates SELL signals when the oscillator crosses down from the overbought zone and price is below the EMA.
MACD (3‑10‑16 EMA Settings)
Uses fast EMA = 3, slow EMA = 10, signal EMA = 16.
Detects bullish and bearish crossovers.
These crossovers only trigger a single unified buy/sell signal if they coincide with Stochastic RSI being in oversold (for buy) or overbought (for sell) zones.
Stochastic RSI
Standard calculation with %K and %D smoothing.
Defines oversold (<20) and overbought (>80) zones.
Used both for divergence detection and as a filter for MACD signals.
Divergence Detection
RSI Divergence: Price makes a lower low but RSI makes a higher low (bullish), or price makes a higher high but RSI makes a lower high (bearish).
MACD Histogram Divergence: Price makes a lower low but MACD histogram makes a higher low (bullish), or price makes a higher high but MACD histogram makes a lower high (bearish).
Stochastic RSI Divergence: Similar logic applied to %K line.
Divergences are flagged only once per pivot to avoid repetitive signals.
Visuals
EMA plotted on chart.
BUY/SELL signals shown as triangles above/below bars.
Divergences shown as labels (e.g., “RSI BullDiv”, “MACD BearDiv”).
Unified MACD+Stoch RSI signals shown in distinct colors (lime for buy, orange for sell).

Smart RSI Divergence PRO | Auto Lines + Alerts📌 Purpose
This indicator automatically detects Regular and Hidden RSI Divergences between price action and the RSI oscillator.
It plots divergence lines directly on the chart, labels signals, and includes alerts for automated monitoring.
🧠 How It Works
1. RSI Calculation
RSI is calculated using the selected Source (default: Close) and RSI Length (default: 14).
2. Divergence Detection via Fractals
Swing points on both price and RSI are detected using fractal logic (5-bar patterns).
Regular Divergence:
Bearish: Price forms a higher high, RSI forms a lower high.
Bullish: Price forms a lower low, RSI forms a higher low.
Hidden Divergence:
Bearish: Price forms a lower high, RSI forms a higher high.
Bullish: Price forms a higher low, RSI forms a lower low.
3. Auto Drawing Lines
Lines are drawn automatically between divergence points:
Red = Regular Bearish
Green = Regular Bullish
Orange = Hidden Bearish
Blue = Hidden Bullish
Line width and transparency are adjustable.
4. Labels and Alerts
Labels mark divergence points with up/down arrows.
Alerts trigger for each divergence type.
📈 How to Use
Use Regular Divergences to anticipate trend reversals.
Use Hidden Divergences to confirm trend continuation.
Combine with support/resistance, trendlines, or volume for higher probability setups.
Recommended Timeframes: Works on all timeframes; more reliable on 1h, 4h, and Daily.
Markets: Forex, Crypto, Stocks.
⚙️ Inputs
Source (Close, HL2, etc.)
RSI Length
Toggle Regular / Hidden Divergence visibility
Toggle Lines / Labels
Line Width & Line Transparency
⚠️ Disclaimer
This script is for educational purposes only. It does not constitute financial advice.
Always test thoroughly before using in live trading.

Multi-Asset Cross Timeframe Divergence Ind. (MACDI) // AlgoFyreThe Multi-Asset Cross Timeframe Divergence Indicator (MACDI) identifies divergences in momentum like RSI across multiple assets and timeframes. It visually highlights lagging correlated asset momentum divergences, helping traders spot inefficiencies and potential trade opportunities in the following asset.
🔶 KEY FEATURES
🔸Average Momentum Trendline for Each Timeframe
The Average Momentum Trendline feature calculates the average momentum of multiple assets over specified timeframes. It uses smoothed values to determine the momentum trend for each timeframe on the average aggregated momentum of both assets. This trendline helps traders identify the overall direction of the market momentum, providing a clearer picture of potential price movements.
🔸Real-time Divergence Indication and Alert Table
The Real-time Divergence Indications and Alert Table feature visualizes detected divergences between the momentum values of the two assets across different timeframes. It identifies both bullish and bearish divergences, signaling lagging reversals in the the following asset and potential trading opportunities. When a divergence is detected, the system generates real-time visual indications on the chart and in an overview table for traders to act promptly. The alert table provides a comprehensive overview of all detected divergences, making it easier for traders to monitor and respond to market changes.
🔸Color and Size Based Labels on Price Chart based on Divergence Type
The Color and Size Based Labels feature visually represents divergences directly on the price chart. Bullish and bearish divergences are marked with distinct colors and sizes, making them easily identifiable at a glance. Larger labels indicate higher timeframes and thus generally more significance.
🔶 INSTRUCTION GUIDELINES
🔸Identify Divergence Clusters
The more divergences align, the higher the probability of a potential trend reversal in the asset. When multiple multi-timeframe divergences occur in both lower and higher timeframes within a local cluster, the probability of a reversal increases. This is valid for both for bullish and bearish divergences.
🔸Spot Low Probability Divergences
To further increase the probability, analyze the current state of the average momentum trendline. For a bullish reversal, a relatively low level of the average momentum trendline is preferred, whereas for a bearish reversal, a relatively high level is preferred.
🔶 INDIVIDUAL CONFIGURATION
🔸Leading Asset
This input allows the user to select the leading asset for the divergence analysis.
🔸Following Asset
This input allows the user to select the following asset for the divergence analysis.
🔸Higher Timeframe
This input sets the higher timeframe for the analysis.
🔸Lower Timeframe
This input sets the lower timeframe for the analysis.
🔸Show RSI Divergence
This input enables or disables the display of RSI divergence signals.
🔸RSI Length
This input sets the length of the RSI calculation.
🔸RSI Source
This input sets the source data for the RSI calculation (e.g., close price).
🔸RSI Smoothing Length
This input sets the length of the smoothing applied to the RSI values.
🔸Smoothing Method
This input sets the method used for smoothing the RSI values.
🔶 CONCLUSION
The Multi-Asset Cross Timeframe Divergence Indicator (MACDI) is a powerful tool for identifying momentum divergences across multiple assets and timeframes. Its visual cues and customizable table make it easy to use and interpret, providing valuable insights for trading decisions.

Potential Divergence Checker#### Key Features
1. Potential Divergence Signals:
Potential divergences can signal a change in price movement before it occurs. This indicator identifies potential divergences instead of waiting for full confirmation, allowing it to detect signs of divergence earlier than traditional methods. This provides more flexible entry points and can act as a broader filter for potential setups.
2. Exposing Signals for External Use:
One of its advanced features is the ability to expose signals for use in other scripts. This allows users to integrate divergence signals and related entry/exit points into custom strategies or automated systems.
3. Custom Entry/Exit Timing Based on Years and Days:
The indicator provides entry and exit signals based on years and days, which could be useful for time-specific market behavior, long-term trades, and back testing.
#### Basic Usage
This indicator can check for all types of potential divergences: bullish, hidden bullish, bearish, hidden bearish. All you need to do is choose the type you want to check for under “DIVERGENCE TYPE” in the settings. On the chart, potential bullish divergences will show up as triangles below the price candles. one the chart potential bearish divergences will show up as upside down triangles above the price candles
#### Signals for Advanced Usage
You can use this indicator as a source in other indicators or strategies using the following information:
“ PD: Bull divergence signal ” will return “1” when a divergence is present and “0” when not present
“ PD: HBull divergence(hidden bull) signal ” will return “1” when a divergence is present and “0” when not present
“ PD: Bear divergence signal ” will return “1” when a divergence is present and “0” when not present
“ PD: HBear divergence(hidden bear) signal ” will return “1” when a divergence is present and “0” when not present
“ PD: enter ” signal will return a “1” when both the days and years criteria in the “entry filter settings” are met and “0” when not met.
“ PD: exit ” signal will return a “1” when the days criteria in the “exit filter settings” are met and “0” when not met.
#### Examples of Using Signals
1. If you are testing a long strategy for Bitcoin and do not want it to run during bear market years(e.g., the second year after a US presidential election), you can enable the “year and day filter for entry,” uncheck the following years in the settings: 2010, 2014, 2018, 2022, 2026, and reference the signal below in our strategy
signal: “ PD: enter ”
2. Let’s say you have a good long strategy, but want to make it a bit more profitable, you can tell the strategy not to run on days where there is potential bearish divergence and have it only run on more profitable days using these signals and the appropriate settings in the indicator
signal: “ PD: Bear divergence signal ” will return a ‘0’ with no bearish divergence present
signal: “ PD: enter ” will return a “1” if the entry falls on a specific, more profitable day chosen in the settings
#### Disclaimer
The "Potential Divergence Checker" indicator is a tool designed to identify potential market signals. It may have bugs and not do what it should do. It is not a guarantee of future trading performance, and users should exercise caution when making trading decisions based on its outputs. Always perform your own research and consider consulting with a financial advisor before making any investment decisions. Trading involves significant risk, and past performance is not indicative of future results.

Adaptive RSI [BOSWaves]Adaptive RSI - Percentile-Based Momentum Detection with Dynamic Regime Thresholds
Overview
Adaptive RSI is a self-calibrating momentum oscillator that identifies overbought and oversold conditions through historical percentile analysis, constructing dynamic threshold boundaries that adjust to evolving market volatility and momentum characteristics.
Instead of relying on traditional fixed RSI levels (30/70 or 20/80) or static overbought/oversold zones, regime detection, threshold placement, and signal generation are determined through rolling percentile calculation, smoothed momentum measurement, and divergence pattern recognition.
This creates adaptive boundaries that reflect actual momentum distribution rather than arbitrary fixed levels - tightening during low-volatility consolidation periods, widening during trending environments, and incorporating divergence analysis to reveal momentum exhaustion or continuation patterns.
Momentum is therefore evaluated relative to its own historical context rather than universal fixed thresholds.
Conceptual Framework
Adaptive RSI is founded on the principle that meaningful momentum extremes emerge relative to recent price behavior rather than at predetermined numerical levels.
Traditional RSI implementations identify overbought and oversold conditions using fixed thresholds that remain constant regardless of market regime, often generating premature signals in strong trends or missing reversals in range-bound markets. This framework replaces static threshold logic with percentile-driven adaptive boundaries informed by actual momentum distribution.
Three core principles guide the design:
Threshold placement should correspond to historical momentum percentiles, not fixed numerical levels.
Regime detection must adapt to current market volatility and momentum characteristics.
Divergence patterns reveal momentum exhaustion before price reversal becomes visible.
This shifts oscillator analysis from universal fixed levels into adaptive, context-aware regime boundaries.
Theoretical Foundation
The indicator combines smoothed RSI calculation, rolling percentile tracking, adaptive threshold construction, and multi-pattern divergence detection.
A Hull Moving Average (HMA) pre-smooths the price source to reduce noise before RSI computation, which then undergoes optional post-smoothing using configurable moving average types. Confirmed oscillator values populate a rolling historical buffer used for percentile calculation, establishing upper and lower thresholds that adapt to recent momentum distribution. Regime state persists until the oscillator crosses the opposing threshold, preventing whipsaw during consolidation. Pivot detection identifies swing highs and lows in both price and oscillator values, enabling regular divergence pattern recognition through comparative analysis.
Five internal systems operate in tandem:
Smoothed Momentum Engine : Computes HMA-preprocessed RSI with optional post-smoothing using multiple MA methodologies (SMA, EMA, HMA, WMA, DEMA, RMA, LINREG, TEMA).
Historical Buffer Management : Maintains a rolling array of confirmed oscillator values for percentile calculation with configurable lookback depth.
Percentile Threshold Calculation : Determines upper and lower boundaries by extracting specified percentile values from sorted historical distribution.
Persistent Regime Detection : Establishes bullish/bearish/neutral states based on threshold crossings with state persistence between signals.
Divergence Pattern Recognition : Identifies regular bullish and bearish divergences through synchronized pivot analysis of price and oscillator values with configurable range filtering.
This design allows momentum interpretation to adapt to market conditions rather than reacting mechanically to universal thresholds.
How It Works
Adaptive RSI evaluates momentum through a sequence of self-calibrating processes:
Source Pre-Smoothing: Input price undergoes 4-period HMA smoothing to reduce bar-to-bar noise before oscillator calculation.
RSI Calculation: Standard RSI computation applied to smoothed source over configurable length period.
Optional Post-Smoothing: Raw RSI value undergoes additional smoothing using selected MA type and length for cleaner regime detection.
Historical Buffer Population: Confirmed oscillator values accumulate in a rolling array with size limit determined by adaptive lookback parameter.
Percentile Threshold Extraction: Array sorts on each bar to calculate upper percentile (bullish threshold) and lower percentile (bearish threshold) values.
Regime State Persistence: Bullish regime activates when oscillator crosses above upper threshold, bearish regime activates when crossing below lower threshold, neutral regime persists until directional threshold breach.
Pivot Identification: Swing highs and lows detected in both oscillator and price using configurable left/right parameters.
Divergence Pattern Matching: Compares pivot relationships between price and oscillator within min/max bar distance constraints to identify regular bullish (price LL, oscillator HL) and bearish (price HH, oscillator LH) divergences.
Together, these elements form a continuously updating momentum framework anchored in statistical context.
Interpretation
Adaptive RSI should be interpreted as context-aware momentum boundaries:
Bullish Regime (Blue): Activated when oscillator crosses above upper percentile threshold, indicating momentum strength relative to recent distribution favors upside continuation.
Bearish Regime (Red): Established when oscillator crosses below lower percentile threshold, identifying momentum weakness relative to recent distribution favors downside continuation.
Upper Threshold Line (Blue)**: Dynamic resistance level calculated from upper percentile of historical oscillator distribution - adapts higher during trending markets, lower during ranging conditions.
Lower Threshold Line (Red): Dynamic support level calculated from lower percentile of historical oscillator distribution - adapts lower during downtrends, higher during consolidation.
Regime Fill: Gradient coloring between oscillator and baseline (50) visualizes current momentum intensity - stronger color indicates greater distance from neutral.
Extreme Bands (15/85): Upper and lower extreme zones with strength-modulated transparency reveal momentum extremity - darker shading during powerful moves, lighter during moderate momentum.
Divergence Lines: Connect price and oscillator pivots when divergence pattern detected, appearing on both price chart and oscillator pane for confluence identification.
Reversal Markers (✦): Diamond signals appear at 80+ (bearish extreme) and sub-15 (bullish extreme) levels, marking potential exhaustion zones independent of regime state.
Percentile context, divergence confirmation, and regime persistence outweigh isolated oscillator readings.
Signal Logic & Visual Cues
Adaptive RSI presents four primary interaction signals:
Regime Switch - Long : Oscillator crosses above upper percentile threshold after previously being in bearish or neutral regime, suggesting momentum strength shift favoring bullish continuation.
Regime Switch - Short : Oscillator crosses below lower percentile threshold after previously being in bullish or neutral regime, indicating momentum weakness shift favoring bearish continuation.
Regular Bullish Divergence (𝐁𝐮𝐥𝐥) : Price forms lower low while oscillator forms higher low, revealing positive momentum divergence during downtrends - often precedes reversal or consolidation.
Regular Bearish Divergence (𝐁𝐞𝐚𝐫) : Price forms higher high while oscillator forms lower high, revealing negative momentum divergence during uptrends - often precedes reversal or correction.
Alert generation covers regime switches, threshold crossings, and divergence detection for systematic monitoring.
Strategy Integration
Adaptive RSI fits within momentum-informed and mean-reversion trading approaches:
Adaptive Regime Following : Use threshold crossings as primary trend inception signals where momentum confirms directional breakouts within statistical context.
Divergence-Based Reversals : Enter counter-trend positions when divergence patterns appear at extreme oscillator levels (above 80 or below 20) for high-probability mean-reversion setups.
Threshold-Aware Scaling : Recognize that tighter percentile spreads (e.g., 45/50) generate more signals suitable for ranging markets, while wider spreads (e.g., 30/70) filter for stronger trend confirmation.
Extreme Zone Confluence : Combine reversal markers (✦) with divergence signals for maximum-conviction exhaustion entries.
Multi-Timeframe Regime Alignment : Apply higher-timeframe regime context to filter lower-timeframe entries, taking only setups aligned with dominant momentum direction.
Smoothing Optimization : Increase smoothing length in choppy markets to reduce false signals, decrease in trending markets for faster response.
Technical Implementation Details
Core Engine : HMA-preprocessed RSI with configurable smoothing (SMA, HMA, EMA, WMA, DEMA, RMA, LINREG, TEMA)
Adaptive Model : Rolling percentile calculation over confirmed oscillator values with size-limited historical buffer
Threshold Construction : Linear interpolation percentile extraction from sorted distribution array
Regime Detection : State-persistent threshold crossing logic with confirmed bar validation
Divergence Engine : Pivot-based pattern matching with range filtering and duplicate prevention
Visualization : Gradient-filled regime zones, adaptive threshold lines, strength-modulated extreme bands, dual-pane divergence lines
Performance Profile : Optimized for real-time execution with efficient array management and minimal computational overhead
Optimal Application Parameters
Timeframe Guidance:
1 - 5 min : Micro-structure momentum detection for scalping and intraday reversals
15 - 60 min : Intraday regime identification with divergence-validated turning points
4H - Daily : Swing and position-level momentum analysis with macro divergence context
Suggested Baseline Configuration:
RSI Length : 18
Source : Close
Smooth Oscillator : Enabled
Smoothing Length : 20
Smoothing Type : SMA
Adaptive Lookback : 1000
Upper Percentile : 50
Lower Percentile : 45
Divergence Pivot Left : 15
Divergence Pivot Right : 15
Min Pivot Distance : 5
Max Pivot Distance : 60
These suggested parameters should be used as a baseline; their effectiveness depends on the asset's volatility profile, momentum characteristics, and preferred signal frequency, so fine-tuning is expected for optimal performance.
Parameter Calibration Notes
Use the following adjustments to refine behavior without altering the core logic:
Too many whipsaw signals : Widen percentile spread (e.g., 40/60 instead of 45/50) to demand stronger momentum confirmation, or increase "Smoothing Length" to filter noise.
Missing legitimate regime changes : Tighten percentile spread (e.g., 48/52 instead of 45/50) for earlier detection, or decrease "Smoothing Length" for faster response.
Oscillator too choppy : Increase "Smoothing Length" for cleaner readings, or switch "Smoothing Type" to RMA/TEMA for heavier smoothing.
Thresholds not adapting properly : Reduce "Adaptive Lookback" to emphasize recent behavior (500-800 bars), or increase it for more stable thresholds (1500-2000 bars).
Too many divergence signals : Increase "Pivot Left/Right" values to demand stronger swing confirmation, or widen "Min Pivot Distance" to space out detections.
Missing significant divergences : Decrease "Pivot Left/Right" for faster pivot detection, or increase "Max Pivot Distance" to compare more distant swings.
Prefer different momentum sensitivity : Adjust "RSI Length" - lower values (10-14) for aggressive response, higher values (21-28) for smoother trend confirmation.
Divergences appearing too late : Reduce "Pivot Right" parameter to detect divergences closer to current price action.
Adjustments should be incremental and evaluated across multiple session types rather than isolated market conditions.
Performance Characteristics
High Effectiveness:
Markets with mean-reverting characteristics and consistent momentum cycles
Instruments where momentum extremes reliably precede reversals or consolidations
Ranging environments where percentile-based thresholds adapt to volatility contraction
Divergence-driven strategies targeting momentum exhaustion before price confirmation
Reduced Effectiveness:
Extremely strong trending markets where oscillator remains persistently extreme
Low-liquidity environments with erratic momentum readings
News-driven or gapped markets where momentum disconnects from price temporarily
Markets with regime shifts faster than adaptive lookback can recalibrate
Integration Guidelines
Confluence : Combine with BOSWaves structure, volume analysis, or traditional support/resistance
Threshold Respect : Trust signals that occur after clean threshold crossings with sustained momentum
Divergence Context : Prioritize divergences appearing at extreme oscillator levels (80+/15-) over those in neutral zones
Regime Awareness : Consider whether current market regime matches historical momentum patterns used for calibration
Multi-Pattern Confirmation : Seek divergence patterns coinciding with reversal markers or threshold rejections for maximum conviction
Disclaimer
Adaptive RSI is a professional-grade momentum and divergence analysis tool. It uses percentile-based threshold calculation that adapts to recent market behavior but cannot predict future regime shifts or guarantee reversal timing. Results depend on market conditions, parameter selection, lookback period appropriateness, and disciplined execution. BOSWaves recommends deploying this indicator within a broader analytical framework that incorporates price structure, volume context, and comprehensive risk management.

RSI Divergences KittenRSI Divergences + Adjustable RSI σ-Bands + Band Pierce Signals (with optional US weekend filter)
Description:
This indicator combines three RSI tools into one clean workflow:
1. RSI σ-Bands (mean ± k·σ)
It builds dynamic upper/lower bands around RSI using a moving mean and standard deviation. These bands adapt to regime changes (expanding in volatile periods, contracting in quiet periods). Bands can be clipped to RSI’s natural 0–100 range and optionally filled for readability.
2. Band “Pierce” Signals
It prints a marker when RSI crosses outside the upper band (overextension) or outside the lower band (underextension). These pierces are useful as timing signals for mean-reversion setups, especially when you expect price to revert back toward a reference mean (e.g., VWAP). Optional “re-entry” markers show when RSI crosses back inside the bands.
3. Proper RSI Divergences (Regular + Hidden)
Divergences are detected using RSI pivots (not price pivots). At each RSI pivot, the script samples the corresponding price high/low on that pivot bar and compares it to the previous pivot within a configurable bar-distance window.
• Bullish divergence: price lower low + RSI higher low
• Hidden bullish: price higher low + RSI lower low
• Bearish divergence: price higher high + RSI lower high
• Hidden bearish: price lower high + RSI higher high
Line width is configurable for visibility.
Manual Band Adjustment (Near-Miss Control):
If your best reversals “nearly” tag the band, you can manually tune sensitivity without rewriting the math:
• Band offset (RSI points): nudges trigger levels
• Band width scale: tightens/widens the σ-band envelope
US Weekend Filter (Optional):
You can optionally suppress pierce/divergence signals during US weekend hours (Fri 17:00 ET → Sun 17:00 ET) and optionally shade those periods to help isolate low-liquidity behavior.
Notes / Intended Use:
This is designed as a mean-reversion timing tool, not a standalone trading system. For best results, combine signals with a market “mean” (e.g., rolling VWAP) and basic risk controls.

Custom Reversal Oscillator [wjdtks255]📊 Indicator Overview: Custom Reversal Oscillator
This indicator is a momentum-based oscillator designed to identify potential trend reversals by analyzing price velocity and relative strength. It visualizes market exhaustion and recovery through a dynamic histogram and signal dots, similar to premium institutional tools.
Key Components
Dynamic Histogram (Bottom Bars): Changes color based on momentum strength. Bright Green/Red indicates accelerating momentum, while Darker shades suggest fading strength.
Signal Line: A white line tracing the core momentum, helping to visualize the "wave" of the market.
Buy/Sell Dots: Small circles at the bottom (Mint) or top (Red) that signal high-probability reversal points when the market is overextended.
📈 Trading Strategy (How to Trade)
1. Long Entry (Buy Signal)
Condition 1: The price should ideally be near or above the 200 EMA (for trend following) or showing a Bullish Divergence.
Condition 2: The Histogram bars transition from Dark Red to Bright Green.
Condition 3: A Mint Buy Dot appears at the bottom of the oscillator (near the -25 level).
Entry: Enter on the close of the candle where the Buy Dot is confirmed.
2. Short Entry (Sell Signal)
Condition 1: The price is struggling at resistance or showing a Bearish Divergence.
Condition 2: The Histogram bars transition from Dark Green to Bright Red.
Condition 3: A Red Sell Dot appears at the top of the oscillator (near the +25 level).
Entry: Enter on the close of the candle where the Sell Dot is confirmed.
3. Exit & Take Profit
Take Profit: Close the position when the Signal Line reaches the opposite extreme or when the histogram color starts to fade (loses its brightness).
Stop Loss: Place your stop loss slightly below the recent swing low (for Longs) or above the recent swing high (for Shorts).
💡 Pro Tips for Accuracy
Watch for Divergences: The most powerful signals occur when the price makes a lower low, but the Custom Reversal Oscillator makes a higher low. This indicates "Hidden Strength" and a massive reversal is often imminent.

Trendlines with Breaks Oscillator [LuxAlgo]The Trendlines with Breaks Oscillator is an oscillator based on the Trendlines with Breaks indicator, and tracks the maximum distance on price from bullish and bearish trendline breakouts.
The oscillator features divergences and trendline breakout detection.
🔶 USAGE
This tool is based on our Trendlines with Breaks indicator, which detects bullish and bearish trendlines and highlights the breaks on the chart. Now, we bring you this tool as an oscillator.
The oscillator calculates the maximum distance between the price and the break of each trendline, for both bullish and bearish cases, then calculates the delta between both.
When the oscillator is above 0, the market is in an uptrend; when it is below 0, it is in a downtrend. An ascending slope indicates positive momentum, and a descending slope indicates negative momentum.
Trendline breaks are displayed as green and red dots on the oscillator. A green dot corresponds to a bullish break of a descending trendline, and a red dot corresponds to a bearish break of an ascending trendline.
The oscillator calculation depends on two parameters from the settings panel: short and long alpha length. These parameters are used to calculate a synthetic EMA with a variable alpha for both bullish and bearish breaks. The final result is the difference between the two averages.
As shown in the image, using the same trend detection parameters but different alphas can produce very different results. The larger the alphas, the smoother the oscillator becomes, detecting bigger trends but making it less reactive.
This tool features the same trendline detection system as the Trendlines with Breaks indicator, which is based on three main parameters: swing length, slope, and calculation method.
As we can see in the image above, the data collected for the oscillator calculation will be different when using different parameters. A larger length detects larger trends. A larger slope or a different calculation method also impacts the final result.
🔹 Signal Line
The signal line is a smoothed version of the oscillator; traders can choose the smoothing method and length used from the settings panel.
In the image, the signal line crossings are displayed as vertical lines. As we can see, the market usually corrects downward after a bearish crossing and corrects upward after a bullish crossing.
Traders can choose among 10 different smoothing methods for the signal line. In the image, we can see how different methods and lengths give different outputs.
🔹 Divergences
The tool features a divergence detector that helps traders understand the strength behind price movements. Traders can adjust the detection length from the settings panel.
As shown in the image, a bearish divergence occurs when the price prints higher highs, but the momentum on the histogram prints lower highs. A bullish divergence occurs when the price prints lower lows, but the histogram prints higher lows.
By adjusting the length of the divergence detector, traders can filter out smaller divergences, allowing the tool to only detect more significant ones.
The image above depicts divergences detected with different lengths; the larger the length, the bigger the divergences are detected.
🔶 SETTINGS
🔹 Trendlines
Swing Detection Lookback: The size of the market structure used for trendline detection.
Slope: Slope steepness, a value of 0 gives horizontal levels, values larger than 1 give a steeper slope
Slope Calculation Method: Choose how the slope is calculated
🔹 Oscillator
Short Alpha Length: Synthetic EMA short period
Long Alpha Length: Synthetic EMA long period
Smoothing Signal: Choose the smoothing method and period
Divergences: Enable or disable divergences and select the detection length.
🔹 Style
Bullish: Select bullish color.
Bearish: Select bearish color.

Moving Average Adaptive RSI [BackQuant]Moving Average Adaptive RSI
What this is
A momentum oscillator that reshapes classic RSI into a zero-centered column plot and makes it adaptive. It builds RSI from two parts:
• A sensitivity window that scans several recent bars to capture the strongest up and down impulses.
• A selectable moving average that smooths those impulses before computing RSI.
The output ranges roughly from −100 to +100 with 0 as the midline, with optional extra smoothing and built-in divergence detection.
How it works
Impulse extraction
• For each bar the script inspects the last rsi_sen bars and collects upward and downward price changes versus the current price.
• It keeps the maximum upward change and maximum downward change from that window, emphasizing true bursts over single-bar noise.
MA-based averaging
• The up and down impulse series are averaged with your chosen MA over rsi_len bars.
• Supported MA types: SMA, EMA, DEMA, WMA, HMA, SMMA (RMA), TEMA.
Zero-centered RSI transform
• RS = UpMA ÷ DownMA, then mapped to a symmetric scale: 100 − 200 ÷ (1 + RS) .
• Above 0 implies positive momentum bias. Below 0 implies negative momentum bias.
Optional extra smoothing
• A second smoothing pass can be applied to the final oscillator using smoothing_len and smooth_type . Toggle with “Use Extra Smoothing”.
Visual encoding
• The oscillator is drawn as columns around the zero line with a gradient that intensifies toward extremes.
• Static bands mark 80 to 100 and −80 to −100 for extreme conditions.
Key inputs and what they change
• Price Source : input series for momentum.
• Calculation Period (rsi_len) : primary averaging window on up and down components. Higher = smoother, slower.
• Sensitivity (rsi_sen) : how many recent bars are scanned to find max impulses. Higher = more responsive to bursts.
• Calculation Type (ma_type) : MA family that shapes the core behavior. HMA or DEMA is faster, SMA or SMMA is slower.
• Smoothing Type and Length : optional second pass to calm noise on the final output.
• UI toggles : show or hide the oscillator, candle painting, and extreme bands.
Reading the oscillator
• Midline cross up (0) : momentum bias turning positive.
• Midline cross down (0) : momentum bias turning negative.
• Positive territory :
– 0 to 40: constructive but not stretched.
– 40 to 80: strong momentum, continuation more likely.
– Above 80: extreme risk of mean reversion grows.
• Negative territory : mirror the same levels for the downside.
Divergence detection
The script plots four divergence types using pivot highs and lows on both price and the oscillator. Lookbacks are set by lbL and lbR .
• Regular bullish : price lower low, oscillator higher low. Possible downside exhaustion.
• Hidden bullish : price higher low, oscillator lower low. Bias to trend continuation up.
• Regular bearish : price higher high, oscillator lower high. Possible upside exhaustion.
• Hidden bearish : price lower high, oscillator higher high. Bias to trend continuation down.
Labels: ℝ for regular, ℍ for hidden. Green for bullish, red for bearish.
Candle coloring
• Optional bar painting: green when the oscillator is above 0, red when below 0. This is for visual scanning only.
Strengths
• Adaptive sensitivity via a rolling impulse window that responds to genuine bursts.
• Configurable MA core so you can match responsiveness to the instrument.
• Zero-centered scale for simple regime reads with 0 as a clear bias line.
• Built-in regular and hidden divergence mapping.
• Flexible across symbols and timeframes once tuned.
Limitations and cautions
• Trends can remain extended. Treat extremes as context rather than automatic reversal signals.
• Divergence quality depends on pivot lookbacks. Short lookbacks give more signals with more noise. Long lookbacks reduce noise but add lag.
• Double smoothing can delay zero-line transitions. Balance smoothness and timeliness.
Practical usage ideas
• Regime filter : only take long setups from your separate method when the oscillator is above 0, shorts when below 0.
• Pullback confirmation : in uptrends, look for dips that hold above 0 or turn up from 0 to 40. Reverse for downtrends.
• Divergence as a heads-up : wait for a zero-line cross or a price trigger before acting on divergence.
• Sensitivity tuning : start with rsi_sen 2 to 5 on faster timeframes, increase slightly on slower charts.
Alerts
• MA-A RSI Long : oscillator crosses above 0.
• MA-A RSI Short : oscillator crosses below 0.
Use these as bias or timing aids, not standalone trade commands.
Settings quick reference
• Calculation : Price Source, Calculation Type, Calculation Period, Sensitivity.
• Smoothing : Smoothing Type, Smoothing Length, Use Extra Smoothing.
• UI : Show Oscillator, Paint Candles, Show Static High and Low Levels.
• Divergences : Pivot Lookback Left and Right, Div Signal Length, Show Detected Divergences.
Final thoughts
This tool reframes RSI by extracting strong short-term impulses and averaging them with a moving-average model of your choice, then presenting a zero-centered output for clear regime reads. Pair it with your structure, risk and execution process, and tune sensitivity and smoothing to the market you trade.

Bullish Divergence SMI Base & Trigger with ATR FilterDescription:
A bullish divergence indicator combining the Stochastic Momentum Index (SMI) and Average True Range (ATR) to pinpoint high-probability entries:
1. Base Arrow (Orange ▲):
• Marks every SMI %K / %D bullish crossover where %K < –70 (deep oversold)—the first half of the divergence setup.
• Each new qualifying crossover replaces the previous base, continuously “arming” the divergence signal.
• Configurable SMI lookbacks, oversold threshold, and a base timeout (default 100 days) to clear stale bases.
2. Trigger Arrow (Green ▲):
• Completes the bullish divergence: fires on the next SMI bullish crossover where %K > –60 and price has dropped below the base arrow’s close by at least N × ATR (default 1 × 14-day ATR).
• A dashed green line links the base and trigger to visually confirm the divergence.
• Resets after triggering, ready for a new divergence cycle.
Inputs:
• SMI %K Length, EMA Smoothing, %D Length
• Oversold Base Level (–70), Trigger Level (–60)
• ATR Length (14), ATR Multiplier (1.0)
• Base Timeout (100 days)
Ideal for any market, this study highlights genuine bullish divergences—oversold momentum crossovers that coincide with significant price reactions—before entering long trades.

RSI Divergence and GradientThe RSI Divergence and Gradient Indicator simplifies the process of identifying the relationship between price action and the Relative Strength Index (RSI). By integrating RSI data directly into the price chart, traders no longer need to open a separate pane to monitor RSI or manually compare price action and RSI.
This indicator allows traders to easily spot overbought or oversold conditions and detect divergences between price and RSI. These signals can help identify potential reversal points and more effectively assess trend strength.
Features
RSI Divergences: The script identifies and plots bullish and bearish RSI divergences, which can signal potential reversals. Bullish divergences are indicated by an upward triangle below the price bars, while bearish divergences are indicated by a downward triangle above the price bars.
Overbought/Oversold Gradient: The script uses a color gradient to highlight overbought and oversold conditions on the chart, helping traders visualize momentum and trend strength. The gradient dynamically adjusts based on RSI values, transitioning through different colors to represent the intensity of overbought or oversold conditions.
Customizable Gradient: The gradient is customizable, allowing traders to set their own thresholds for overbought and oversold levels, and to choose the colors that best suit their trading style. This flexibility ensures the indicator can be tailored to individual preferences.
How It Works
RSI Calculation: The indicator calculates RSI using the standard 14-period length by default, but this can be adjusted to suit the trader's needs.
Divergence Detection: The script identifies divergences by comparing the highest and lowest points of the RSI with the corresponding price levels over the RSI period length. When a divergence is detected, it is plotted on the chart to indicate a potential reversal.
Gradient Coloring: The gradient coloring system changes the bar colors based on RSI levels. The color transitions from a neutral tone to specified start and end colors as RSI approaches overbought or oversold thresholds, providing a visual cue for potential overextended market conditions.
Intended Use
This indicator is particularly useful for traders who want to combine momentum analysis with divergence signals to identify potential reversal points or confirm trend strength. The visual gradient aids in quickly assessing market conditions, making it easier to spot high-probability trading opportunities.

Market Matrix ViewThis technical indicator is designed to provide traders with a quick and integrated view of market dynamics by combining several popular indicators into a single tool. It's not a magic bullet, but a practical aid for analyzing buying/selling pressure, trends, volume, and divergences, saving you time in the decision-making process. Built for flexibility, the indicator adapts to various trading styles (scalping, swing, or long-term) and offers customizable settings to suit your needs.
🟡 Multi-Timeframe Trends
➤ This section displays the trend direction (bullish, bearish, or neutral) across 15-minute, 1-hour, 4-hour, and Daily timeframes, providing multi-timeframe market context. Timeframes lower than the one currently selected will show "N/A."
➤It utilizes fast and slow Exponential Moving Averages (EMAs) for each timeframe:
15m: Fast EMA 42, Slow EMA 170
1h: Fast EMA 40, Slow EMA 100
4h: Fast EMA 36, Slow EMA 107
Daily: Fast EMA 20, Slow EMA 60
🟡 Smart Flow & RVOL
➤ This section displays "Buying Pressure" or "Selling Pressure" signals based on indicator confluence, alongside volume activity ("High Activity," "Normal Activity," or "Low Activity").
➤ Smart Flow combines Chaikin Money Flow (CMF) and Money Flow Index (MFI) to detect buying/selling pressure. CMF measures money flow based on price position within the high-low range, while MFI analyzes money flow considering typical price and volume. A signal is generated only when both indicators simultaneously increase/decrease beyond an adjustable threshold ("Buy/Sell Sensitivity") and volume exceeds a Simple Moving Average (SMA) scaled by the "Volume Multiplier."
➤ RVOL (Relative Volume) calculates relative volume separately for bullish and bearish candles, comparing recent volume (fast SMA) with a reference volume (slow SMA). Thresholds are adjusted based on the selected mode.
🟡 ADX & RSI
This section displays trend strength ("Strong," "Moderate," or "Weak"), its direction ("Bullish" or "Bearish"), and the RSI momentum status ("Overbought," "Oversold," "Buy/Sell Momentum," or "Neutral").
➤ ADX (Average Directional Index) measures trend strength (above 40 = "Strong," 20–40 = "Moderate," below 20 = "Weak"). Direction is determined by comparing +DI (upward movement) with -DI (downward movement). Additionally, an arrow indicates whether the trend's strength is decreasing or increasing.
➤RSI (Relative Strength Index) evaluates price momentum. Extreme levels (above 80/85 = "Overbought," below 15/20 = "Oversold") and intermediate zones (47–53 = "Neutral," above 53 = "Buy Momentum," below 47 = "Sell Momentum") are adjusted based on the selected mode.
🟡 When these signals are active for a potential trade setup, the table's background lights up green or red, respectively.
🟡 Volume Spikes
➤This feature highlights bars with significantly higher volume than the recent average, coloring them yellow on the chart to draw attention to intense market activity.
➤It uses the Z-Score method to detect volume anomalies. Current volume is compared to a 10-bar Simple Moving Average (SMA) and the standard deviation of volume over the same period. If the Z-Score exceeds a certain threshold, the bar is marked as a volume spike.
🟡 Divergences (Volume Divergence Detection)
➤ This feature marks divergences between price and technical indicators on the chart, using diamond-shaped labels (green for bullish divergences, red for bearish divergences) to signal potential trend reversals.
➤ It compares price deviations from a Simple Moving Average (SMA) with deviations of three indicators: Chaikin Money Flow (CMF), Money Flow Index (MFI), and On-Balance Volume (OBV). A bullish divergence occurs when price falls below its average, but CMF, MFI, and OBV rise above their averages, indicating hidden accumulation. A bearish divergence occurs when price rises above its average, but CMF, MFI, and OBV fall, suggesting distribution. The length of the moving averages is adjustable (default 13/10/5 bars for Scalping/Balanced/Swing), and detection thresholds are scaled by "Divergence Sensitivity" (default 1.0).
🟡 Adaptive Stop-Loss (ATR)
➤Draws dynamic stop-loss lines (red, dashed) on the chart for buy or sell signals, helping traders manage risk.Uses the Average True Range (ATR) to calculate stop-loss levels, set at low/high ± ATR × multiplier
🟡 Alerts for trend direction changes in the Info Panel:
➤ Triggers notifications when the trend shifts to Bullish (when +DI crosses above -DI) or Bearish (when +DI crosses below -DI), helping you stay informed about key market shifts.
How to use: Set alerts in Trading View for “Trend Changed to Bullish” or “Trend Changed to Bearish” with “Once Per Bar Close” for reliable signals.
🟡 Settings (Inputs)
➤ The indicator offers customizable settings to fit your trading style, but it's already optimized for Scalping (1m–15m), Balanced (16m–3h59m), and Swing (4h–Daily) modes, which automatically adjust based on the selected timeframe. The visible inputs allow you to adjust the following parameters:
Show Info Panel: Enables/disables the information panel (default: enabled).
Show Volume Spikes: Turns on/off coloring for volume spike bars (default: enabled).
Spike Sensitivity: Controls the Z-Score threshold for detecting volume spikes (default: 2.0; lower values increase signal frequency).
Show Divergence: Enables/disables the display of divergence labels (default: enabled).
Divergence Sensitivity: Adjusts the thresholds for divergence detection (default: 1.0; higher values reduce sensitivity).
Divergence Lookback Length: Sets the length of the moving averages used for divergences (default: 5, automatically adjusted to 13/10/5 for Scalping/Balanced/Swing).
RVOL Reference Period: Defines the reference period for relative volume (default: 20, automatically adjusted to 7/15/20).
RSI Length: Sets the RSI length (default: 14, automatically adjusted to 5/10/14).
Buy Sensitivity: Controls the increase threshold for Buying Pressure signals (default: 0.007; higher values reduce frequency).
Sell Sensitivity: Controls the decrease threshold for Selling Pressure signals (default: 0.007; higher values reduce frequency).
Volume Multiplier (B/S Pressure): Adjusts the volume threshold for Smart Flow signals (default: 0.6; higher values require greater volume).
🟡 This indicator is created to simplify market analysis, but I am not a professional in Pine Script or technical indicators. This indicator is not a standalone solution. For optimal results, it must be integrated into a well-defined trading strategy that includes risk management and other confirmations.

CVD Divergence Strategy.1.mmThis is the matching Strategy version of Indicator of the same name.
As a member of the K1m6a Lions discussion community we often use versions of the Cumulative Volume Delta indicator
as one of our primary tools along with RSI, RSI Divergences, Open interest, Volume Profile, TPO and Fibonacci levels.
We also discuss visual interpretations of CVD Divergences across multiple time frames much like RSI divergences.
RSI Divergences can be identified as possible Bullish reversal areas when the RSI is making higher low points while
the price is making lower low points.
RSI Divergences can be identified as possible Bearish reversal areas when the RSI is making lower high points while
the price is making higher high points.
CVD Divergences can also be identified the same way on any timeframe as possible reversal signals. As with RSI, these Divergences
often occur as a trend's momentum is giving way to lower volume and areas when profits are being taken signaling a possible reversal
of the current trending price movement.
Hidden Divergences are identified as calculations that may be signaling a continuation of the current trend.
Having not found any public domain versions of a CVD Divergence indicator I have combined some public code to create this
indicator and matching strategy. The calculations for the Cumulative Volume Delta keep a running total for the differences between
the positive changes in volume in relation to the negative changes in volume. A relative upward spike in CVD is created when
there is a large increase in buying vs a low amount of selling. A relative downward spike in CVD is created when
there is a large increase in selling vs a low amount of buying.
In the settings menu, the is a drop down to be used to view the results in alternate timeframes while the chart remains on current timeframe. The Lookback settings can be adjusted so that the divs show on a more local, spontaneous level if set at 1,1,60,1. For a deeper, wider view of the divs, they can be set higher like 7,7,60,7. Adjust them all to suit your view of the divs.
To create this indicator/strategy I used a portion of the code from "Cumulative Volume Delta" by @ contrerae which calculates
the CVD from aggregate volume of many top exchanges and plots the continuous changes on a non-overlay indicator.
For the identification and plotting of the Divergences, I used similar code from the Tradingview Technical "RSI Divergence Indicator"
This indicator should not be used as a stand-alone but as an additional tool to help identify Bullish and Bearish Divergences and
also Bullish and Bearish Hidden Divergences which, as opposed to regular divergences, may indicate a continuation.
