Crazy IBSThis is a mean reversion strategy using the IBS indicator, which calculates ratios of h/l/c/o. It does well particularly on NQ and VXX, but try it on other things! It tends to outperform other R2M strategies like RSI and BB mean reversion, at least in early 2022.
Pesquisar nos scripts por "Candlestick"

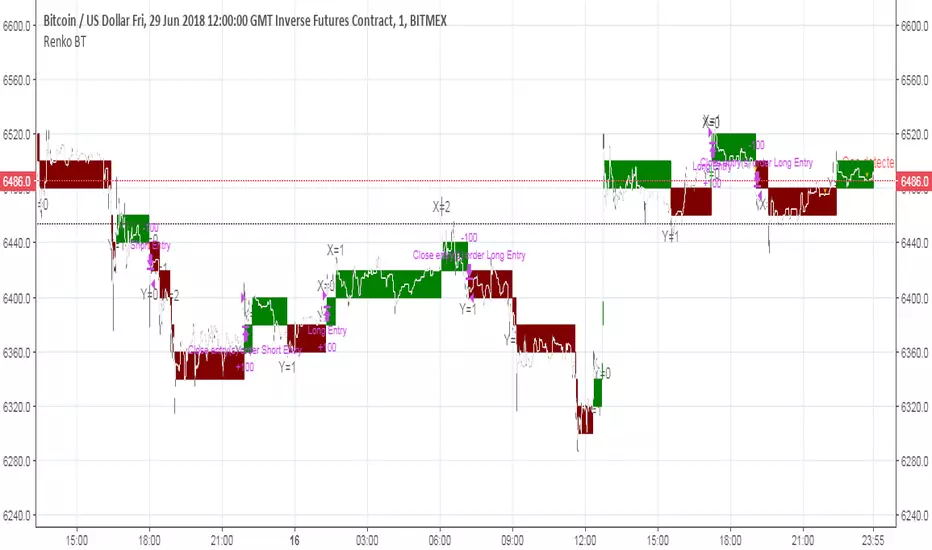
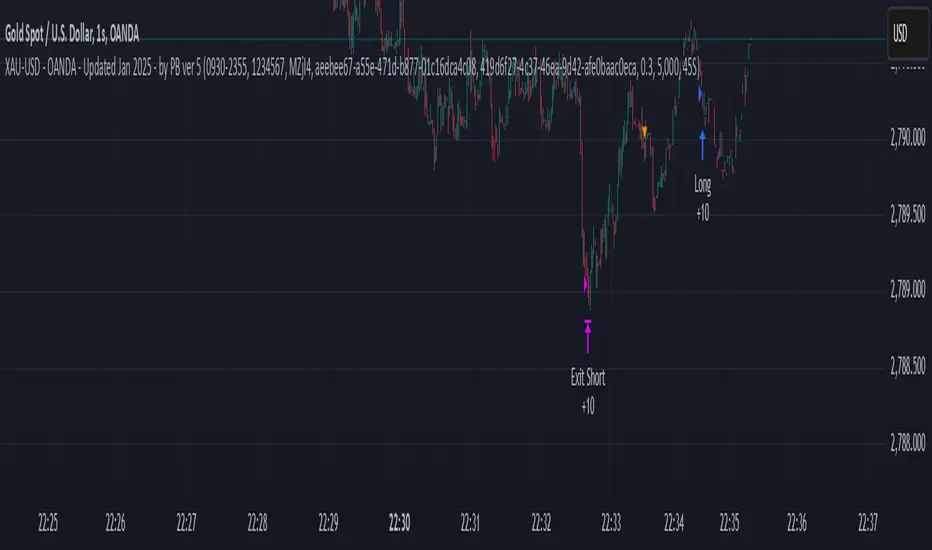
XAU-USD - OANDA - Updated Jan 2025 - by PB ver 5Script Title: XAU-USD - OANDA - Updated Jan 2025 - by PB ver 5
Description:
This strategy is designed for trading XAU/USD (Gold) on the OANDA platform, optimized with a session-based filter and Renko bar indicators for enhanced price action analysis. The script utilizes trailing stop loss functionality to manage risk effectively and allows flexibility for both long and short trades.
Key Features:
Date Filter: This strategy includes a time filter to backtest the performance from January 1st, 2025 to December 31st, 2025. Users can enable or disable the filter based on their preference.
Session Filter: Customizable session inputs allow the user to define the active trading session using a time range (default is 09:20-15:16) and the days of the week (default is all days, 1-7). The strategy will only enter trades during the active session, ensuring more controlled and focused trading.
Renko Bar Strategy: This strategy uses Renko charts, a popular price action tool, to detect buy and sell signals based on the crossover of Renko close and open prices. Users can adjust the Renko block size and the Renko value used for detecting price action shifts.
Trailing Stops: The script applies a trailing stop loss mechanism for both long and short trades. The trailing stop is dynamically updated to follow the market as prices move in favor of the trade. It uses a 5000-point trailing stop (adjustable by the user).
Flexible Trade Settings: Users can enable or disable long and short positions through simple toggle switches. The strategy allows for full control over trade entry and exit.
How It Works:
Long Trades: A long position is entered when the Renko close crosses above the Renko open. The position will be exited using a trailing stop, which follows the price in the market.
Short Trades: A short position is entered when the Renko close crosses below the Renko open. The position will also exit using a trailing stop.
The strategy will automatically close positions if the session ends or if the user manually exits the trades.
Customization Options:
Backtest Date Range: Set the start and end dates to backtest the strategy over a specific time period.
Session and Days: Adjust the session time and which days of the week the strategy is active.
Renko Block Size: Customize the Renko block size for finer control over price action signals.
Trailing Stop Distance: Adjust the trailing stop loss to your preferred risk levels.
Limitations and Considerations:
Renko Charting: Renko charts may not suit every trading style, as they are based on price movement rather than time. This strategy is designed for traders who prefer this style of charting.
Backtest Results: Always review the strategy's backtest results with realistic parameters. The strategy uses historical data, and past performance is not indicative of future results. Be aware of slippage and commission costs in real-world trading scenarios.
Manual Intervention: Users should monitor active trades and intervene manually if required.
Ideal Usage:
This strategy is suited for traders looking to use price action-based strategies with Renko charts for XAU/USD on the OANDA platform.
Ideal for those who want to automate their entry and exit points with trailing stop mechanisms while having control over the session time and backtesting period.
Disclaimer:
Past performance does not guarantee future results. Always use caution when using trading strategies and adjust parameters based on market conditions. The strategy is provided for educational purposes and should be tested on paper before live trading.
The best scalping strategyPullbacks are always the most difficult part of trading, and when this happens, we struggle to make a decision about whether to continue trading and wait for a recovery or reduce losses. Similarly, when the instrument has a good trend, it is often difficult to make a decision if we want to withdraw some profit. This strategy is aimed at facilitating these decisions, it looks for price impulses and, based on this, calculates the pullback of the price at which it is necessary to place limit buy orders (yellow lines) based on Fibonacci levels. We place the stop loss on the red line, on the blue and pink lines it is necessary to put a take profit of 50% each. The entry and exit indicator does not always correctly display the entry and exit points, so it is necessary to work with limit orders.
-In the settings, you can change the number of candles participating in the cycle, if the price is at the same level for a long time and limit orders do not work, then it is recommended to reduce the number of candles.
-The remaining parameters are still under development, it is better not to touch them. In the future, I plan to add a limit on the amount of loss as a percentage, for more fine-tuning of risk management
Откаты всегда являются самой сложной частью торговли, и когда это происходит, мы изо всех сил пытаемся принять решение о том, продолжать ли торговлю и ждать восстановления или сократить убытки. Точно так же, когда инструмент имеет хороший тренд, часто трудно принять решение, если мы хотим снять некоторую прибыль. Эта стратегия направлена на то, чтобы облегчить эти решения, она ищет ценовые импульсы и исходя из этого рассчитывает по уровням фибоначи откат цены, на которых необходимо разместить лимитные ордера на покупку (желтые линии). Стоп-лос размещаем на красной линии, на синей и розовой линии необходимо поставить тэйк-профит по 50%. Индикатор входа и выхода не всегда корректно отображает точку входа и выхода, поэтому необходимо работать с лимитными ордерами.
-В настройках можно менять количество свечей участвующих в цикле, если цена долго находится на одном уровне и не срабатывают лимитные ордера то рекомендуются уменьшить количество свечей.
-Остальные параметры до сих пор находятся в разработке, их лучше не трогать. В дальнейшем планирую добавить ограничение размера убытка в процентах, для более тонкой настройки риск менеджмента

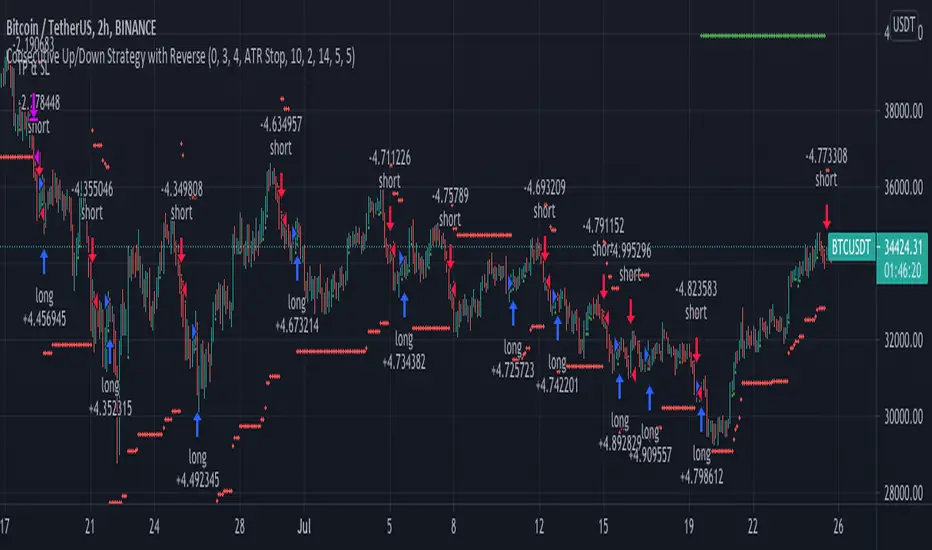
Consecutive Up/Down Strategy with Reverse and SLExtension of the built-in strategy by TradingView. The strategy buys after an X amount of
consecutive bullish bars and viceversa for selling. This logic can be reversed and a Stop Loss
with Take Profit can be added. There's also an option to adapt the SL into a Trailing Stop.
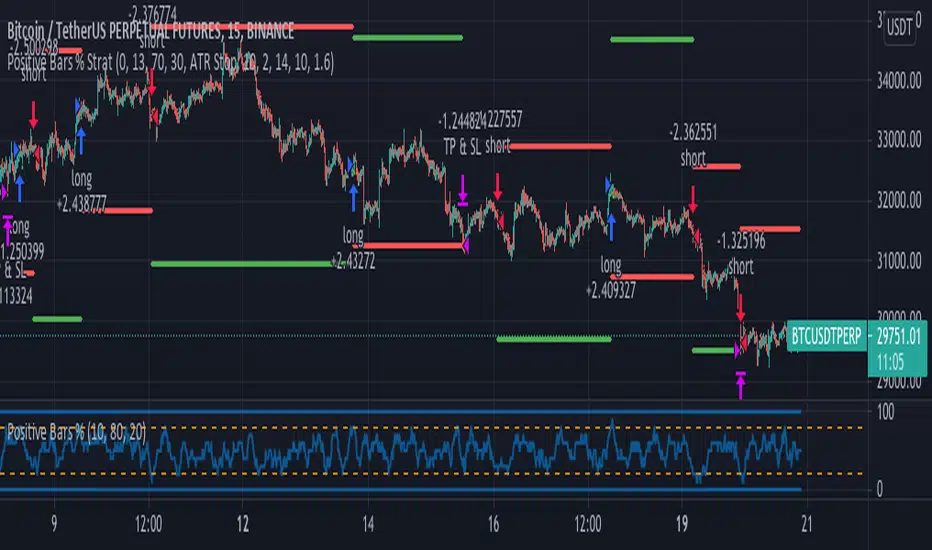
Positive Bars % StrategyBased on the calculations by ZenAndTheArtOfTrading. I added stop loss, take profit and reverse code lines.
The Positive Bars % calculates the number of green (positive) bars, relative to a look back period, defined
by the user. If the percentage is low, it means that there was a bigger number of red candles in the
lookback period. The strategy goes long when the percentage is high and short when it's low.
This logic can be reversed with positive results on different time frames.
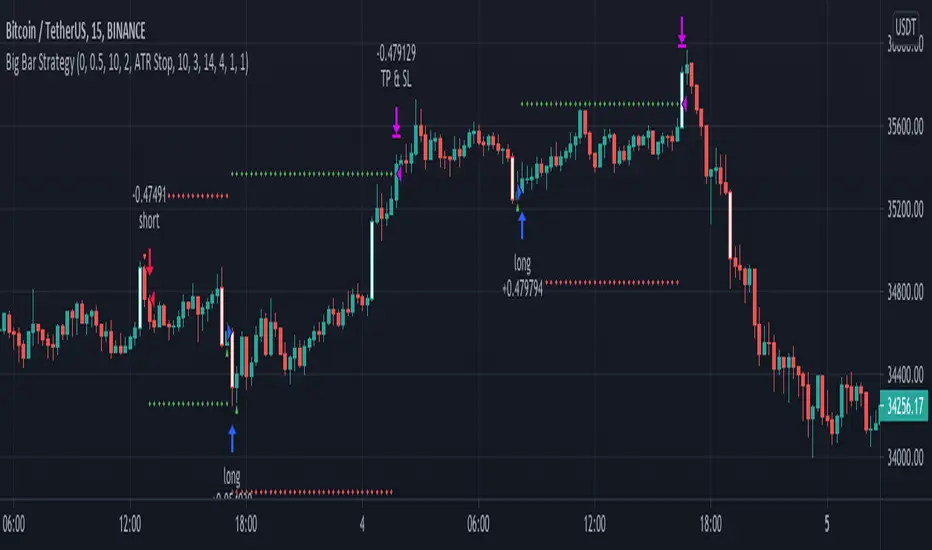
Big Bar Strategy// This strategy detects and uses big bars to enter a position. When the Big Bar
// is bearish (red candle) the position will be long and viceversa
// for short positions. The stop loss (optional) is placed on the low of the
// candle used to trigger the position and user inputs allow you to modify the
// size of the SL. Take profit is placed on a reward ratio of 1. User can also modify
// the size of the bar body used to determine if we have a real Big Bar and
// filter out Doji bars. Big Bars are determined relative to the previous X period size,
// which can also be modified, as well as the required size of the Big Bar relative to this period average.
Trend Reversal / Potential pressureThis strategy looks for potential trend reversals by looking at hammer candles (defined in the is_hammer and is_stick functions). After getting confirmation a trade is open with determined SL/TP. ATR is used to justify the volatility. Fine-tune the parameters for your specific use case.
Strategy Test - Cancel Limit Order and Position SizingWhile working thru another project had the need to troubleshoot the canceling of a limit order syntax/process as well as work thru the code and logic to automagically set the position sizing based off two user inputs (Amount to Risk in USD and Leverage to Use) and the potential entry and stop levels for an inside bar candle pattern in this scenario. Once we find the distance between the entry and stop level we can figure out the stop percentage amount which matches up with what a user would see manually drawing using the long or short tool in tradingview. Once we have the user inputs and levels we can get an amount to be used in later qty= type of places in zeeee pine script....


Trend Pattern StrategySTRATEGY VERSION
With thanks to AndresVasconez
14 candle crossovers (price>price(14)) displayed as grid pattern.
so thats price value (user choose if price is open,close,OHLC4 etc) greater than (>) previous price value, = show green square
then (if price>price(2) = show green square (etc all the way up to 14))
Resulting combination of square patterns showing trend and trend strength, mirrored so indicator forms a visual pattern, where a new trend starts as a color change in the middle like a point, and grows outwards if the trend continues.
recommended basic entry / exit is:
Enter Buy when all squares (directly below candle) are green, exit buy when all squares are red.
Enter Sell when all squares are red, Exit Sell when all squares are green


Quantitative Consecutive Trading Strategy/SystemWorks extremely well with many stocks. Results are very similar to my "R Difference Trading System".
This strategy was tested on all components of the Dow since 1987. It averaged 23% a year. Slippage and commission were accounted for. 72% of the trades were profitable. The average maximum drawdown was around 15%.
This strategy has also been tested against random. The results indicate that this strategy's results are not due to random chance, but rather it has an edge in the stock market.
Does not repaint, and is not a curve fitted strategy.

Intra-Day Price Correlation Strategy Designed to make lots of small profitable trades. Works best on 1 to 5 minute timeframes. Commission default set to .1% for common Crypto exchanges.