Bullish and Bearish Candlestick Patterns StrategyThe strategy is a combination of candlestick pattern analysis and Fibonacci retracement levels to identify potential buy and sell signals in the market. Here's how the strategy works and how you can trade accordingly:
Candlestick Pattern Analysis:
The strategy looks for specific bullish and bearish candlestick patterns to identify potential trend reversals or continuations. The bullish patterns include:
Bullish Engulfing: This pattern occurs when a bullish candle fully engulfs the previous bearish candle.
Hammer: It is a single candlestick pattern with a small body and a long lower wick, indicating a potential bullish reversal.
Morning Star: This pattern consists of three candles, with the middle one being a small-bodied candle that gaps down and the other two being bullish candles.
The bearish patterns include:
Bearish Engulfing: Similar to the bullish engulfing, but this time, a bearish candle fully engulfs the previous bullish candle.
Shooting Star: A single candlestick pattern with a small body and a long upper wick, suggesting a potential bearish reversal.
Evening Star: This pattern is the opposite of the morning star, with a small-bodied candle that gaps up between two bearish candles.
Fibonacci Retracement Levels:
The strategy uses Fibonacci retracement levels to determine potential support and resistance levels in the market. The main level considered in this strategy is the Fibonacci 0.5 level, which is the midpoint of the previous swing move.
Trading Accordingly:
To trade using this strategy, follow these steps:
a. Observe the Chart: Apply the indicator to your preferred chart, and observe the candlestick patterns and the plotted support, resistance, and Fibonacci 0.5 levels.
b. Buy Signal: A buy signal is generated when any of the bullish candlestick patterns (Bullish Engulfing, Hammer, Morning Star) occur, and the low price of the current candle is above or equal to the Fibonacci 0.5 level. This suggests a potential bullish reversal or continuation of an existing uptrend.
c. Sell Signal: A sell signal is generated when any of the bearish candlestick patterns (Bearish Engulfing, Shooting Star, Evening Star) occur, and the high price of the current candle is below or equal to the Fibonacci 0.5 level. This indicates a potential bearish reversal or continuation of an existing downtrend.
d. Risk Management: Place stop-loss orders to protect your position in case the market moves against your trade. Consider setting the stop-loss below the recent swing low for buy trades and above the recent swing high for sell trades.
e. Take Profit: Set a target for taking profits based on your risk-reward ratio. You can use the recent swing high for buy trades as a potential target and the recent swing low for sell trades.
f. Filter Signals: Keep in mind that not all signals will result in profitable trades. It's essential to filter signals with other technical analysis tools and consider the overall market context.
Remember that no trading strategy guarantees profits, and trading always carries inherent risks. It's crucial to practice proper risk management, use appropriate position sizing, and test the strategy thoroughly in a demo environment before applying it to live trading. Additionally, consider combining this strategy with other indicators or analysis methods to make more informed .
Pesquisar nos scripts por "Candlestick"

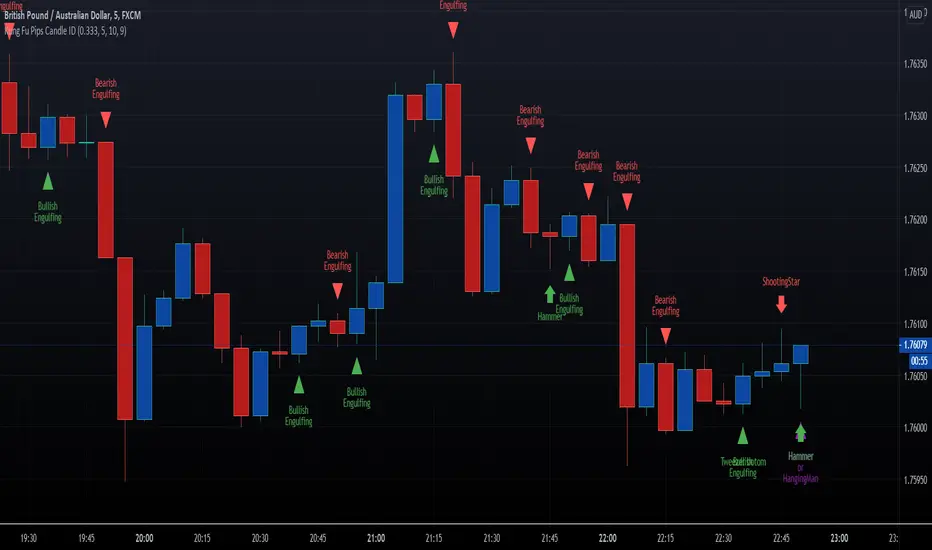
HFX Kung Fu Pips Candlestick Identifier by Trader ZThis indicator identifies the following candle stick patterns:
Bullish and Bearish Engulfing
Hammer/Hanging Man, Shooting Star
Tweezer Tops and Bottoms
Doji Star
Doji Gravestone
Made for trading Forex Binary Options but can be used in any market. When the candlestick pattern emerges the script will label the pattern. A helpful visual tool for your analysis.
Enjoy!!!!
Reversal Candlestick Pattern Detector// Name: Reversal Candlestick Pattern Detector
// Condition:
// 1-up move: last n candles, 3/5 move higher; and/or the last is the highest in past n bars
// 2-down move: last n candles, 3/5 move lower; and/or the last is the lowest in past n bars
//
// Show Bullish reversal pattern in down move; Show Bearish reversal pattern in up move;
//
//Reversal candlestick patterns:
//1. Hammer/Shooting Star,
//2. Engulfing,
//3. Morning/Evening Star,
//4. Harami, --Also Harami could be used in continuation (Rally based Rally/Drop based Drop);
//5. Piercing/Dark Cloud cover,
//6. Hook Reversal
//7. Breakaway Gap, or Gap Crosses SMA8, SMA50. This is for un-filled Gap only. low >high or high

High Performance Candlestick Patterns Colors//Candle Patterns Ranked by Performance THOMAS N. BULKOWSKI
//1. Bearish Three Line Strike +Up 67.38%
//2. Bullish Three Line Strike -Down 65.23%
//3. Bearish Three Black Crows -Down 59.83%
//4. Bearish Evening Star -Down 55.85%
//5. Bullish Upside Tasuki Gap +Up 54.44%
//6. Bullish Inverted Hammer -Down 51.73%
//7. Bullish Matching Low -Down 50.00%
//8. Bullish Abandone Baby +Up 49.73%
//9. Bearish Two Black Gapping -Down 49.64%
//10. Brearish Breakaway -Down 49.24%
//11. Bullish Morning Star +Up 49.05%
//12. Bullish Piercing Line +Up 48.37%
//13. Bullish Stick Sandwich +Up 48.20%
//14. Bearish Thrusting Line During Dowtrend +Up 48.10%
//15. Bearish Meeting Line +Up 48.07%
//Down=Yellow Bar Color and Black Text
//Up=Blue Bar Color and Blue Text
//High Performance Candlestick Patterns Colors Top 15

High Performance Candlestick Patterns//Candle Patterns Ranked by Performance THOMAS N. BULKOWSKI
//1. Bearish Three Line Strike +Up 67.38%
//2. Bullish Three Line Strike -Down 65.23%
//3. Bearish Three Black Crows -Down 59.83%
//4. Bearish Evening Star -Down 55.85%
//5. Bullish Upside Tasuki Gap +Up 54.44%
//6. Bullish Inverted Hammer -Down 51.73%
//7. Bullish Matching Low -Down 50.00%
//8. Bullish Abandone Baby +Up 49.73%
//9. Bearish Two Black Gapping -Down 49.64%
//10. Brearish Breakaway -Down 49.24%
//11. Bullish Morning Star +Up 49.05%
//12. Bullish Piercing Line +Up 48.37%
//13. Bullish Stick Sandwich +Up 48.20%
//14. Bearish Thrusting Line During Dowtrend +Up 48.10%
//15. Bearish Meeting Line +Up 48.07%
//Down=Yellow Bar Color and Black Text
//Up=Blue Bar Color and Blue Text
//High Performance Candlestick Patterns Top 15

Actually Engulfing CandlesticksThis thing attempts to find price reversals with actually engulfing candlesticks with volume spikes and RSI values as confirmation. It works well on mean reverting assets I guess.
Green dots below bars = bullish reversal
Fuchsia dots above bars = bearish reversal
Have fun!

Volume Impulse & Candlestick Patterns - FontiramisuIndicator showing volume impulse & engulfing candlestick pattern.
You can set up multiple parameter for both events.
Volume Impulse :
Volume Period : Lenght of the average volume calculated.
Volume Multiplier : Factor to compare actual volume with average volume.
Engulfing Pattern :
VS avg body : Let you chose to compare body candle to average body of the last few candles (define with parameter : lenghtSizeAvgBody ), otherwise it will be compared to the last body candle.
Engulfing Multiplier : Factor to compare and validate the pattern.

Fear and Greed Index CandlesticksThis colours the candlesticks based on my 'Fear and Greed Index'.
All calculations are explained in the code.
The index is mainly based upon the components of the popular fear and greed index website. I've annotated the components in the code for you to look at.
If you're interested, you can replace the final variable 'Total' (within the 'barcolor' function at the very end) with any of the final outputs of the subcomponents to see the results of that single part.
Red = Greed
Green = Fear
Enjoy!

Candle Patterns AlertCandlestick pattern alerts for strategies "Candle Patterns Strategy" and "Candle Patterns Strategy - 2".
In order not to receive unnecessary signals, in the "Manage alerts" option should be selected "Once per bar close".
IO_CWL IndexCandlestick body and Wick Length Index (CWL)
Shows a trend chart of candle body length and wick length.
Green -> Candle body
Red -> Candle Wick
-- Invsto

Visual Candlestick Blender (Analysis Tool), by @BlueJayBird- This is a analysis tool.
Brief Description
- It generates candlestick containers for current timeframe, using OPEN/HIGH/CLOSE/LOW data from higher time frames.
- Current version supports up to 4 CVB at the same time. Usually using only 2 is enough.
- Vertical extended divisions for 1h, 4h, 1D and 1W using background lines are included too.
* Report any bugs or feedback you have.
NOTE. At current unclosed candlestick , some weird line painting it is expected. It is not a bug, it is a Trading View feature that I haven't been able to solve yet. To solve this, setting the VCB off and then on should be enough.


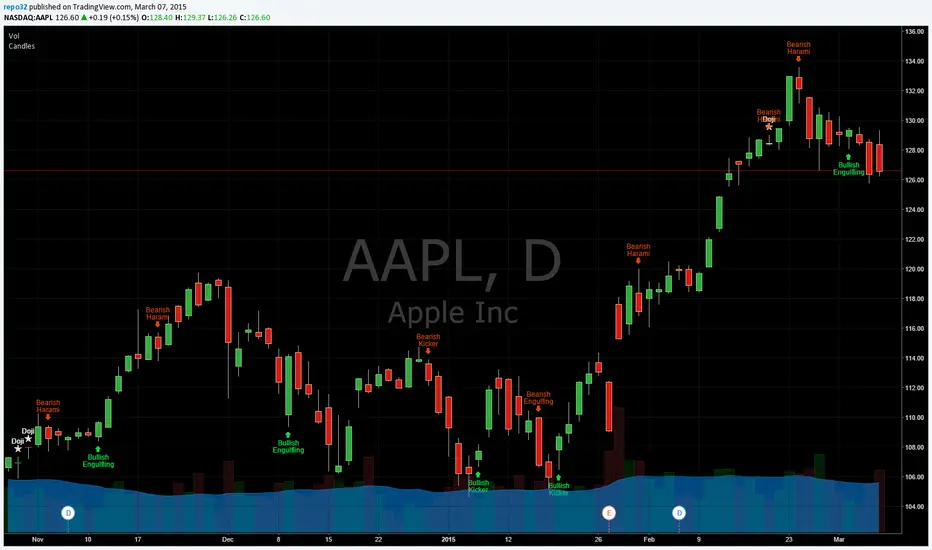
Candlesticks Patterns IdentifiedI was using another script that colored the bars to show the different candle patterns. Thanks to HPotter (www.tradingview.com). Unfortunately, I can't think that fast when looking across a screen of charts with different color bars. Fortunately, Tradingview came up with symbols and names on 2/26/15. I decided to take my favorite symbols and attach them to a name. This makes it easier to see what is going on and where your entry would be if it confirms. Works beautifully for me. Decided to share. I also added the ability to alter what shows up based upon a look back. A bullish engulfing at the top of a trend, or a bearish harami at the bottom of the trend, is nearly useless and clutters the chart. I have the default set for the open of the current bar to be higher or lower than the open from 5 bars back. You can adjust in the settings to what you like. This trend setting is on all the patterns except doji. If you want to see all the candle patterns, set it to "1".
The doji can be adjusted as well. I left some other patterns at the bottom of the script, but they are turned off. They became too much of a clutter for me. I prefer DovCaspi's pattern finder for hammers and stars: I use his due to the clean appearance.
The default script has: Doji, Bearish Harami, Bullish Harami, Bearish Engulfing, Bullish Engulfing, Piercing Line, Bullish Belt, Bullish Kicker, and Bearish Kicker. You can turn off what you don't like. The Piercing Line, Bullish Belt, and the Kickers will usually show up better in the daily charts.
If you would like the updated version, see the Related Ideas below:
Time - Bar StatusCandlestick analysis
The Indicator "Bar Status" will display the current open candle state and the last three close candles state based on the logic below.
Abbreviations.
OC = Open Candle (if in no state listed below)
FB = False Break
BO = Break Out
IN = Inside Bar
FBR = False Break Reversal
Logic:
OC = This is the current open candle yet to close. Its status will change as it progresses through time until close.
Green False Break Revers (FBR) = bar Close is higher than previous bar Close AND bar High is higher than previous bar High AND bar Low is lower than previous bar Low.
Green False Break (FB) = bar Close is lower than previous bar High AND bar High is higher than previous bar High.
Green Breakout (BO) = bar Close is higher than previous bar Close AND bar High is higher than previous bar High.
Green Inside Bar (IN) = bar High is lower than previous bar High AND bar Low is higher than previous bar Low.
Red False Break Revers (FBR) = bar Close is lower than previous bar Close AND bar Low is lower than previous bar Low AND bar High is Higher than previous bar High.
Red False Break (FB) = bar Close is higher than previous bar Low AND bar Low is lower than previous bar Low.
Red Breakout (BO) = bar Close is lower than previous bar Close AND bar Low is lower than previous bar Low.
Red Inside Bar (IN) = bar High is lower than previous bar High AND bar Low is higher than previous bar Low.
The end column is the current open candle/bar.
The second from the end column is the last closed candle/bar.
The third from the end column is the second closed candle/bar.
The forth from the end column is the third closed candle/bar.
=============================================================
Also Includes candle countdown timer, of various candles. i.e. 4 hour, 1 hour, 15min, 5 min.

FRAMA and Candlestick Patterns [CSM]FRAMA (Fractal Adaptive Moving Average) is a technical analysis indicator that adapts its smoothing period according to the market's volatility, allowing it to provide accurate signals in all market conditions. This indicator script plots the FRAMA on a chart and generates buy and sell signals based on the FRAMA and candlestick patterns. It also includes an option to filter signals based on bullish and bearish engulfing patterns.
To detect candlestick patterns, the script imports the "BankNifty_CSM" library from the creator's public library on TradingView. The FRAMA calculation is done using a loop that iterates over the last "length" number of bars, with the smoothing factor adjusted based on the "fracDim" parameter.
The buy and sell signals are generated based on the position of the current price relative to the FRAMA line. If the "engulfing" parameter is set to true, the signals are further filtered based on bullish and bearish engulfing patterns.
Overall, this script combines various technical indicators and candlestick pattern recognition to provide a complete trading strategy. However, as with any trading strategy, it should be thoroughly backtested and evaluated before using it in a live trading environment.

Regression Channel, Candles and Candlestick Patterns by MontyRegression Candles by ugurvu
Regression Channel by Tradingview
All Candlestick Patterns By Tradingview
This script was combined for a friend of mine who needed this.
This Script has regression candles by ugurvu, Regression channel and Candlestick patterns by tradingview.
The intention was to fuse these together so more information can be processed on the cost of a single indicator.

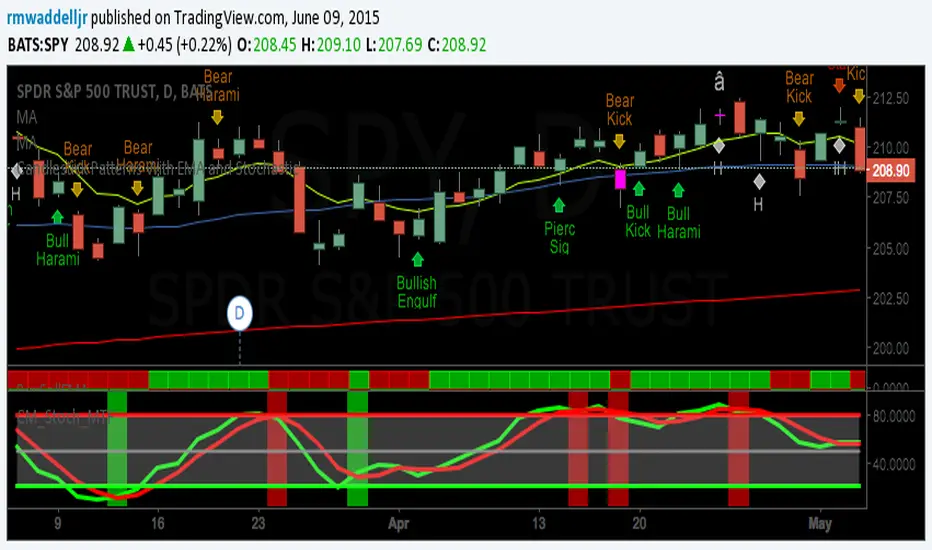
Candlestick Patterns With EMA and StochasticCandlestick patterns identified and color coded according to position above or below 8EMA(TLine).
Special thanks to repo32, DavidR, and Chris Moody for coding ideas.
Bullish candlestick buy signals have a greater probability of success when Stochastics are oversold. Bearish ones have a
greater probability of success when overbought. Stack as many factors in your favor as possible. A candlestick signal by itself is of little value unless you apply additional information with it. Regardless of systems and strategies used, make your second trade first: Know when you're going to exit. Risk management rules. Good luck and good trading.
IU Engulfing Candlestick PatternDISCRIPTION
📈 The IU Engulfing Candlestick Pattern indicator spotlights both bullish and bearish engulfing formations in real‑time. It shades each pattern with a transparent box and drops a concise label so you can catch potential reversals at a glance—no clutter, no noise, just the candles that matter.
USER INPUTS :
1. Pattern Recognition Based on = “Both” | “Wicks” | “Body” ( Default Both )
• Both → only highlights candles that satisfy **both** wick‑and‑body engulfing rules
• Wicks → checks full candle range (high‑to‑low)
• Body → checks only the real bodies (open‑to‑close)
2. Show Labels ( Default true )
If ticked then it will show the text as "Bullish Engulfing" or "Bearish Engulfing".
3. Show The Box ( Default true)
if ticked then it will show the green or red boxes.
INDICATOR LOGIC:
🔹 Bullish Engulfing (green box)
– Current bar closes higher than it opens and fully “wraps” the prior bar per your chosen rule.
🔹 Bearish Engulfing (red box)
– Current bar closes lower than it opens and fully “wraps” the prior bar per your chosen rule.
🔸 When a pattern confirms:
1. The script records the local high/low range.
2. Draws a semi‑transparent box spanning the engulfing pair.
3. Prints a compact up/down label exactly at the reaction point.
4. Fires a once‑per‑bar alert (“Bullish Engulfing” / “Bearish Engulfing”) you can route to webhooks or notifications.
WHY IT IS UNIQUE:
✨ Combines classic body‑only engulfing with an optional wick filter, letting traders demand stricter confirmation when markets are noisy.
✨ Box overlays visually segment the engulfed range—clearer than single‑bar markers.
✨ Lightweight: one input, zero repaint, and capped at 500 boxes to keep charts responsive.
✨ Ready‑to‑use alerts—no extra code needed for automation.
HOW USER CAN BENIFIT FROM IT :
- Spot early reversal zones or continuation thrusts without scanning candle by candle.
- Pair the alerts with trading bots, TradingView strategy testers, or mobile push notifications.
- Adapt the strictness (Body vs. Wicks vs. Both) to suit different assets, timeframes, or volatility regimes.
- Use the colored range boxes as dynamic support/resistance references for entries, targets, and stop‑loss placement.
📌 Tip: Test on multiple instruments and timeframes to find the sweet spot that matches your risk profile. This script is for educational purposes—always combine with sound risk management and confirm signals with broader market context.
Disclaimer :
This Video is not financial advice, it's for educational purposes only highlighting the power of coding( pine script) in TradingView, I am not a SEBI-registered advisor. Trading and investing involve risk, and you should consult with a qualified financial advisor before making any trading decisions. I do not guarantee profits or take responsibility for any losses you may incur.

Reversal Candlestick Pattern With Trend IndentifierThis script help to identified popular candlestick pattern combined with trend identifier.
Most script only focus on criteria of the pattern. Such as how much the length of the body compared to previous candle etc.
Besides criteria of the candle, this script also considered the trend into the logic.
For example bullish engulfing is a bullish reversal signal, which is only valid in a down trend.
To identified trend, I'm using RSI. Normally, RSI less than 50 is considered a down trend, and RSI greater than 50 is considered up trend. In this script, you can customize the criteria of how much RSI is up trend and down trend.
Default value RSI >= 55 is up trend, RSI <= 45 is down trend.
Your feedback and suggestion is welcome.
Supported pattern:
White Marubozu (wm)
Black Marubozu (bm)
Hammer (h)
Hanging Man (hm)
Inverted Hammer (ih)
Shooting Star (ss)
Bullish Engulfing (e)
Bearish Engulfing (e)
Tweezer Bottom (tb)
Tweezer Top (tt)
Three White Soldiers (tws)
Three Black Crows (tbc)
Morning Star (ms)
Evening Star (es)
Three Inside Up (tiu)
Three Inside Down (tid)
Reference:
babypips.com


Marubozu ScannerCandlestick Marubozu patterns scanner with multiple settings to fine-tune the scanning.
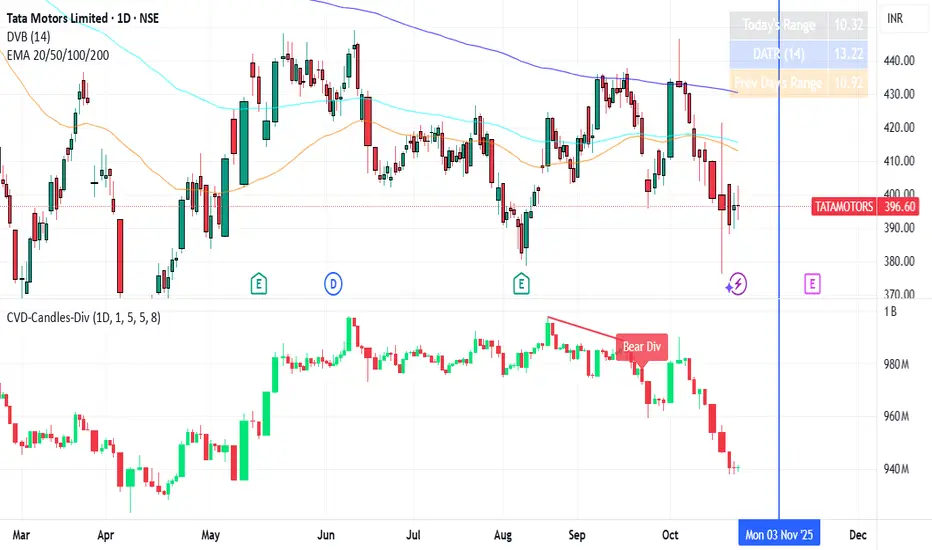
CVD Candles + Divergence (Pane) [NIRALA]This indicator provides a powerful way to analyze market dynamics by visualizing Cumulative Volume Delta (CVD) as candlesticks and automatically detecting divergences between price and order flow. It is designed to help traders spot potential trend exhaustion and reversals that may not be apparent from price action alone.
Key Concepts
Cumulative Volume Delta (CVD): CVD is a running total of the difference between buying and selling volume from market orders. A rising CVD indicates aggressive buying, while a falling CVD indicates aggressive selling. Unlike price, which can be influenced by passive limit orders, CVD shows the raw intent of aggressive market participants.
Divergence: A divergence occurs when price and CVD move in opposite directions. This signals a potential conflict between price action and the underlying order flow, often preceding a reversal.
Bearish Divergence: Price makes a new high, but CVD fails to make a new high (or makes a lower high). This suggests buying aggression is weakening despite the higher price, and a reversal to the downside may be imminent.
Bullish Divergence: Price makes a new low, but CVD fails to make a new low (or makes a higher low). This suggests selling pressure is drying up, and a reversal to the upside may be coming.
Features
CVD as Candlesticks: Plots CVD in a familiar OHLC candlestick format in a separate pane, providing a more intuitive view of order flow momentum and volatility compared to a simple line.
Automatic Divergence Detection: The script automatically identifies classic bullish and bearish divergences between price pivots and CVD pivots, drawing lines on both the main price chart and the indicator pane to clearly highlight them.
Multi-Timeframe Analysis: Calculates CVD from a user-defined lower timeframe, offering a more granular and precise view of the order flow that builds up a single candle on your chart.
Customizable Pivot Lookbacks: Allows you to adjust the sensitivity of the pivot detection for finding both short-term and long-term divergences.
Alerts: Includes built-in alerts that can notify you when a new bullish or bearish divergence is confirmed.
How to Use
Look for High-Probability Setups: This indicator is most powerful when its signals appear at key areas of support or resistance. A divergence at a major price level is a much stronger signal than one in the middle of a range.
Confirm with Price Action: Do not trade on a divergence signal alone. Wait for a confirmation candle (e.g., a bearish engulfing candle after a bearish divergence, or a bullish hammer after a bullish divergence) before considering an entry.
Combine with Your Strategy: Use this indicator as a confirmation tool to enhance your existing trading strategy. For example, if your primary strategy gives a sell signal and this indicator simultaneously prints a bearish divergence, it significantly increases the probability of the trade.
This tool is designed for discretionary traders looking to add a layer of order flow analysis to their decision-making process.
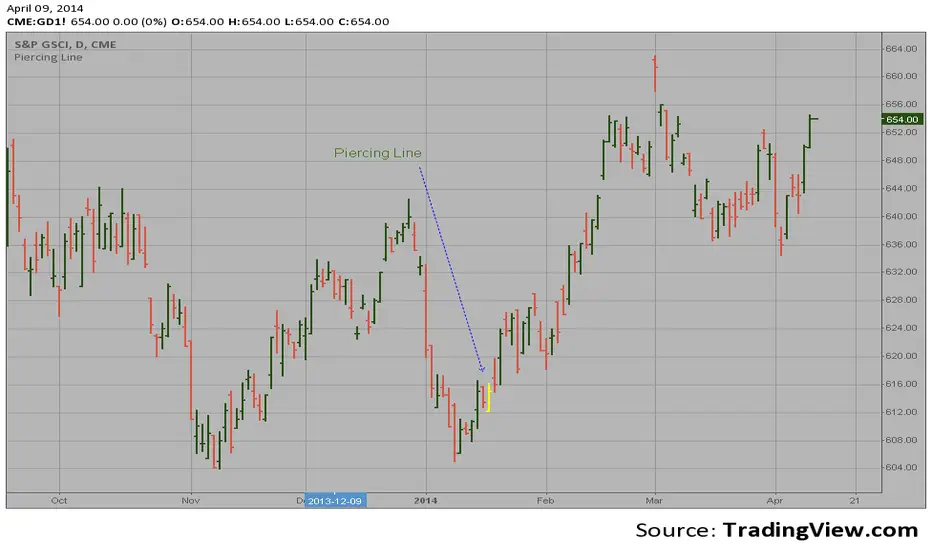
Piercing Line automatic finding scriptHi
Let me introduce my Piercing Line automatic finding script.
This is a bullish reversal pattern formed by two candlesticks. Following a downtrend,
an up candlestick with a long real body is followed by a lower open on the next
candlestick. This session finishes as an up candlestick and closes above the midpoint
of the prior candlestick's real body. It is the reverse of the Dark Cloud.