Renko Magic - StrategyThis strategy uses the Renko Candle's trend change and follows it with a trend. Applied 10 ticks of slippage and Bitmex's market order commission. Last Updated June 7th 2019. Estratégia Pine Script®por AlphaGoku5583
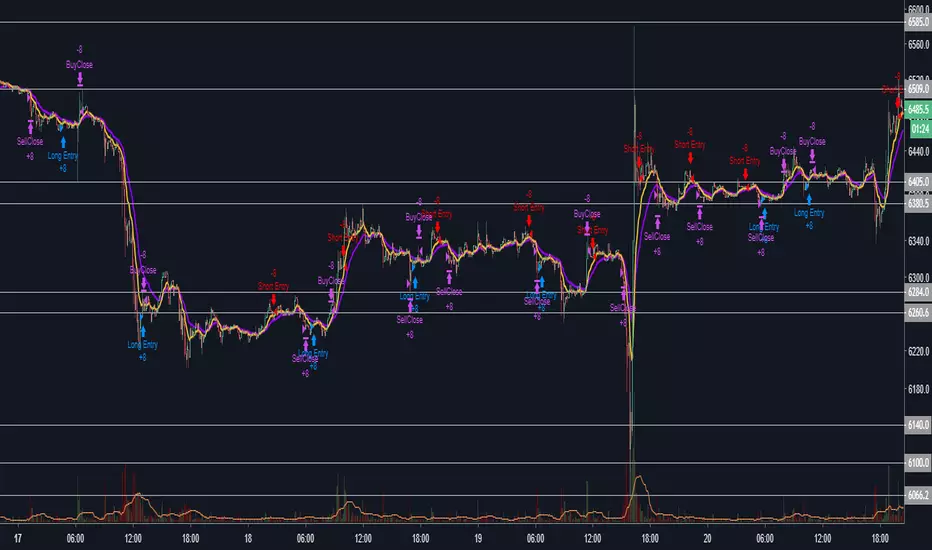
RSI-ATR Divine Strategy (Backtesting)Live, non-repainting strategy using ATR and RSI mixed together to multiple types of long and short positions. - Features - Live entry direction with trade warnings and alerts Live trade building buy and sell stops (for buy/sell stop limits) Entry location icons as well as pyramid entries (to add to existing position) 2 separate targets based on the ATR setting and entry location 1 scalp target based on the ATR setting and entry location 2 separate trailing stops, 1 for "absolute stop" and 1 for "scalp trades" Alert conditions for every update and condition change of the strategy (Provided by indicator study ) 4 pre-built color themes, including candlestick coloring This strategy is best used with my RSI Shaded Indicator using the identical RSI settings. The linked script is identical and used solely for alerts, because Trading View still after 3 years of requesting does not provide the ability to use alert conditions inside a strategy script, only an indicator script. This strategy should be used to backtest your settings. The approach to this strategy uses several parallel trades of different types. In order to generate multiple trade types the "pyramid trades" setting of the strategy (second tab of the settings that lets you adjust the number of pyramid contracts) should be used. - Trade Types - Swing: This trade is entered on the solid arrows after the RSI has become oversold or overbought. It is key that all trades wait for some degree of pullback before entering, even after the trend flips between positive and negative. This trade is held until stopped out or an opposite trade is triggered that reverses the position. Target: These trades are entered at both the initial swing trade, or any subsequent pyramid/greedy trades that present themselves along the way while the trend remains in the same direction. The difference between these trades and the swing trade is that they have targets calculated as: Target = +/- * ATR. Until the target price is reached it does not change. When exceeded the next target trade will have a new target price. Scalp: These trades have a limit buy/sell entry and a target. The target is very similar to the ATR Multiplier calculation for Target trades, but uses the instead. Turning on/off the different trade types (strategy only) is simple done by decreasing the number of contracts used for that trade type to zero. When the quantity is set to zero, that trade is not considered. - Session - The session filter is used to narrow trade executions by only allowing trades that are inside the session boundaries. This can be used to isolate the London or New York session for example. The default is 24 x 7 which filters no trades (Trading View has a bug when resetting this, so simply reset the indicator to get it back to 24x7). All feature requests or bug reports are welcome either by direct messaging or comments on this page or the linked indicator page. Please PM for access. Cheers.Estratégia Pine Script®por mortdiggiddyAtualizado 1212158
Contender 3PAF is an emulation of "Point And Figure" strategy, recreated within a regular line or candlestick chart, used for trend following & breakout signals. This indicator is inspired by & named after Athena, who's Palladion figurine protected Troy.Estratégia Pine Script®por epicau0
MBY_Trade1HBITFINEX:ETHUSD Hi. This is MBY_LAB. This indicator is a paid indicator. The color of the moving average reflects MACD. The signal line in the middle of the screen is the Ichimoku baseline. And you can also trade through the Bollinger Band at the same time, and you can turn it off when you need it. You can see the Fibonacci resistance line and supporting line at a glance. We have set the background color to distinguish between bearish and burlish. Please use strategy test in 1 hour time frame. Please give me a message.Estratégia Pine Script®por Yonggg92Atualizado 8836
Wyckoff Trend Tracking Trade SystemWyckoff Trend Tracking Trading System威科夫趋势跟踪交易指标工具为非结构化的市场增添了结构,它有一套明确一致的交易规则,让您专注于具有最高回报和最低风险的交易机会,无论您是刚刚开始从事交易还是经验丰富的交易员,它对您来说绝对是一种竞争优势。Estratégia Pine Script®por AItraders7797
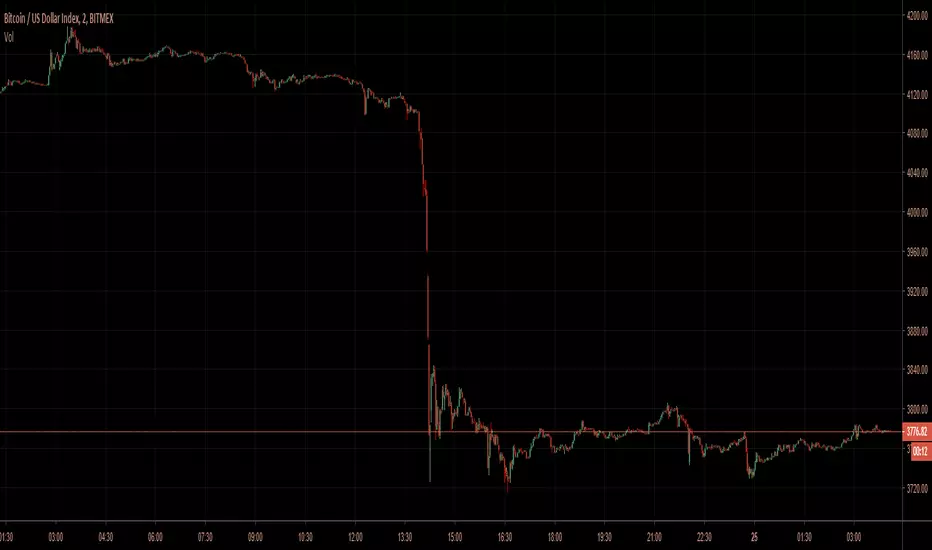
Failure Swing Strategy (stop hunting) V1 (Made on XBT/USD 4h Bitmex) This strategy is a first attempt to countertrade the false break of a key support/resistance. If a candle breaks the level, but it comes back before close, it will trigger an order. The Stop Loss is in %, the Take Profit is near the EMA. There is a "volatility filter" to block orders when the price is near the EMA and a coefficient to adjust a little the Stop Loss and Take Profit according to the chart condition.Estratégia Pine Script®por Heavy9155418
Matt's MACD Algo v1This script is meant to be viewed with the Heiken Ashi candlestick chart. I use it for pretty much everything. It has a lot of extra stuff just for visual reference, but the trades are based on the MACD (3,5,9) indicator. I found that speeding up the intervals of the MACD makes for a much more reactive chart. In this heavily volatile market, it has been performing well. If the market is not very volatile, it tends to have too many noisy signals. Any help or criticism would be greatly appreciated.Estratégia Pine Script®por bodeen883395
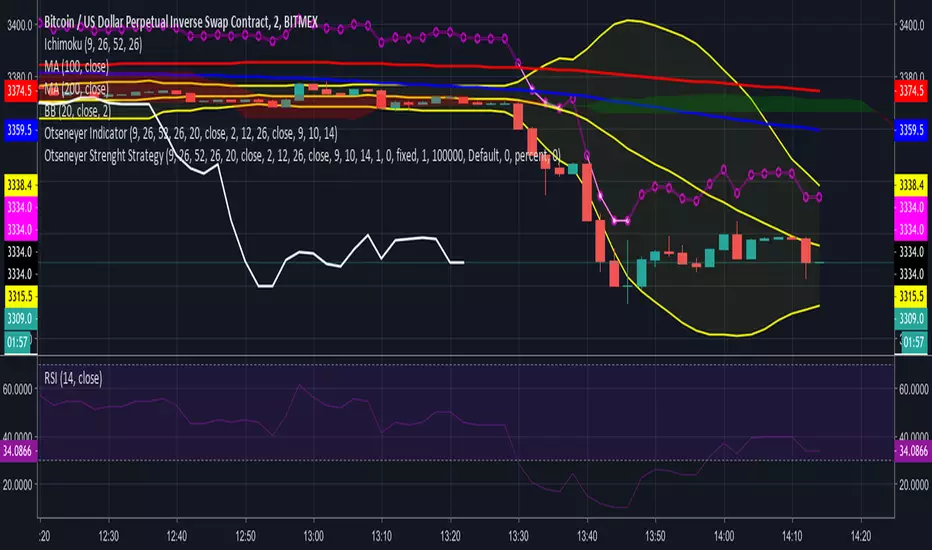
Otseneyer Strenght StrategyThis strategy shows if the market is strong or weak, marking short or long respectively, however this does not represent a direct entry, only a strength or weakness, which applied with some other parameters (candlestick patterns, resistances, etc) can throw us a very good entry, especially in the appropriate temporality, where there is a balance between volatility and the persistence of micro-tendencies.Estratégia Pine Script®por RodrigoMF18
Dane - MA StrategyThis strategy has been developed as a development service. It is published for customer acceptance and verification. As such, I am unable to provide access to anyone other than the paying customer. Sorry about that. For those interested in development services, please check out the backtest-rookies (.com) website. MA Strategy A Moving average crossover strategy using Heikin-ashi candles for confirmation. The strategy makes trading decisions based on Heikin-ashi data but trades on real candlestick charts to avoid incorrect backtest results. The strategy includes optional plotting of HK candles on an overlay to help with strategy verification. Estratégia Pine Script®por BacktestRookies1117
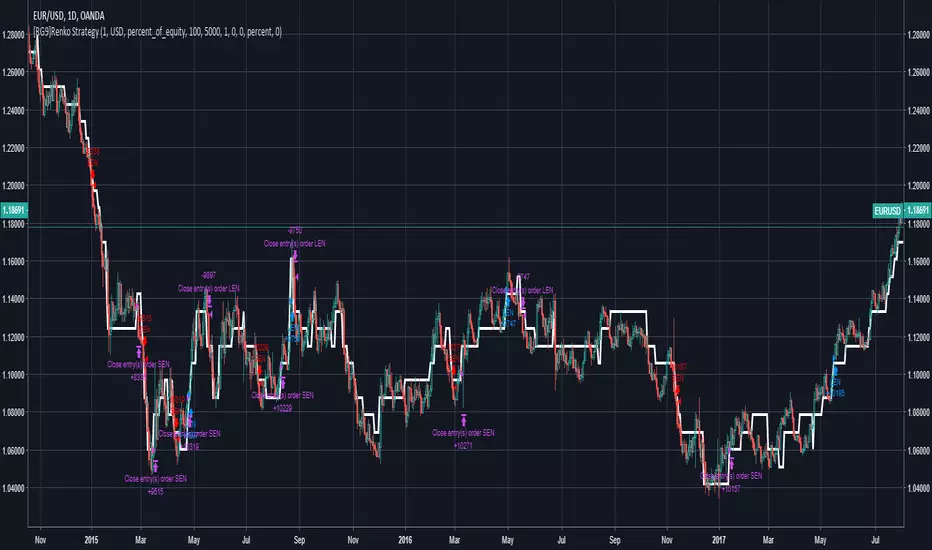
[RG9]Renko StrategyUses the ATR based Renko action in the script to find buys, sells, and exitsEstratégia Pine Script®por robger983369
Bitmex Bot 5m candlesThis script was made for our customers to test the strategies of our Bitmex Bot. I'm not going to give you permission to use the Script, only if you become our client. Telegram @rmgslashEstratégia Pine Script®por rmgslash338
Coinsolos Wonderfull Strategy 1h ChartSet your chart 1h resolution and follow the signs. 94% profitable trade for 275 trades between 01.01.2018 and 11.09.2018Estratégia Pine Script®por CoinsolosAtualizado 222229
LevelTradeV2. Indicator give to us min. and max. levels This indicator is designed to work on short-term and long-term periods. It provides levels of resistance and support for the two options. 1) purple levels - minimum and maximum price for the shadows of candles. 2) red and green levels - over the body of a candle. added a moving average and a profit calculator fully customizable.Estratégia Pine Script®por DenisBogrov5
Kozlod - Heikin-Ashi Bar Color Change StrategyYou can use this script to backtest Heikin-Ashi bar color change strategy. You have to apply this script to usual candles and not Heikin-Ashi!!! Background color indicates HA bar color. On change you'll see green/red arrows and alert will be fired. Also you can find in the code calculations of all HA OHLC values.Estratégia Pine Script®por QuantNomadAtualizado 99912
Solstice (Strategy)Solstice: This script readjusts according to the timeframe and candlestick pattern. Its optimum timeframe is above 2hr . (But can also be used on any timeframe or cancel stick pattern) I decided to present the HA pattern, as it gives greater clarity to how to bot trades. Bitmex is the best platform to trade on, as with using half limit orders, you can bring your fees down to +-0.05%. I used Gold -0.88% as the example, to show how you can trade this strategy manually. Syntax can be supplied. Contact me for a (Trial Period) Access Happy Money Printing Estratégia Pine Script®por jackthedavies777720
quit your bullshit! Heikin-Ashi Backtest with Real Candle ValuesMade in a few minutes to debunk all the bullshit going around tradingview and everywhere about "heikin-ashi" being a holy grail trend indicator. Do not be deceived. Heikin-Ashi is a beautiful way to remove much of the noise in markets, and is light on the eyes. (nice and smooth!) I personally use heikin-ashi as a way to remove a lot of the clutter in the markets, allowing me to trade with less emotion. While heikin-ashi is a great way to visualize trends, it is NOT a good trend indicator because its displayed values do not align with actual trading values. Therefore, entry and exit points for many of the ideas published about heikin-ashi for trade are inaccurate. ::: When Heikin-Ashi changes colour for x candles, a new trade is created on the open of the following real candle. In practice, Heikin-Ashi is much closer to break even. As tested, Heikin-Ashi trend trading works better on pairs that have clearer definitions of trends and are less often in consolidation. (ex. USDJPY) Usage: Switch to normal candlestick chart. Features: Change the period for new trades. (For example: x amount of red candles after a green candle to signify short trade)Estratégia Pine Script®por andrewqiu97741717938
Pearl (Strategy)Pearl: This script readjusts according to the timeframe and candlestick pattern. Its optimum is the: 1min Renko (Traditional,4) I decided to present the HA pattern, as it gives greater clarity to how to bot trades. Bitmex is the best platform to trade on, as with using half limit orders, you can bring your fees down to +-0.05%. Syntax can be supplied. Results are of 6 days backtesting. Happy Money Printing Regards JackEstratégia Pine Script®por jackthedavies77449
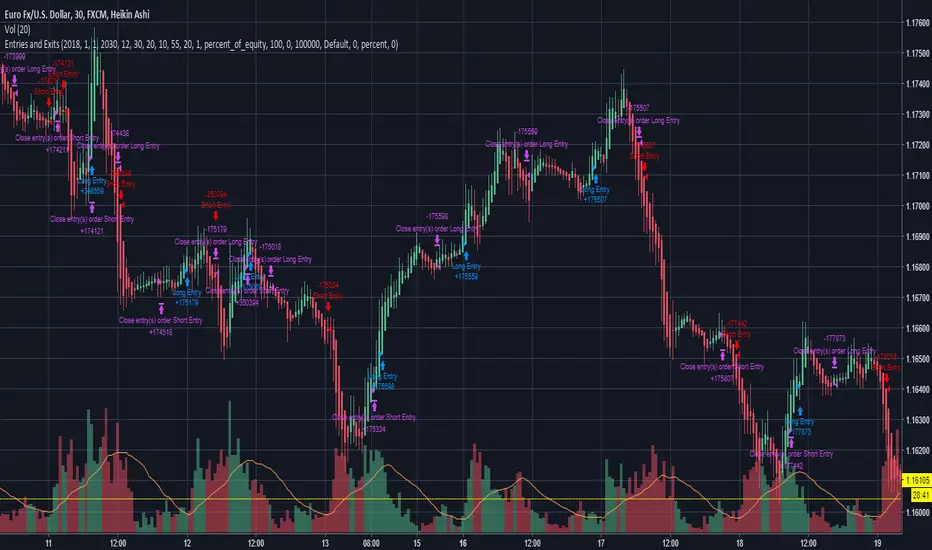
Entries and Exits (plus alerts)Simple breakout strategy that can be used for most equities, FOREX and cryptocurrencies. Inputs can be customized to suit your trading style and can be applied to any time frame chart. Comes with matching alert indicator which is useful for autotrading or just simply never missing a trade for manual trading. Please message me for access. Happy trading!Estratégia Pine Script®por Rogue_Profit_TraderAtualizado 383870
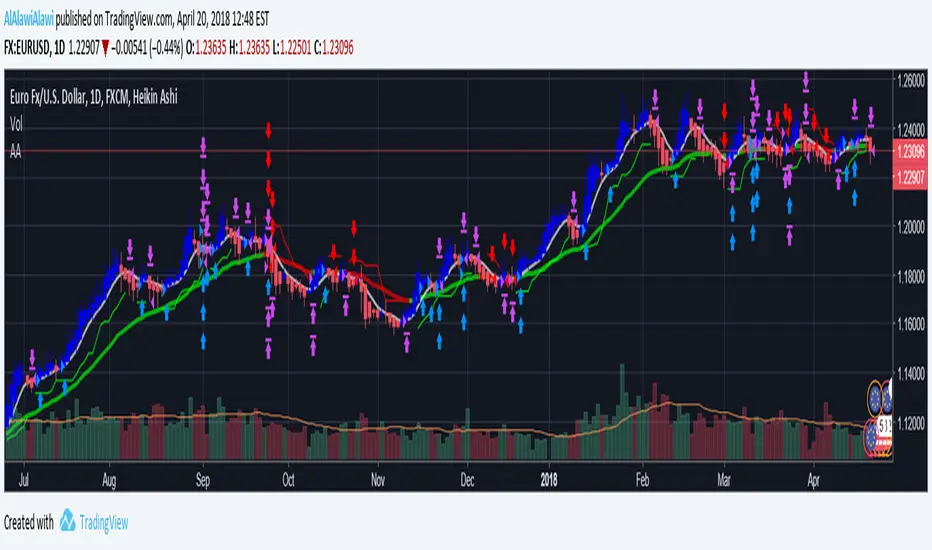
AlAlawi StrategyHello Experts / Trolls; I had written this strategy for a while and although I know how to color my charts, I wish for some expert advice or just some trolls to bring light to the codes weakness area's. Period = isdwm?timestamp(2012, 01, 01, 00, 00):isintraday?timestamp(2018, 04, 01, 00, 00):timestamp(2018, 04, 01, 00, 00) The above line of code for example lets my 4H and 1H charts suffer from a small size of testing and I need to change the dates manually, any idea to let a more dynamic approach and accomodate a 1 minute to 4h charts solution without having to play with the dates manually every time. I also see a huge difference in results when applying this script on a Heikin-Ashi vs Candlestick chart! So when pyramiding (upto 15) is applied on this strategy, the numbers starts boosting like crazy too! This is a rough code for now, let me know where to work on the code or just like and share your opinion on this.Estratégia Pine Script®por AlAlawiAlawiAtualizado 2230
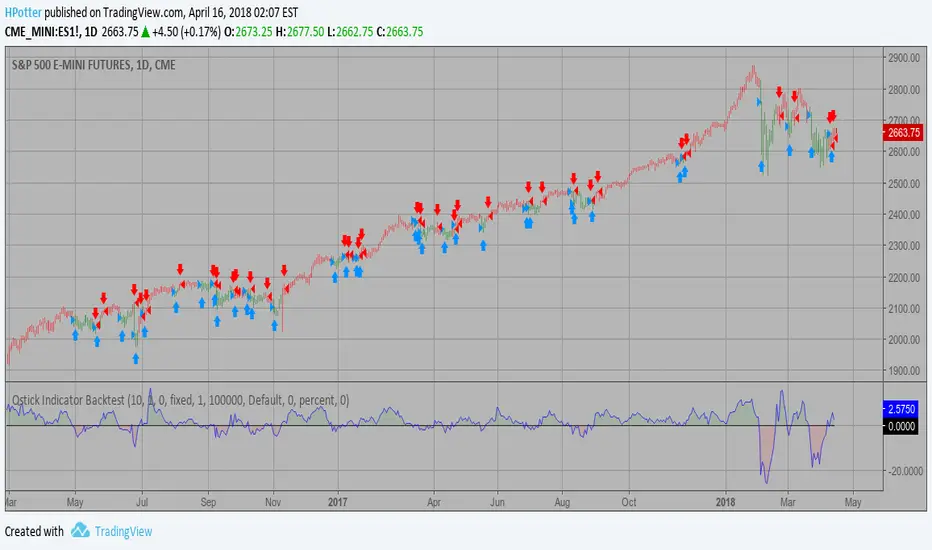
Qstick Indicator Backtest A technical indicator developed by Tushar Chande to numerically identify trends in candlestick charting. It is calculated by taking an 'n' period moving average of the difference between the open and closing prices. A Qstick value greater than zero means that the majority of the last 'n' days have been up, indicating that buying pressure has been increasing. Transaction signals come from when the Qstick indicator crosses through the zero line. Crossing above zero is used as the entry signal because it is indicating that buying pressure is increasing, while sell signals come from the indicator crossing down through zero. In addition, an 'n' period moving average of the Qstick values can be drawn to act as a signal line. Transaction signals are then generated when the Qstick value crosses through the trigger line. You can change long to short in the Input Settings WARNING: - For purpose educate only - This script to change bars colors.Estratégia Pine Script®por HPotter78
Cypher Core Trading Suite Reband lol - RSI overlay indicators (diamond shapes) - Most commonly used MA types( i.e. SMA, EMA, WMA, VWMA, ZEMA ) - Bands - Price Action Indicator (color coordinated) color code: yellow --- inside bars (breakout) blue --- outside bars (breakout) green --- up pin bars (reversal) red --- down pin bars (reversal) fuchsia --- down shaved bars (selling pressure, selling likely to continue) aqua --- up shaved bars (buying pressure, buying likely to continue) - Reversal candlestick patterns (only a few for now) - Two strategies for determining buy/sell signals 1. buy/sell signals determined by EMAs crossover (better for position or swing trades) 2. buy/sell signals determined by MAs crossover (better for scalping)Estratégia Pine Script®por jim380Atualizado 256256273