RSI Crossover AlertRSI Crossover Alert Indicator - User Guide
The RSI Crossover Alert Indicator is a comprehensive technical analysis tool that detects multiple types of RSI crossovers and generates real-time alerts. It combines traditional RSI analysis with signal lines, divergence detection, and multi-level crossing alerts.
1. Multiple Crossover Detection
- RSI/Signal Line Cross: Signals a primary trend change.
- RSI/Second Signal Cross: Confirmation signals for stronger trends.
- Level Crossings: Crosses of Overbought 70, Oversold 30, and Midline 50.
- Divergence Detection: Hidden and regular divergences for reversal signals.
2. Alert Types
- Alert: RSI > Signal
Description: Bullish momentum is building.
Signal: Consider long positions.
- Alert: RSI < Signal
Description: Bearish momentum is building.
Signal: Consider short positions.
- Alert: RSI > 70
Description: Entering the overbought zone.
Signal: Prepare for a potential reversal.
- Alert: RSI < 30
Description: Entering the oversold zone.
Signal: Watch for a bounce opportunity.
- Alert: RSI crosses 50
Description: A shift in momentum.
Signal: Trend confirmation.
3. Visual Components
- Lines: RSI blue, Signal orange, Second Signal purple
- Histogram: Visualizes momentum by showing the difference between RSI and the Signal line.
- Background Zones: Red overbought, Green oversold
- Markers: Up/down triangles to indicate crossovers.
- Info Table: Real-time RSI values and status.
Strategy 1: Classic Crossover
- Entry Long: RSI crosses above the Signal Line AND RSI is below 50.
- Entry Short: RSI crosses below the Signal Line AND RSI is above 50.
- Take Profit: On the opposite signal.
- Stop Loss: At the recent swing high/low.
Strategy 2: Extreme Zone Reversal
- Entry Long: RSI is below 30 and crosses above the Signal Line.
- Entry Short: RSI is above 70 and crosses below the Signal Line.
- Risk Management: Higher win rate but fewer signals. Use a minimum 2:1 risk-reward ratio.
Strategy 3: Divergence Trading
- Setup: Enable divergence alerts and look for price/RSI divergence. Wait for an RSI crossover for confirmation.
- Entry: Enter on the crossover after the divergence appears. Place the stop loss beyond the starting point of the divergence.
Strategy 4: Multi-Timeframe Confirmation
1. Check the higher timeframe e.g. Daily to identify the main trend.
2. Use the current timeframe e.g. 4H/1H for your entry.
3. Only enter in the direction of the main trend.
4. Use the RSI crossover as the entry trigger.
Optimal Settings by Market
- Forex Major Pairs
RSI Length: 14, Signal Length: 9, Overbought/Oversold: 70/30
- Crypto High Volatility
RSI Length: 10-12, Signal Length: 6-8, Overbought/Oversold: 75/25
- Stocks Trending
RSI Length: 14-21, Signal Length: 9-12, Overbought/Oversold: 70/30
- Commodities
RSI Length: 14, Signal Length: 9, Overbought/Oversold: 80/20
Risk Management Rules
1. Position Sizing: Never risk more than 1-2% on a single trade. Reduce size in ranging markets.
2. Stop Loss Placement: Place stops beyond the recent swing high/low for crossovers. Using an ATR-based stop is also effective.
3. Profit Taking: Take partial profits at a 1:1 risk-reward ratio. Switch to a trailing stop after reaching 2:1.
1. Filtering Signals
- Combine with volume indicators.
- Confirm the trend on a higher timeframe.
- Wait for candlestick pattern confirmation.
2. Avoid Common Mistakes
- Don't trade every single crossover.
- Avoid taking signals against a strong trend.
- Do not ignore risk management.
3. Market Conditions
- Trending Market: Focus on midline 50 crosses.
- Ranging Market: Look for reversals from overbought/oversold levels.
- Volatile Market: Widen the overbought/oversold levels.
- If you get too many false signals:
Increase the signal line period, add other confirmation indicators, or use a higher timeframe.
- If you are missing major moves:
Decrease the RSI length, shorten the signal line period, or check your alert settings.
Recommended Combinations
1. RSI + MACD: For dual momentum confirmation.
2. RSI + Bollinger Bands: For volatility-adjusted signals.
3. RSI + Volume: To confirm the strength of a signal.
4. RSI + Moving Averages: To use as a trend filter.
This indicator provides a comprehensive RSI analysis. Success depends on proper configuration, risk management, and combining signals with the overall market context. Start with the default settings, then optimize based on your trading style and market conditions.
Pesquisar nos scripts por "Candlestick"

Rolling Volatility BandsMake sure to view it from the 1D candlestick chart.
The Rolling Volatility Bands indicator provides a statistically-driven approach to visualizing expected daily price movements using true volatility calculations employed by professional options traders. Unlike traditional Bollinger Bands which use price standard deviation around a moving average, this indicator calculates actual daily volatility from log returns over customizable rolling periods (20-day and 60-day), then annualizes the volatility using the standard √252 formula before projecting forward-looking probability bands. The 1 Standard Deviation bands represent a ~68% probability zone where price is expected to trade the following day, while the 2 Standard Deviation bands capture ~95% of expected movements. This methodology mirrors how major exchanges calculate expected moves for earnings and FOMC events, making it invaluable for options strategies like iron condors during low-volatility periods (narrow bands) or directional plays when volatility expands. The indicator works on any timeframe while always utilizing daily candle data via security() calls, ensuring consistent volatility calculations regardless of your chart resolution, and includes real-time annualized volatility percentages plus daily expected range statistics for comprehensive market analysis.

Spice • Micro Suite (T/r & B/r)What it is
A single Pine v5 indicator that stacks:
EMA ribbon + a “special” EMA (11 vs 34) line that flips color on trend.
MTF-RSI “pressure” check with simple up/down arrows.
Bollinger-Band re-entry system with Top/Bottom triggers (T/B) and confirmations (r) in the next N bars.
Classic candlestick add-ons: 3-Line Strike and Leledc exhaustion dots.
Your Micro Dots engine (ATR-based regime + Variable Moving Average filter) + an optional VMA trend line.
Alerts for all the above.
Key signals (what prints on the chart)
EMAs (20/50/100/200): plotted faintly; EMA-34 is drawn and colored by the 11>34 trend.
RSI arrows
Checks RSI(6) on the current TF and (optionally) 5m/15m/30m/1h/4h/1D.
Down arrow: current RSI > 70 and the selected higher TF RSIs are also > 70 (pressure cluster just cooled; barssince(redZone)<2).
Up arrow: current RSI < 30 and selected higher TFs also < 30 (barssince(greenZone)<2).
Bollinger Reversals (your update)
T (Top trigger): first close back inside the upper BB (crossunder(close, upper)).
B (Bottom trigger): first close back inside the lower BB (crossover(close, lower)).
r (Confirm): within the next confirmBars bars (input), price also
closes below the T-bar’s low → top r above bar
closes above the B-bar’s high → bottom r below bar
Bar tinting
Only the T/B trigger bars are tinted (yellow/orange). Everything else stays your normal candle colors (unless you add the optional “trend candles” block I gave you).
3-Line Strike
Prints a small green/red circle when the 3-line strike pattern appears (bull/bear).
Leledc Exhaustion
Calculates a running buy/sell index; prints a small ∘ at major highs/lows when exhaustion conditions hit (major==-1 high, major==1 low).
Micro Dots (your second script, merged)
ATR “micro supertrend” defines regime (up/down).
A fast Variable Moving Average + a simple MA(18) filter.
Green dot below bar when: VMA < price, price > MA(18), regime up, and VMA not pointing down.
Red dot above bar for the bearish mirror.
Separate VMA trend line (length = Fast/Med/Slow) that colors green/red/orange by slope.
Inputs you’ll care about
Top/Bot Reversal → confirmBars (how many bars you allow to confirm the T/B trigger).
RSI Timeframes → toggle which HTFs must agree with the OB/OS condition.
EMAs → show/hide and lengths.
BB → show/hide basis/bands (used for T/B even if hidden).
Micro → show dots, show VMA line, choose intensity (Fast/Med/Slow).
Alerts
Prebuilt alerts for: RSI Up/Down, T/B triggers, T/B confirmations, 3-Line Strike bull/bear, Leledc highs/lows, EMA crosses (20/50/100/200), the special 11/34 trend change, Micro Dots, and VMA price cross. (Alert messages are const strings so they compile cleanly.)
How to read clusters (quick playbook)
Reversal short: see T on/near upper band → get an r within your window → bonus confidence if an RSI down arrow or Leledc ∘ high shows up around the same time.
Reversal long: mirror with B then r, plus RSI up arrow / Leledc ∘ low.
Continuation: ignore lone T/B if Micro Dot stays green (or red) and EMA-11 > EMA-34 remains true.
Why your candles look “normal”
By design, the script only colors bars on T or B trigger bars. If you want always-on trend candles, use the small block I gave you to color by EMA(20/50) (or any rule you like) and let T/B override on trigger bars.

SD Bands Filtered Signals### SD Bands Filtered Signals: Reversion & Volatility Scanner
**Core Description:**
The SD Bands Filtered Signals is a tool developed to help traders identify more accurate buy and sell signals in sideways markets, or during periods of low price movement. It utilizes the principles of Standard Deviation (SD) and a Moving Average (MA), with a unique 'signal filtering' system added to reduce unnecessary noise.
**Key Features:**
* **SD Bands:** Creates upper and lower bands to define price volatility zones, providing a clear overview of market conditions.
* **Intelligent Reversal Signals:** Generates specially filtered Buy/Sell signals for a 'Reversion to the Mean' strategy. These signals appear only when the market has low volatility and the price touches the SD Bands.
* **Advanced Signal Filtering System:** Uses a **`Cooldown Bars`** variable to set a rest period between signals. This prevents repetitive arrows in the same zone, helping you find the best signal at the most suitable point.
* **Fully Customizable:** You can adjust the **`Length`**, **`Multiplier`**, **`Sideways Threshold`**, and **`Cooldown Bars`** to fit your trading style and asset of choice.
**How to Use:**
* **Buy Signal (Green Arrow Up):** Look for this signal when the market is sideways and the price moves down to touch the lower band (SD Low).
* **Sell Signal (Red Arrow Down):** Look for this signal when the market is sideways and the price moves up to touch the upper band (SD High).
* **Customization:** You can adjust the **`Cooldown Bars`** value to control the number of arrows. If you want more accurate but fewer signals, increase this value.
**Disclaimer:**
* This indicator is an **analytical tool only** and is not a 100% guarantee of profit.
* It should be used in conjunction with other forms of analysis, such as candlestick patterns, trading volume, and proper risk management.
ไทย
ชื่ออินดิเคเตอร์ "SD Bands Filtered Signals: Reversion & Volatility Scanner"
คำอธิบายหลัก:
อินดิเคเตอร์ SD Bands Filtered Signals เป็นเครื่องมือที่ถูกพัฒนาขึ้นเพื่อช่วยให้นักเทรดสามารถระบุสัญญาณซื้อ (Buy) และขาย (Sell) ที่แม่นยำขึ้นในตลาดแบบ Sideways หรือช่วงที่ราคาเคลื่อนที่ในกรอบแคบๆ โดยใช้หลักการของ Standard Deviation (SD) และ Moving Average (MA) และเพิ่มระบบ 'กรองสัญญาณ' ที่เป็นเอกลักษณ์เพื่อลดสัญญาณรบกวน (Noise) ที่ไม่จำเป็นออกไป
คุณสมบัติเด่น:
* SD Bands: สร้างเส้นขอบบนและล่างเพื่อระบุโซนความผันผวนของราคา ทำให้เห็นภาพรวมของตลาดได้ง่าย
* สัญญาณ Reversal อัจฉริยะ: สร้างสัญญาณ Buy/Sell ที่ถูกคัดกรองมาเป็นพิเศษสำหรับกลยุทธ์การกลับตัว (Reversion to the Mean) โดยจะปรากฏเฉพาะเมื่อตลาดมีความผันผวนต่ำและราคาแตะขอบของ SD Bands
* ระบบกรองสัญญาณขั้นสูง: ใช้ตัวแปร Cooldown Bars เพื่อกำหนดระยะเวลาพักสัญญาณ ทำให้ไม่เกิดลูกศรซ้ำๆ ในโซนเดียวกัน และช่วยให้คุณได้สัญญาณที่ดีที่สุดในจุดที่เหมาะสมที่สุด
* ปรับแต่งได้เต็มที่: คุณสามารถปรับค่า Length, Multiplier, Sideways Threshold และ Cooldown Bars เพื่อให้เข้ากับสไตล์การเทรดและคู่สินทรัพย์ที่คุณสนใจ
วิธีการใช้งาน:
* สัญญาณ Buy (ลูกศรสีเขียวขึ้น): มองหาสัญญาณนี้เมื่อตลาดอยู่ในช่วง Sideways และราคาวิ่งลงมาแตะเส้นขอบล่าง (SD Low)
* สัญญาณ Sell (ลูกศรสีแดงลง): มองหาสัญญาณนี้เมื่อตลาดอยู่ในช่วง Sideways และราคาวิ่งขึ้นไปแตะเส้นขอบบน (SD High)
* การปรับแต่ง: คุณสามารถปรับค่า Cooldown Bars เพื่อให้ได้จำนวนลูกศรที่ต้องการ หากต้องการสัญญาณที่แม่นยำขึ้นแต่จำนวนน้อยลง ให้เพิ่มค่านี้ให้สูงขึ้น
ข้อควรระวัง:
* อินดิเคเตอร์นี้เป็นเพียงเครื่องมือวิเคราะห์ ไม่ใช่สัญญาณที่การันตีผลกำไร 100%
* ควรใช้ประกอบกับการวิเคราะห์อื่นๆ เช่น รูปแบบแท่งเทียน, ปริมาณการซื้อขาย (Volume) และการจัดการความเสี่ยงที่เหมาะสม

Volume Pressure Analysis - Live DataVolume Pressure Gauge and Volume Percentage Indicator – Pine Script Guide
This indicator provides a simplified, real-time visualization of both volume pressure (buy vs. sell activity) and today’s trading volume in comparison to historical averages. It is designed to help traders assess whether buyers or sellers dominate the current session and whether today’s volume is significant relative to recent behaviour.
________________________________________
Key Functional Segments
1. Inputs and Configuration
Users can configure the length of the Simple Moving Average (SMA) used to calculate average volume, set the position of the gauge table on the chart, and toggle the visibility of the volume pressure display. This allows flexibility in integrating the tool with various trading styles and chart layouts.
2. Volume Data Calculations
The indicator calculates three key volume metrics:
• volToday: The current day’s volume.
• volAvg: The average volume over the user-defined SMA period (default is 20 bars).
• volPct: The current volume as a percentage of the average.
This enables traders to quickly recognize whether current trading activity is above or below normal, which can be a precursor to potential trend strength or weakness.
3. Volume Pressure Calculation
The script estimates buying and selling pressure based on price movement and volume. It distributes volume into upward (buy) and downward (sell) segments and expresses them as percentages of the total volume. This gives an immediate sense of whether bulls or bears are more active in the current session.
4. Visual Representation (Progress Bars)
The indicator renders a simplified visual gauge using horizontal bar segments (pseudo-bars) to reflect the proportion of buy and sell pressure. The length of each bar correlates with the strength of pressure from buyers or sellers, helping users assess dominance without analyzing candlestick behavior in depth.
5. Table Display
A compact table is drawn on the chart showing:
• Buy pressure percentage and corresponding bar.
• Sell pressure percentage and corresponding bar.
• Volume percentage compared to the recent average.
This format makes it easy to evaluate volume dynamics at a glance, without cluttering the price chart or relying on separate overlays.
________________________________________
How Traders Benefit from This Indicator
• Momentum Shift Detection: Early signs of trend reversal can be observed when volume pressure flips direction.
• Breakout Validation: High volume combined with dominant pressure supports the credibility of breakout moves.
• False Move Avoidance: If price moves on low volume or mixed pressure, traders can avoid low-probability entries.
• Market Context Awareness: Users can assess whether a day is behaving normally in terms of participation or is unusually quiet or aggressive.
________________________________________
Basic Usage Guide
1. Add the script to your TradingView chart and set your preferred SMA length for volume comparison.
2. Customize the table’s position using the X and Y settings for clarity and alignment.
3. Interpret the outputs:
o A higher red bar indicates dominant sell pressure.
o A higher green bar indicates dominant buy pressure.
o Volume % above 100% suggests above-average activity, while values below 100% may imply low conviction.
4. Apply to trading decisions:
o High buy pressure and high volume may indicate a strong long opportunity.
o High sell pressure and high volume may support short setups.
o Low volume or conflicting signals may call for caution.
5. Combine with other tools such as trend indicators, support/resistance zones, or price action patterns for more reliable trade setups.
________________________________________
Practical Example
• Sell Pressure: 70% → Suggests strong seller control; potential for short setups.
• Buy Pressure: 30% → Weak buying interest; long trades may carry risk.
• Volume Percentage: 120% → Indicates a surge in participation; movement may have greater validity.
________________________________________
Tips for New Traders
• Use this indicator as a confirmation tool rather than a standalone strategy.
• Begin on higher timeframes (4-hour or daily) to develop familiarity.
• Compare multiple examples to identify reliable patterns over time.
• Always incorporate proper risk management, including stop losses.
________________________________________
Disclaimer from aiTrendview
This indicator is intended solely for educational and informational use. It does not constitute investment advice, trade signals, or financial recommendations. aiTrendview and its affiliates are not liable for any trading losses incurred through use of this tool. All trading involves risk. Past performance of any indicator does not guarantee future results. Users should conduct independent research and consult with a certified financial advisor before making any trading decisions.

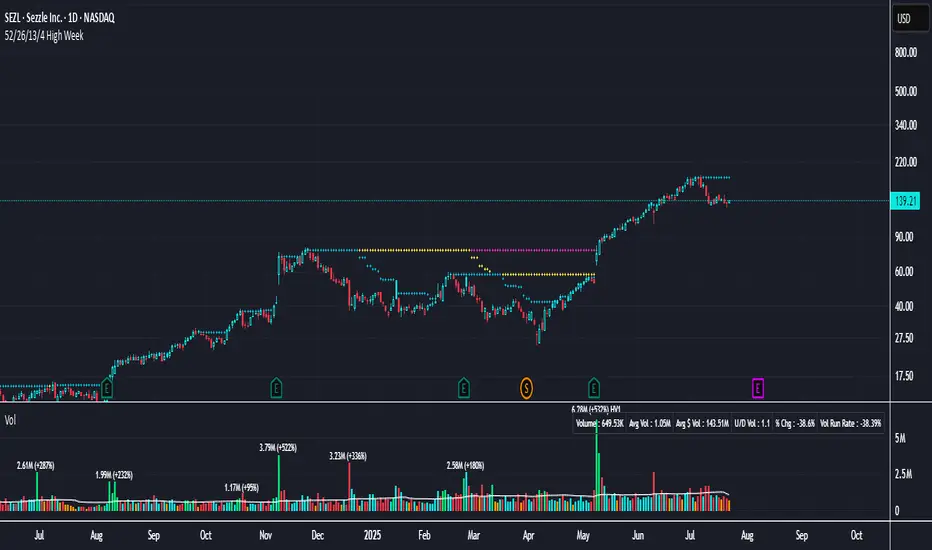
52/26/13/4 High WeekThis is a tool to identify the 52-week high of a candlestick for use in breakout strategies. It can be used in conjunction with Pocket Pivot and EMA or Volume.
It is ideal for studying price behavior and trend following.
LTHB & HTLB Zones with AlertsIn price action trading, the Lowest Tick of the Highest Bar (LTHB) and the Highest Tick of the Lowest Bar (HTLB) are important concepts for support/resistance identification, trend exhaustion, and reversal confirmation. Here's what they mean and why they matter:
🔹 Definitions
1. Lowest Tick of the Highest Bar (LTHB):
The lowest price (tick) of the bar (candlestick) with the highest high in a recent price swing.
Significance: It marks the support inside an upward swing. If price breaks below this, it often indicates loss of upward momentum or reversal.
2. Highest Tick of the Lowest Bar (HTLB):
The highest price of the bar with the lowest low in a swing.
Significance: It acts as a resistance inside a downward swing. If price moves above this, it can signal a bullish reversal.
🔸 Why Are They Significant?
Concept LTHB HTLB
Trend Reversal - Break below LTHB → possible bearish reversal Break above HTLB → possible bullish reversal
Swing Confirmation -Holding above LTHB → continuation of uptrend Holding below HTLB → continuation of downtrend
Trap Detection - Stop hunts often occur just below LTHB Stop hunts often occur just above HTLB
Risk Management -Acts as logical stop-loss in long trades Acts as logical stop-loss in short trades
🔸 Uses in Strategy
1. Breakout Traders use these levels as entry triggers.
2. Reversal Traders look for price failing to hold these levels for early reversal signs.
3. Structure-Based Traders use them to confirm higher highs/lower lows.
4. Stop Placement: Tight stops just beyond LTHB/HTLB help manage risk in swing trades.
🔔 How to Set Alerts in TradingView:
Add the script to your chart.
Open the "⚠️ Alerts" tab.
Click "Create Alert".
In the "Condition" dropdown, select one of:
Enter LTHB Zone
Exit LTHB Zone
Enter HTLB Zone
Exit HTLB Zone
Set desired alert frequency (e.g., once per bar or once).
Click Create.

3 Bar Reversal3 Bar Reversal
This pattern is described in John Carter's "Mastering the Trade"
The 3 Bar Reversal indicator is a simple but effective price action tool designed to highlight potential short-term reversals in market direction. It monitors consecutive bar behavior and identifies turning points based on a three-bar pattern. This tool can assist traders in spotting trend exhaustion or early signs of a reversal, particularly in scalping or short-term trading strategies.
How It Works
This indicator analyzes the relationship between consecutive bar closes:
It counts how many bars have passed since the price closed higher than the previous close (barssince(close >= close )) — referred to as an "up streak".
It also counts how many bars have passed since the price closed lower than the previous close (barssince(close <= close )) — known as a "down streak".
A reversal condition is met when:
There have been exactly 3 bars in a row moving in one direction (up or down), and
The 4th bar closes in the opposite direction.
When this condition is detected, the script performs two actions:
Plots a triangle on the chart to signal the potential reversal:
A green triangle below the bar for a possible long (buy) opportunity.
A red triangle above the bar for a possible short (sell) opportunity.
Triggers an alert condition so users can set notifications for when a reversal is detected.
Interpretation
Long Signal: The market has printed 3 consecutive lower closes, followed by a higher close — suggesting bullish momentum may be emerging.
Short Signal: The market has printed 3 consecutive higher closes, followed by a lower close — indicating possible bearish momentum.
These patterns are common in market retracements and can act as confirmation signals when used with other indicators such as RSI, MACD, support/resistance, or volume analysis.
Usage Examples
Scalping: Use the reversal signal to quickly enter short-term trades after a short-term exhaustion move.
Swing Trading: Combine this with trend indicators (e.g., moving averages) to time pullbacks within larger trends.
Confirmation Tool: Use this indicator alongside candlestick patterns or support/resistance zones to validate entry or exit points.
Alert Setup: Enable alerts based on the built-in alertcondition to receive instant notifications for potential trade setups.
Limitations
The 3-bar reversal logic does not guarantee a trend change; it signals potential reversals, which may need confirmation.
Best used in conjunction with broader context such as trend direction, market structure, or other technical indicators.

Long Explosive V1The “Long Explosive V1” strategy calculates the percentage change in price from the last closing price of the candlestick, so that if it increases by a certain percentage it goes long, but if it decreases by another percentage it sends an exit order, so that the percentage limits above and below the current price function as inherent stop loss and take profit, with the benefit of taking advantage of the volatility of the bull market.
Entries and exits are always at the market and based on percentage changes in the price. Of course, the default configuration of the strategy considers a position with a 5% risk control, modest initial capital and standard commissions, which helps to obtain realistic results and protect the user from unexpectedly controlled potential losses.
It is again emphasized that it is always advisable to adjust the parameters of the strategy well, so that the risk-reward is well controlled.

MestreDoFOMO Future Projection BoxMestreDoFOMO Future Projection Box - Description & How to Use
Description
The "MestreDoFOMO Future Projection Box" is a TradingView indicator tailored for crypto traders (e.g., BTC/USDT on 1H, 4H, or 1D timeframes). It visualizes current price ranges, projects future levels, and confirms trends using semi-transparent boxes. With labeled price levels and built-in alerts, it’s a simple yet powerful tool for identifying support, resistance, and potential price targets.
How It Works
Blue Box (Current Channel): Shows the recent price range over the last 10 bars (adjustable). The top is the highest high plus an ATR buffer, and the bottom is the lowest low minus the buffer. Labels display exact levels (e.g., "Top: 114000", "Bottom: 102600").
Green Box (Future Projection): Projects the price range 10 bars ahead (adjustable) based on the trend slope of the moving average. Labels show "Proj Top" and "Proj Bottom" for future targets.
Orange Box (Moving Average): Traces a 50-period EMA (adjustable) to confirm the trend. An upward slope signals a bullish trend; a downward slope signals a bearish trend. A label shows the current MA value (e.g., "MA: 105000").
Alerts: Triggers when the price nears the projected top or bottom, helping you catch breakouts or retracements.
How to Use
Add the Indicator: Apply "MestreDoFOMO Future Projection Box" to your chart in TradingView.
Interpret the Trend: Check the orange box’s slope—upward for bullish, downward for bearish.
Identify Key Levels: Use the blue box’s top as resistance and bottom as support. On a 4H chart, if the top is 114,000, expect resistance; if the bottom is 102,600, expect support.
Plan Targets: Use the green box for future targets—top for profit-taking (e.g., 114,000), bottom for stop-loss or buying (e.g., 102,600).
Set Alerts: Enable alerts for "Near Upper Projection" or "Near Lower Projection" to get notified when the price hits key levels.
Trade Examples:
Bullish: If the price breaks above the blue box top (e.g., 114,000), buy with a target at the green box top. Set a stop-loss below the green box bottom.
Bearish: If the price rejects at the blue box top and drops below the orange MA, short with a target at the blue box bottom.
Customize: Adjust the lookback period, projection bars, ATR multiplier, and MA length in the settings to fit your trading style.
Tips
Use on 1H for short-term trades, 4H for swing trades, or 1D for long-term trends.
Combine with volume or RSI to confirm signals.
Validate levels with market structure (e.g., candlestick patterns).

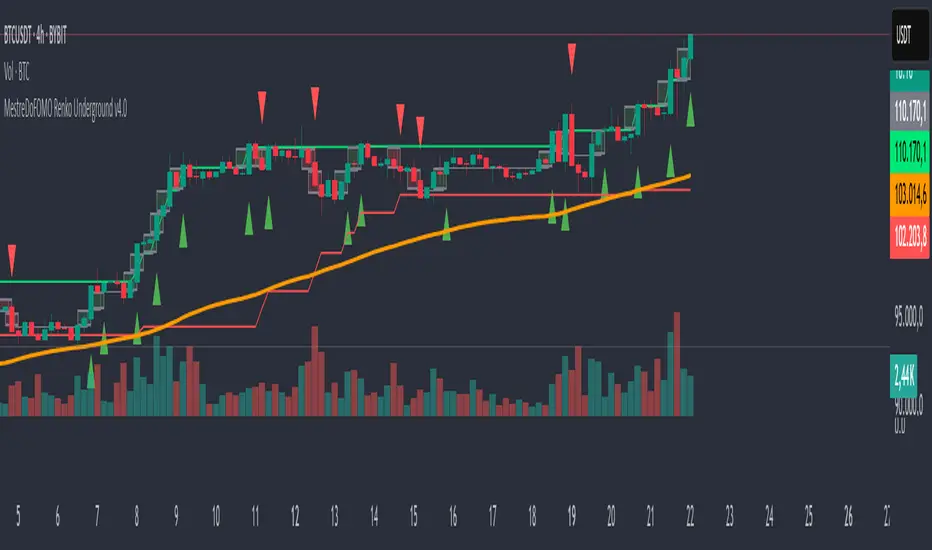
MestreDoFOMO Renko Underground v4.0Description:
The "MestreDoFOMO Renko Underground v4.0" is a custom indicator for TradingView that creates a dynamic Renko chart to help identify trends and reversal points in the market. Unlike traditional candlestick charts, Renko focuses solely on significant price movements, ignoring time and market noise. This script includes advanced features like support and resistance channels, moving averages, and alerts to assist with your trading decisions.
How It Works:
Dynamic Renko Bricks:
The brick size (price units to form each "box" on the chart) is calculated automatically using the ATR (Average True Range) with an adjustable multiplier. This means the size adapts to the asset's volatility (e.g., BTC/USDT). When the price moves up or down by the brick size, a new brick is created (green for up, red for down).
Reversal Signals:
Green triangles (🔼) appear below bars when the trend shifts to bullish, and red triangles (🔽) appear above when it shifts to bearish. These signals only appear on direction changes, reducing false signals.
Renko Channel:
The script draws two lines (green for resistance and red for support) based on the highs and lows of the last 10 bricks (or the value you set). This helps identify key price zones.
Moving Average on Bricks:
An orange line shows the moving average (EMA or SMA, your choice) of the last 20 bricks, helping confirm the overall trend.
Alerts:
You can set up alerts in TradingView to be notified when the trend shifts to bullish or bearish, perfect for active trading.
Visualization:
A gray dashed line shows the level of the last brick, providing a clear reference for the next expected move.
How to Use:
Add the indicator to your chart (e.g., BTC/USDT 1D).
Adjust parameters like the ATR multiplier, channel length, and moving average type in the settings menu.
Watch the bricks and signals to identify trends, and use the channels and moving average to plan entries and exits.
Enable alerts to receive real-time notifications.
Tip:
Test on different timeframes (1H, 4H, 1D) and adjust the ATR multiplier to match the volatility of the asset you're trading. Combine with other indicators (like RSI) for better results!
Buy and Sell Pressure Signals (Clean)This script identifies strong buy and sell pressure based purely on candlestick structure — no indicators, no clutter. It highlights key reversal or momentum candles using minimal visuals:
🔼 Green Triangle (Buy Pressure): A bullish candle with a large body and small upper/lower wicks, indicating strong upward momentum and buyer control.
🔽 Red Triangle (Sell Pressure): A bearish candle with a large body and small wicks, showing strong downward momentum and seller dominance.
Designed for traders who prefer clean, price-action-based signals without text labels or distracting overlays. Ideal for scalping, trend confirmation, or identifying exhaustion zones.

yatofxDescription: "Ramon Coto's 3 Session Bar Color" Indicator
This TradingView Pine Script indicator colors candlestick bars based on three custom trading sessions. It allows traders to visually distinguish different market timeframes on their charts.
Features:
Three configurable trading sessions with user-defined time ranges.
Customizable session colors:
Session A → Blue
Session B → Red
Session C → Lime
Enable/disable sessions independently using input toggles.
Automatic session detection: Bars are colored based on the active session.
Optimized for TradingView Mobile & Desktop with clear and efficient logic.
How It Works:
1. User Inputs: The script takes session time ranges and enables/disables each session.
2. Session Detection: The script checks whether the current time falls within any of the defined sessions.
3. Bar Coloring: If a session is active, the corresponding color is applied to the bars.
This indicator helps traders quickly recognize which market session they are in, improving decision-making for session-based strategies.

Fair Value Gap Finder [Find Better Trades]Fair Value Gap Finder (FVG) – Spot Institutional Imbalances
📈 Identify Key Market Imbalances
The Fair Value Gap Finder automatically detects price inefficiencies where aggressive buying or selling has created an imbalance in liquidity. These gaps, often left by institutional traders, can serve as key areas for price to revisit before continuing its trend.
🔍 How It Works:
Highlights bullish Fair Value Gaps (FVGs) in green, signaling potential support zones.
Highlights bearish Fair Value Gaps (FVGs) in red, signaling potential resistance zones.
Uses ATR-based filtering to eliminate small, insignificant gaps, focusing only on high-probability setups.
Alerts included! Get notified when a valid Fair Value Gap is detected.
📊 How to Trade Using FVGs:
✅ For Buy Trades: Wait for price to return to a bullish FVG and confirm support before entering long.
✅ For Sell Trades: Wait for price to revisit a bearish FVG and confirm resistance before entering short.
✅ Use with candlestick patterns, trend analysis, or volume for additional confirmation.
⚙️ Customizable Settings:
Adjust the ATR Multiplier to control how large a gap must be before triggering a signal.
Enable alerts to stay informed in real time when new FVGs appear.
💡 Why Use This Indicator?
Fair Value Gaps are widely used by professional traders to spot areas of liquidity, making them valuable for scalping, swing trading, and institutional-style trading.
🚀 Add it to your TradingView chart and start trading with precision!

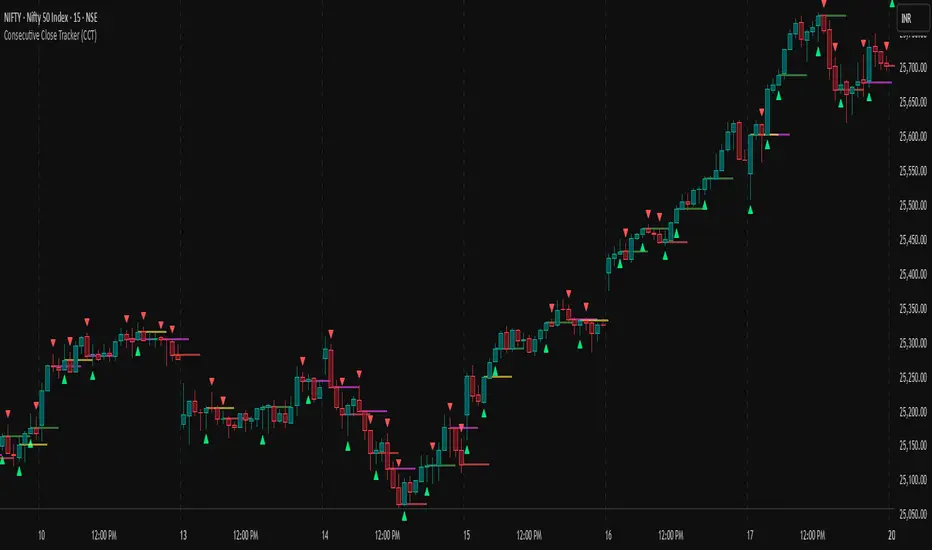
Consecutive Close Tracker (CCT)Consecutive Close Tracker (CCT) Indicator
The Consecutive Close Tracker (CCT) is a powerful momentum and breakout detection tool designed to identify consecutive bullish and bearish closes, potential reversals, and breakout points. By tracking consecutive candle closes and plotting key levels, this indicator provides traders with visual cues to recognize trend continuations, reversals, and breakout opportunities effectively.
🔹 Key Features of CCT
1️⃣ Consecutive Move Lines (Green/Red/Yellow Lines)
Tracks three consecutive bullish or bearish closes.
If the fourth candle confirms the trend, a green line (bullish) or red line (bearish) is drawn.
If the fourth candle fails to confirm, a yellow line is drawn, signaling potential indecision.
Helps traders spot trend continuations and exhaustion points.
2️⃣ Reversal Detection Lines (Cyan & Light Red)
Identifies bullish and bearish reversals based on three higher/lower closes followed by a reversal.
A cyan line indicates a bullish reversal, while a light red line signals a bearish reversal.
Useful for traders looking for trend reversals and key turning points.
3️⃣ Breakout Line (Dynamic Resistance/Support Level)
Automatically calculates a breakout level based on the previous timeframe’s open and close.
Can be customized to use different timeframes (e.g., hourly, daily, weekly).
Acts as a dynamic resistance or support level, helping traders determine breakout opportunities.
🔍 How to Use the Indicator?
✅ 1. Spotting Trend Continuations with Consecutive Move Lines
Green Line: Three consecutive bullish closes followed by a fourth higher close.
🚀 Indicates strong buying pressure & potential uptrend continuation.
Red Line: Three consecutive bearish closes followed by a fourth lower close.
📉 Indicates strong selling pressure & potential downtrend continuation.
Yellow Line: Three consecutive closes, but the fourth candle fails to confirm.
⚠️ Signals possible indecision or trend exhaustion.
🔥 Best Strategy:
If a green line appears near support, consider long entries.
If a red line appears near resistance, consider short entries.
If a yellow line appears, wait for further confirmation before entering a trade.
✅ 2. Identifying Trend Reversals with Reversal Lines
Cyan Line: A bearish trend with three consecutive lower closes, followed by a bullish candle → Possible uptrend reversal.
Light Red Line: A bullish trend with three consecutive higher closes, followed by a bearish candle → Possible downtrend reversal.
🔥 Best Strategy:
If a cyan line appears near a major support level, look for long entry opportunities.
If a light red line appears near resistance, prepare for a potential short entry.
Use these lines in combination with candlestick patterns (e.g., bullish engulfing, pin bars) for confirmation.
✅ 3. Using the Breakout Line for Key Entry & Exit Points
The breakout line represents a key dynamic level (midpoint of the previous timeframe’s open & close).
If price breaks above the breakout line, it suggests bullish momentum → Consider long trades.
If price breaks below the breakout line, it suggests bearish momentum → Consider short trades.
🔥 Best Strategy:
Use the breakout line in combination with support & resistance levels.
When price approaches the breakout line, watch for confirmation candles before entering a trade.
The breakout line can also act as a stop-loss or take-profit level.
🎯 How to Utilize CCT Effectively?
✅ For Intraday Traders
Use the consecutive close tracker on a 5M or 15M chart to catch short-term trends.
Watch for reversal lines near major intraday support/resistance for quick scalping opportunities.
Use the breakout line from the hourly chart to identify potential trend shifts.
✅ For Swing Traders
Apply the indicator on 1H, 4H, or daily charts to track medium-term trends.
Look for green/red lines near key Fibonacci retracement or pivot levels.
Use reversal lines to detect early trend reversals before bigger moves occur.
✅ For Breakout Traders
Focus on the breakout line on higher timeframes (e.g., 1H, 4H, Daily) to identify strong momentum shifts.
If price crosses the breakout line with strong volume, enter trades with trend confirmation.
Place stop-loss just below the breakout level for controlled risk management.
🏆 Final Thoughts
The Consecutive Close Tracker (CCT) is a powerful momentum and reversal indicator that helps traders:
✅ Identify strong trend continuations (green/red lines).
✅ Detect early reversal points (cyan/light red lines).
✅ Use a dynamic breakout line for better trade entries & exits.
Whether you’re an intraday trader, swing trader, or breakout trader, this tool can enhance your market insights and improve your trading decisions. 📈🔥
🚀 Try it out, and integrate it with your strategy to maximize its potential! 🚀
Color Code OverlayColor Code Overlay Indicator
The Color Code Overlay indicator is designed to provide a dynamic visualization of price action using color-coded candles. This overlay highlights trend reversals and bullish/bearish conditions by utilizing a custom candle calculation and the Average True Range (ATR) percentage threshold to detect significant price changes.
Key Features:
Custom Candle Calculation:
The Color Code Overlay is based on a modified candlestick calculation that takes the average of the open, high, low, and close prices to determine the candle’s close value. The open value is derived from the midpoint of the current candle's open and close or the previous Color Code Overlay close. The high and low values are based on the highest and lowest prices between the open, close, and the actual market high/low.
Color-Coding:
Green: The candle is colored green when the close is higher than the open, indicating a bullish trend.
Red: The candle is colored red when the close is lower than the open, indicating a bearish trend.
Color Change Detection:
The indicator detects significant color changes, signaling trend reversals. The transitions are determined based on the following conditions:
A bullish to bearish change (green to red) is identified when the current candle's close is lower than the open, and the price difference exceeds 1% of the candle's range (calculated using the current candle's high and low).
A bearish to bullish change (red to green) occurs when the current candle’s close is higher than the open, and the price difference also exceeds 1% of the candle's range.
Threshold Calculation:
The dynamic threshold for detecting significant price changes is based on the ATR percentage of the candle's range. By default, the indicator uses 1% of the range for detecting meaningful price movement. This ensures that only substantial changes trigger the color shifts, providing clear signals for potential trend reversals or market momentum.
Arrows for Color Changes:
A red triangle down is plotted above the bar when the color changes from green to red (bullish to bearish).
A green triangle up is plotted below the bar when the color changes from red to green (bearish to bullish).
Alerts:
The indicator includes alert conditions that notify you when:
The price is bullish (green candle).
The price is bearish (red candle).
There is a change from green to red (bullish to bearish).
There is a change from red to green (bearish to bullish).
How It Works:
The Color Code Overlay dynamically calculates the candle values based on market data and applies the ATR-based threshold to identify color changes. A shift from bullish to bearish or vice versa is only triggered when the price moves significantly beyond the calculated threshold, helping to avoid false signals from minor price fluctuations.
This indicator is particularly useful for traders looking to spot trend reversals and significant market shifts with a clear, color-coded visual representation of price action. The Color Code Overlay can be used alongside other technical indicators to enhance decision-making and improve trading strategies.

Mile Runner - Swing Trade LONGMile Runner - Swing Trade LONG Indicator - By @jerolourenco
Overview
The Mile Runner - Swing Trade LONG indicator is designed for swing traders who focus on LONG positions in stocks, BDRs (Brazilian Depositary Receipts), and ETFs. It provides clear entry signals, stop loss, and take profit levels, helping traders identify optimal buying opportunities with a robust set of technical filters. The indicator is optimized for daily candlestick charts and combines multiple technical analysis tools to ensure high-probability trades.
Key Features
Entry Signals: Visualized as green triangles below the price bars, indicating a potential LONG entry.
Stop Loss and Take Profit Levels: Automatically plotted on the chart for easy reference.
Stop Loss: Based on the most recent pivot low (support level).
Take Profit: Calculated using a Fibonacci-based projection from the entry price to the stop loss.
Trend and Momentum Filters: Ensures trades align with the prevailing trend and have sufficient momentum.
Volume and Volatility Confirmation: Verifies market interest and price movement potential.
How It Works
The indicator uses a combination of technical tools to filter and confirm trade setups:
Exponential Moving Averages (EMAs):
A short EMA (default: 9 periods) and a long EMA (default: 21 periods) identify the trend.
A bullish crossover (EMA9 crosses above EMA21) signals a potential upward trend.
Money Flow Index (MFI):
Confirms buying pressure when MFI > 50.
Average True Range (ATR):
Ensures sufficient volatility by checking if ATR exceeds its 20-period moving average.
Volume:
Confirms market interest when volume exceeds its 20-period moving average.
Pivot Lows:
Identifies recent support levels (pivot lows) to set the stop loss.
Ensures the pivot low is recent (within the last 10 bars by default).
Additional Trend Filter:
Confirms the long EMA is rising, reinforcing the bullish trend.
Inputs and Customization
The indicator is highly customizable, allowing traders to tailor it to their strategies:
EMA Periods: Adjust the short and long EMA lengths.
ATR and MFI Periods: Modify lookback periods for volatility and momentum.
Pivot Lookback: Control the sensitivity of pivot low detection.
Fibonacci Level: Adjust the Fibonacci retracement level for take profit.
Take Profit Multiplier: Fine-tune the aggressiveness of the take profit target.
Max Pivot Age: Set the maximum bars since the last pivot low for relevance.
Usage Instructions
Apply the Indicator:
Add the "Mile Runner - Swing Trade LONG" indicator to your TradingView chart.
Best used on daily charts for swing trading.
Look for Entry Signals:
A green triangle below the price bar signals a potential LONG entry.
Set Stop Loss and Take Profit:
Stop Loss: Red dashed line indicating the stop loss level.
Take Profit: Purple dashed line showing the take profit level.
Monitor the Trade:
The entry price is marked with a green dashed line for reference.
Adjust trade management based on the plotted levels.
Set Alerts:
Use the built-in alert condition to get notified of new LONG entry signals.
Important Notes
For LONG Positions Only : Designed exclusively for swing trading LONG positions.
Timeframe: Optimized for daily charts but can be tested on other timeframes.
Asset Types: Works best with stocks, BDRs, and ETFs.
Risk Management: Always align stop loss and take profit levels with your risk tolerance.
Why Use Mile Runner?
The Mile Runner indicator simplifies swing trading by integrating trend, momentum, volume, and volatility filters into one user-friendly tool. It helps traders:
Identify high-probability entry points.
Establish clear stop loss and take profit levels.
Avoid low-volatility or low-volume markets.
Focus on assets with strong buying pressure and recent support.
By following its signals and levels, traders can make informed decisions and enhance their swing trading performance. Customize the inputs and test it on your favorite assets—happy trading!

Daily COC Strategy with SHERLOCK WAVESThis indicator implements a unique trading strategy known as the "Daily COC (Candle Over Candle) Strategy" enhanced with "SHERLOCK WAVES" for pattern recognition. It's designed for traders looking to capitalize on specific candlestick formations with a negative risk-reward ratio, with the aim of achieving a high win rate (over 70%) through numerous trading opportunities, despite each trade having a higher risk relative to the reward.
Key Features:
Pattern Recognition: Identifies a setup based on three consecutive candles - a red candle followed by a shooting star, then an entry candle that does not break below the shooting star's low.
Negative Risk/Reward Trade Selection: Focuses on entries where the potential stop loss is greater than the take profit, banking on a high win rate to offset the individual trade's negative risk-reward ratio.
Visual Signals:
Green Label: Marks potential entry points at the high of the candle before the entry.
Green Dot: Indicates a winning trade closure.
Red Dot: Signals a losing trade closure.
Blue Circle: Warns when the current candle is within 2% of breaking above the previous candle's high, suggesting a potential setup is developing.
Green Circle: Plots the take profit level.
Red Circle: Plots the stop loss level.
Dynamic Statistics: A live updating label showing the number of trades, wins, losses, open trades, current account balance, and win percentage.
Customizable Parameters:
Risk % per Trade: Adjust the percentage of your account balance you're willing to risk on each trade.
Initial Account Balance: Set your starting balance for tracking performance.
Start Date for Strategy: Define when the strategy should start calculating from, allowing for backtesting.
Alerts:
An alert condition is set for when a potential trade setup is developing, helping traders prepare for entries.
Usage Tips:
This strategy is predicated on the idea that a high win rate can compensate for the negative risk-reward ratio of individual trades. It might not suit all market conditions or traders' risk profiles.
Use this strategy in conjunction with other analysis methods to validate trade setups.
Note: Always backtest thoroughly before applying to live markets. Consider this tool as part of a broader trading strategy, not a standalone solution. Monitor your win rate and adjust your risk management accordingly to ensure the strategy remains profitable over time.
This description now correctly explains the purpose behind the negative risk-reward ratio in the context of your trading strategy.

Gap Down Reversal Strategy█ STRATEGY OVERVIEW
The "Gap Down Reversal Strategy" capitalizes on price recovery patterns following bearish gap-down openings. This mean-reversion approach enters long positions on confirmed intraday recoveries and exits when prices breach previous session highs. This strategy is NOT optimized.
█ What is a Gap Down Reversal?
A gap down reversal occurs when:
An instrument opens significantly below its prior session's low (price gap)
Selling pressure exhausts itself during the session
Buyers regain control, pushing price back above the opening level
Creates a candlestick with:
• Open < Prior Session Low (true gap)
• Close > Open (bullish reversal candle)
█ SIGNAL GENERATION
1. LONG ENTRY CONDITION
Previous candle closes BELOW its opening price (bearish candle)
Current session opens BELOW prior candle's low (gap down)
Current candle closes ABOVE its opening price (bullish reversal)
Executes market order at session close
2. EXIT CONDITION
A Sell Signal is generated when the current closing price exceeds the highest high of the previous seven bars (`close > _highest `). This indicates that the price has shown strength, potentially confirming the reversal and prompting the strategy to exit the position.
█ PERFORMANCE OVERVIEW
Ideal Market: High volatility instruments with frequent gaps
Key Risk: False reversals in sustained downtrends
Optimization Tip: Test varying gap thresholds (1-3% ranges)

Volume-Based RSI Color Indicator with MAsVolume-Based RSI Color Indicator with MAs
Overview
This script combines the Relative Strength Index (RSI) with volume analysis to provide an enhanced perspective on market conditions. By dynamically coloring the RSI line based on overbought/oversold conditions and volume thresholds, this indicator helps traders quickly identify high-probability reversal zones. Additionally, it incorporates short-term and long-term moving averages (MAs) of the RSI for trend analysis, making it a versatile tool for scalping and swing trading strategies.
Key Features
Dynamic RSI Color Coding:
The RSI line changes color based on two conditions:
Overbought/High Volume: RSI is above the overbought threshold (default: 70) and volume exceeds the average volume by a user-defined multiplier (default: 2.0). The line turns red, indicating potential reversal zones.
Oversold/High Volume: RSI is below the oversold threshold (default: 30) and volume exceeds the average volume by the multiplier. The line turns green, suggesting potential buying opportunities.
Neutral Conditions: Default blue color for all other scenarios.
Volume Integration:
Unlike standard RSI indicators, this script incorporates volume data to refine signals, helping traders avoid false signals in low-volume environments.
RSI Moving Averages:
Two moving averages of the RSI (short-term and long-term) provide trend context:
200-period MA: Highlights the long-term trend in RSI values.
20-period MA: Shows short-term fluctuations for quick decision-making.
Both MAs can be calculated using Simple or Exponential methods, giving users flexibility.
Visual Aids:
Horizontal lines at the overbought (70) and oversold (30) levels help define the boundaries of expected price action extremes.
How It Works
The script calculates the RSI over a user-defined length (default: 14).
Volume data is compared to its moving average to determine if it exceeds the user-defined high-volume threshold.
When RSI and volume conditions align, the RSI line is dynamically colored to indicate potential overbought/oversold zones.
The RSI moving averages provide additional context to confirm trends or reversals.
How to Use
Identify Reversal Zones:
Look for green RSI signals in oversold conditions to identify potential buying opportunities.
Look for red RSI signals in overbought conditions to identify potential selling opportunities.
Use Moving Averages for Confirmation:
When the RSI is above its 200-period MA, the long-term trend is bullish; consider only long trades.
When the RSI is below its 200-period MA, the trend is bearish; consider only short trades.
Combine with Other Tools:
This indicator works best when used alongside price action analysis, candlestick patterns, or support/resistance levels.
Originality
This script is unique in combining volume analysis with RSI and RSI-specific moving averages. While many indicators focus on RSI or volume separately, this script marries these two key metrics to filter out weak signals and improve trade decision accuracy.
Chart Recommendations
Clean Chart: Use this indicator on a clean chart without additional overlays for maximum clarity.
Timeframes: Works well on intraday charts (e.g., 5m, 15m) for scalping and on higher timeframes (e.g., 1H, 4H, Daily) for swing trading.
Disclaimer
This indicator is a tool to aid trading decisions and should not be used in isolation. Always consider other factors such as market conditions, news events, and risk management.

Perfect Hammer Pattern Indicators and Alerts# Perfect Hammer Pattern Indicators and Alerts
This indicator identifies a specific and precise hammer candlestick pattern formation that can signal potential trend reversals or continuation setups. Unlike traditional hammer pattern indicators, this script focuses on exact wick measurements to identify high-probability trade setups.
## Pattern Specifications
### Bullish Setup Requirements
- Two consecutive green (bullish) candles
- Both candles must have NO lower wick (perfect bottom)
- Both candles must have an upper wick (showing buying pressure)
- Previous candle must be red (bearish) for context
- Marked with a green 'H' below the pattern
### Bearish Setup Requirements
- Two consecutive red (bearish) candles
- Both candles must have NO upper wick (perfect top)
- Both candles must have a lower wick (showing selling pressure)
- Previous candle must be green (bullish) for context
- Marked with a red 'H' above the pattern
## Trading Logic
This pattern is particularly effective because it shows clear control by either buyers (bullish pattern) or sellers (bearish pattern):
- In the bullish pattern, the absence of lower wicks indicates strong buying pressure preventing prices from falling below the open, while the upper wicks show profit-taking at highs
- In the bearish pattern, the absence of upper wicks shows strong selling pressure capping any upward movement, while the lower wicks indicate some buying support below
## Alerts
The indicator includes two alert conditions:
1. Bullish Pattern Alert: Triggers when two perfect bullish hammers appear after a bearish candle
2. Bearish Pattern Alert: Triggers when two perfect bearish hammers appear after a bullish candle
## Usage Tips
- Best used on timeframes 15 minutes and above
- Consider using in conjunction with key support/resistance levels
- Volume confirmation can increase pattern reliability
- The pattern may signal either trend continuation or reversal - always consider the larger market context
## Notes
- This indicator focuses on precise hammer formations rather than approximate patterns
- The requirement for consecutive perfect hammers makes this a relatively rare but high-probability setup
- Visual markers ('H') provide easy pattern identification on charts

Eze Profit Range Detection FilterThe Range Detection Filter is a technical analysis tool designed to help traders identify range-bound market conditions and focus on breakout opportunities. It combines the ATR (Average True Range) for volatility analysis and the ADX (Average Directional Index) for trend strength evaluation to highlight consolidation phases and alert traders when the market is ready to break out.
This indicator provides visual cues and customizable alerts, making it suitable for traders looking to avoid false signals during choppy markets and capitalize on trending moves following a breakout.
What Makes It Unique?
ATR for Volatility:
Measures market volatility by comparing ATR with its moving average.
Consolidation phases are flagged when ATR remains below its moving average for a sustained period.
ADX for Trend Strength:
Monitors trend strength, confirming range-bound conditions when ADX falls below a user-defined threshold (default: 20).
Combines with ATR to ensure accurate detection of trendless periods.
Breakout Alerts:
Notifies traders of breakout opportunities when the price moves outside the highest high or lowest low of the range.
How It Works:
Range Detection:
The market is considered "in range" when:
ATR is below its moving average, indicating low volatility.
ADX is below the threshold, confirming a lack of trend strength.
Visual Indication:
A yellow background highlights range-bound conditions, allowing traders to avoid low-probability trades.
Breakout Detection:
Alerts are triggered for breakouts above or below the range to help traders identify potential opportunities.
Features:
Range Highlighting:
Automatically detects and highlights range-bound markets using a yellow background.
Breakout Alerts:
Sends alerts for breakouts above or below the range once the market exits consolidation.
Customizable Inputs:
ATR length, moving average length, and ADX parameters are fully adjustable to adapt to various trading styles and asset classes.
Multi-Timeframe Compatibility:
Suitable for all markets and timeframes, including stocks, forex, and cryptocurrencies.
How to Use:
Identify Ranges:
Avoid trading when the yellow background appears, signaling a range-bound market.
Focus on Breakouts:
Look for alerts indicating breakouts above or below the range for potential trending opportunities.
Combine with Other Indicators:
Use volume analysis, momentum oscillators, or candlestick patterns to confirm breakout signals.
Credits:
This script utilizes widely accepted methodologies for ATR and ADX calculations. ADX is calculated manually using directional movement (+DI and -DI) for precise trend detection. The concept has been adapted and enhanced to create this comprehensive range-detection tool.
Notes:
This indicator is intended for educational purposes and should not be used as standalone financial advice.
Always incorporate this tool into a broader trading strategy for optimal results.

Eze Profit - VWAP + MACD Combined SignalThe Eze Profit - VWAP + MACD Combined Signal is an advanced trading tool designed to help traders align price trends with momentum confirmation for better decision-making. By combining Volume-Weighted Average Price (VWAP) and Moving Average Convergence Divergence (MACD), this indicator provides clear entry and exit signals, allowing traders to follow trends and take advantage of momentum shifts.
How It Works:
VWAP:
VWAP represents the average price of an asset, weighted by volume, over a specific period.
It acts as a dynamic support/resistance level and trend filter. Price above VWAP indicates bullish conditions, while price below VWAP suggests bearish conditions.
MACD:
MACD measures momentum through the difference between fast and slow exponential moving averages (EMAs).
Signals are generated when the MACD line crosses its signal line:
Bullish Crossover: Indicates increasing upward momentum.
Bearish Crossunder: Indicates increasing downward momentum.
Combined Logic:
Long Signal: Triggered when price is above VWAP, and MACD exhibits a bullish crossover.
Short Signal: Triggered when price is below VWAP, and MACD exhibits a bearish crossunder.
The script tracks the trader's "in-position" state to prevent redundant signals and ensure clarity.
How to Use:
Use this script to identify potential long and short trading opportunities:
Buy Signal: Enter a long position when the price moves above VWAP and MACD confirms bullish momentum.
Sell Signal: Exit or short when the price drops below VWAP and MACD confirms bearish momentum.
Combine with additional tools like support/resistance, volume analysis, or candlestick patterns for confirmation.
Features:
VWAP Trend Filter: Dynamically adjusts to the trading session to identify overall trend direction.
MACD Momentum Confirmation: Detects key momentum shifts with configurable settings for fast, slow, and signal lengths.
Position State Tracking: Avoids signal redundancy by monitoring open positions.
Buy/Sell Visualizations: Plots Buy/Sell signals directly on the chart for ease of use.
Alerts: Notifies traders in real-time when a long or short signal is triggered.
Customizable Settings:
MACD Fast Length, Slow Length, and Signal Smoothing parameters.
VWAP timeframe resolution to adapt to different trading styles (e.g., intraday or daily).
Credits:
This script is based on standard VWAP and MACD calculations provided by TradingView’s library and has been enhanced with unique logic for combined signal generation.
Notes:
This indicator is intended for educational purposes and should not be considered financial advice. Use it as part of a broader trading strategy alongside other tools for optimal results.
