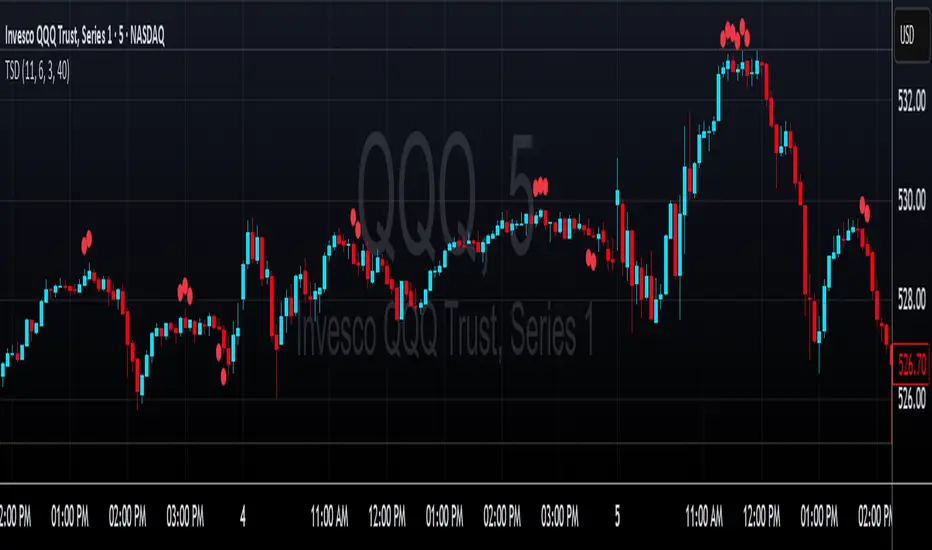
LRHA Trend Shift DetectorLRHA Trend Shift Detector (TSD)
The LRHA Trend Shift Detector is an advanced momentum exhaustion indicator that identifies potential trend reversals and changes by analyzing Linear Regression Heikin Ashi (LRHA) candle patterns. TSD focuses on detecting when strong directional moves begin to lose momentum.
🔬 Methodology
The indicator employs a three-stage detection process:
LRHA Calculation: Applies linear regression smoothing to Heikin Ashi candles, creating ultra-smooth trend-following candles that filter out market noise
Extended Move Detection: Identifies sustained directional moves by counting consecutive bullish or bearish LRHA candles
Momentum Exhaustion Analysis: Monitors for significant changes in candle size compared to recent averages
When an extended move shows clear signs of momentum exhaustion, the indicator signals a potential trend shift with red dots plotted above or below your candlesticks.
⚙️ Parameters
Core Settings
LRHA Length (11): Linear regression period for smoothing calculations. Lower values = more responsive, higher values = smoother trends.
Minimum Trend Bars (4): Consecutive candles required to establish an "extended move." Higher number detects longer term trend changes.
Exhaustion Bars (3): Number of consecutively smaller candles needed to signal exhaustion. Lower is more sensitive.
Size Reduction Threshold (40%): Percentage decrease in candle size to qualify as "exhaustion." Lower is more sensitive.
Trend Trading
Pullback Entries: Identify exhaustion in counter-trend moves for trend continuation
Exit Strategy: Recognize when main trend momentum is fading
Position Sizing: Reduce size when seeing exhaustion in your direction
🎛️ Optimization Tips
For More Signals (Aggressive)
- Decrease LRHA Length (7-9)
- Reduce Minimum Trend Bars (2-3)
- Lower Size Reduction Threshold (25-35%)
For Higher Quality (Conservative)
- Increase LRHA Length (13-18)
- Raise Minimum Trend Bars (5-6)
- Higher Size Reduction Threshold (45-55%)
⚠️ Important Notes⚠️
- **Not a Complete Strategy**: Use as confluence with other analysis methods
- **Market Context Matters**: Consider overall trend direction and key support/resistance levels
- **Risk Management Essential**: Always use proper position sizing and stop losses
- **Backtest First**: Optimize parameters for your specific trading style and instruments
Pesquisar nos scripts por "Candlestick"
Multi Asset Comparative📊 Multi Asset Comparative – Compare Baskets of Cryptos Visually
This indicator allows you to compare the performance of two groups of cryptocurrencies (or any assets) over time, using a clean and intuitive chart.
Instead of looking at each asset separately, this tool gives you a global view by showing how one group performs relative to another — all displayed in the form of candlesticks.
🧠 What This Tool Is For
Markets constantly shift, and capital rotates between sectors or tokens. This script helps you visually track those shifts by answering a key question:
"Is this group of assets getting stronger or weaker compared to another group?"
For example:
Compare altcoins vs Bitcoin
Track the DeFi sector vs Ethereum
Analyze your custom portfolio vs the market
Spot moments when money flows from majors to smaller caps, or vice versa
🧩 How It Works (Simplified)
You select two groups of assets:
Group 1 (up to 20 assets) — the one you want to analyze
Group 2 (up to 5 assets) — your comparison baseline
The indicator then creates a single line of candles that represents the performance of Group 1 compared to Group 2. If the candles go up, it means Group 1 is gaining strength over Group 2. If the candles go down, it's losing ground.
This lets you see market dynamics in one glance, instead of switching charts or running calculations manually.
🚀 Why It's Unique
Unlike many indicators that just show data from one asset, this one provides a bird's-eye view of multiple assets at once — condensed into a simple visual ratio.
It’s:
Customizable (you choose the assets)
Visual and intuitive (no need to interpret tables or formulas)
Actionable (helps with trend confirmation, macro views, and market rotation)
Whether you're a swing trader, a macro analyst, or building your own strategy, this tool can help you spot opportunities hidden in plain sight.
✅ How to Use It
Choose your two groups of assets (e.g., altcoins vs BTC/ETH)
Watch the direction of the candles:
Uptrend = Group 1 gaining strength over Group 2
Downtrend = Group 1 weakening
Use it to confirm market shifts, anticipate rotations, or analyze sector strength

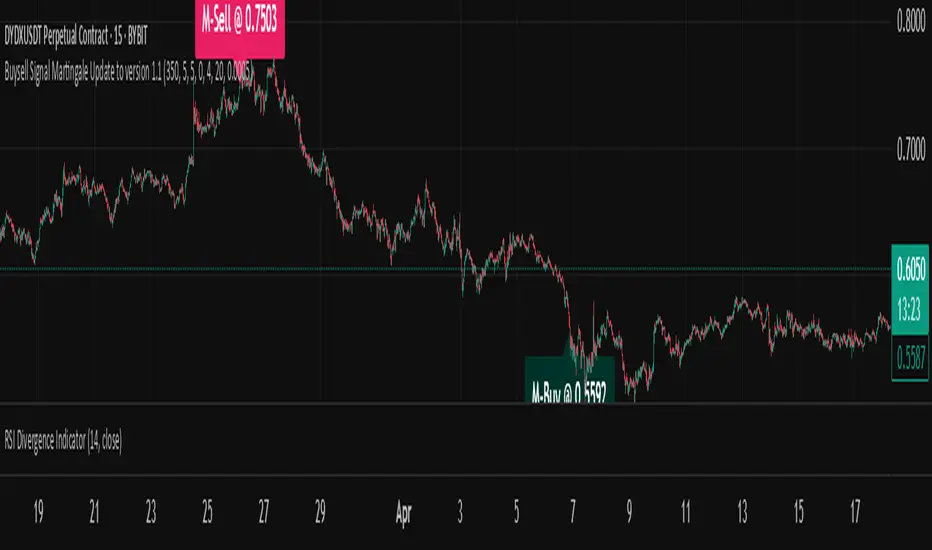
Buysell Martingale Signal - CustomBuysell Martingale Signal - Custom Indicator
Introduction:
This indicator provides a dynamic buy and sell signal system incorporating an adaptive Martingale logic. Built upon the signalLib_yashgode9/2 library, it is designed for use across various markets and timeframes.
Key Features:
Primary Buy & Sell Signals: Identifies initial buy and sell opportunities based on directional changes derived from the signalLib.
Martingale Signals:
For Short (Sell) Positions: A Martingale Sell signal is triggered when the price moves against the existing short position by a specified stepPercent from the last entry price, indicating a potential opportunity to average down or increase position size.
For Long (Buy) Positions: Similarly, a Martingale Buy signal is triggered when the price moves against the existing long position by a stepPercent from the last entry price.
On-Chart Labels: Displays clear, customizable labels on the chart for primary Buy, Sell, Martingale Buy, and Martingale Sell signals.
Customizable Colors: Allows users to set distinct colors for primary signals and Martingale signals for better visual distinction.
Adjustable Sensitivity: Features configurable parameters (DEPTH_ENGINE, DEVIATION_ENGINE, BACKSTEP_ENGINE) to fine-tune the sensitivity of the underlying signal generation.
Webhook Support (Static Message Alerts): This indicator provides alerts with static messages for both primary and Martingale buy/sell signals. These alerts can be leveraged for automation by external systems (such as trading bots or exchange-provided Webhook Signal Trading services).
Important Note: When using these alerts for automation, an external system is required to handle the complex Martingale logic and position management (e.g., tracking steps, PnL calculation, hedging, dynamic quantity sizing), as this indicator solely focuses on signal generation and sending predefined messages.
How to Use:
Add the indicator to your desired chart.
Adjust the input parameters in the indicator's settings to match your specific trading symbol and timeframe.
For automation, you can set up TradingView alerts for the Buy Signal (Main/Martingale) and Sell Signal (Main/Martingale) conditions, pointing them to your preferred Webhook URL.
Configurable Parameters:
DEPTH_ENGINE: (e.g., 30) Controls the depth of analysis for the signal algorithm.
DEVIATION_ENGINE: (e.g., 5) Defines the allowable deviation for signal generation.
BACKSTEP_ENGINE: (e.g., 5) Specifies the number of historical bars to look back.
Martingale Step Percent: (e.g., 0.5) The percentage price movement against the current position that triggers a Martingale signal.
Labels Transparency: Adjusts the transparency of the on-chart signal labels.
Buy-Color / Sell-Color: Sets the color for primary Buy and Sell signal labels.
Martingale Buy-Color / Martingale Sell-Color: Sets the color for Martingale Buy and Sell signal labels.
Label size: Controls the visual size of the labels.
Label Offset: Adjusts the vertical offset of the labels from the candlesticks.
Risk Warning:
Financial trading inherently carries significant risk. Martingale strategies are particularly high-risk and can lead to substantial losses or even complete liquidation of capital if the market moves strongly and persistently against your position. Always backtest thoroughly and practice with a demo account, fully understanding the associated risks, before engaging with real capital.
Micro Gaps DetectorSimple Micro Gap Indicator: A Technical Analysis Tool
The Simple Micro Gap Indicator is a specialized momentum indicator designed to identify and analyze micro gaps between consecutive candlesticks in financial charts. Unlike traditional gap analysis that focuses on larger price gaps, this indicator specifically targets smaller, less noticeable spaces between candles.
Key Features:
Detects minimal price disparities between consecutive candlesticks
Helps identify potential short-term momentum shifts
Useful for high-frequency trading and scalping strategies
Functions as a momentum indicator for short-term price movements
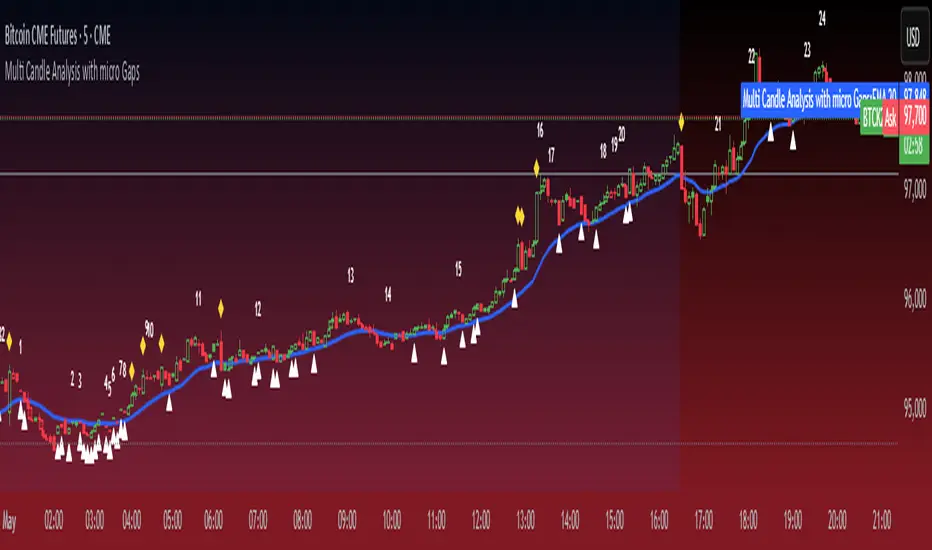
Volume Delta with Custom Colors and Min Delta Input### Indicator Description: **Volume Delta with Custom Colors and Min Delta Input**
---
Volume Delta with Custom Colors and Min Delta Input is a powerful and flexible indicator for analyzing volume delta (the difference between buying and selling volume) on TradingView charts. This indicator visualizes volume delta with customizable colors and allows filtering based on a minimum delta value. It is an ideal tool for traders who want to gain deeper insights into market activity and identify significant volume changes.
---
### Key Features:
Volume Delta Visualization:
- The indicator displays volume delta as candlesticks, where:
- Green candles indicate positive delta (buying volume dominance).
- Red candles indicate negative delta (selling volume dominance).
Customizable Colors:
- Users can choose their preferred colors for positive and negative delta to tailor the indicator to their preferences.
Minimum Delta Volume Filter:
- Added functionality to set a minimum delta volume threshold. This helps ignore insignificant volume changes and focus on important movements.
Flexible Timeframe Selection:
- The indicator supports analyzing volume delta on a different timeframe than the current chart. For example, you can analyze hourly volume delta on a daily chart.
Adaptive Settings:
- Users can configure the moving average (SMA) period and standard deviation multiplier to calculate the delta threshold.
---
### How to Use the Indicator:
Add the Indicator to Your Chart:
- Search for the indicator in the TradingView library and add it to your chart.
Configure the Settings:
- Positive Delta Bar Color: Choose the color for bars with positive delta.
- Negative Delta Bar Color: Choose the color for bars with negative delta.
- Minimum Delta Volume: Set the minimum delta volume value to be displayed.
- Use Custom Timeframe: Enable if you want to analyze volume on a different timeframe.
- Timeframe: Specify the desired timeframe for volume analysis (e.g., "1H" for hourly).
- SMA Period: Set the moving average period for delta calculation.
- Delta Multiplier: Adjust the standard deviation multiplier to fine-tune the delta threshold.
Analyze the Chart:
- Green candles indicate buying volume dominance, while red candles indicate selling volume dominance.
- Use the minimum delta volume filter to focus on significant movements.
---
### Benefits of the Indicator:
Flexibility: Customizable colors, timeframe selection, and filtering make the indicator versatile for various trading strategies.
Clarity: Volume delta visualization as candlesticks allows for quick assessment of market activity.
Noise Reduction: The minimum delta volume filter helps ignore insignificant changes and focus on important movements.
---
### Example Use Cases:
For Scalping: Use a minute timeframe and set a minimum delta volume filter to identify short-term volume anomalies.
For Long-Term Trading: Analyze volume delta on daily or weekly timeframes to identify key support and resistance levels.
---
### Recommendations:
Use the indicator in combination with other technical analysis tools (e.g., support/resistance levels or trendlines) to improve signal accuracy.
Experiment with the settings to adapt the indicator to your trading strategies.
---
Volume Delta with Custom Colors and Min Delta Input is an essential tool for traders who want to gain a deeper understanding of market dynamics and make more informed trading decisions. Try it out today and see its effectiveness for yourself!

SSL Channel MTFSSL Channel with MTF support, This eliminates the noise of a basic SSL Channel script which is based on ErwinBeckers SSL Channel. So i have used a Multi Time Frame approach to have a clear confirmation of trend and reduce Noise and False signals unlike basic SSL Channel.
This script can be used to determine.
Support/Resistance
High/Low Breakout
Trend Direction
MA candles for Entry
The high and low sma are plotted as SSL CHANNEL when ever the high and low sma cross each other a direction change is observed.
The direction of SSL channel determines the trend of the price. The length of the channel can be changed as required a low value has a high noise and direction can be determined with low accuracy. Increasing the length of SSL channel has high accuracy trend confirmation.
The MTF SSL Channel uses plot from higher timeframe this helps in using SSL Channel as a Price Action Tool. Price when ever crosses over or below the channel determines a breakout. Price tries to move between the High SMA line and Low SMA Line of the SSL Channel rejection, breakouts can be easily observed on a lower timeframe using SSL Channel Plot from a higher timeframe.
I have used 5min/15min chart with MTF SSL from a 1Hr/4Hr and a length of 5 instead of 10. This helps quick direction changes over a period of 1hr to 4hr. Price is trapped within the High SMA and Low SMA lines of SSL Channel. In addition to SSL High Low and average mid line is plotted to additional reference.
Buy Sell Signals are plotted based on crossover of SMA High and Low.
Candle are Plotted Using a SMA with length of 5. This Candle Plot can be used to make an entry based on direction confirmation of SSL. keep in mind the direction of SSL Plot and the candle must be same. Preferably Entry can made above or below the midline of SSL Channel. The Candle Plot eliminates the Noise of traditional Japanese Candlesticks.
Additionally MACD Crossover and MACD Trend line confirmations can be used to confirm a Buy Sell and Entry signals
Alerts are also plotted accordingly.

Outside Bar Strategy % (Alessio)Outside Bar Strategy %
This strategy is based on identifying Outside Bars, which occur when the current bar's high is higher than the previous bar's high and its low is lower than the previous bar's low. The strategy enters trades in the direction of the Outside Bar, offering a powerful way to capture price moves following a strong price expansion.
Key Features:
Long and Short Entries: The strategy enters a Long trade when the Outside Bar closes bullish (current close > open), and a Short trade when the Outside Bar closes bearish (current close < open).
Customizable Entry Levels: The entry point is calculated based on a customizable percentage of the Outside Bar's range, allowing flexibility for traders to fine-tune their entries at 50% or 70% of the bar's range.
Stop Loss (SL) and Take Profit (TP):
Stop Loss (SL) is automatically placed at the Outside Bar's low for Long trades and at its high for Short trades.
Take Profit (TP) is calculated as a percentage of the Outside Bar's range, with customizable settings for take-profit levels.
Visual Indicators:
Entry, Stop Loss, and Take Profit levels are plotted as lines on the chart, with customizable colors and widths for easy identification.
Labels are placed on the chart to indicate whether the trade is Long or Short, positioned above or below the Outside Bar's candlestick.
Alerts: Users can enable alerts to receive notifications when a trade is triggered, including details such as entry points and stop loss levels.
Strategy Parameters:
Entry Percentage: Set the entry level as a percentage of the Outside Bar's range (e.g., 50%, 70%).
Take Profit Percentage: Customize the Take Profit level as a percentage of the Outside Bar's range.
Customizable Colors and Line Widths: Adjust the colors and thickness of the entry, stop loss, and take profit lines to fit your preferences.
Alerts: Enable alerts to be notified when a trade is executed or when the entry level is reached.
This strategy is ideal for traders who want to capitalize on significant price moves after a breakout, with clear risk management through Stop Loss and Take Profit levels. The customizable features make it suitable for various market conditions and trading styles.

FVG Breakout/BreakdownThe FVG Breakout/Breakdown indicator is designed to identify potential breakout and breakdown opportunities in the market, based on the concept of Fair Value Gaps (FVGs). FVGs are areas where price moves too quickly, leaving behind gaps between candlesticks, often seen as areas of inefficiency or imbalance that the market tends to revisit.
Key Concepts:
Fair Value Gaps (FVG):
FVG occurs when a price gap is created between candlesticks, typically when the high of one candle is lower than the low of the previous candle (for a bearish FVG) or the low of one candle is higher than the high of the previous candle (for a bullish FVG).
These gaps represent an imbalance between buying and selling pressure, and the market often revisits them, making them valuable for identifying potential entry points.
Bullish FVG: This occurs when the low of the current candle is higher than the high of the previous candle.
Condition: low > high
Bearish FVG: This occurs when the high of the current candle is lower than the low of the previous candle.
Condition: high < low
Breakout/Breakdown Signals:
Breakout: A bullish breakout signal occurs when the price breaks above a defined resistance level after an FVG gap. This suggests that the market may continue moving higher.
Breakdown: A bearish breakdown signal occurs when the price breaks below a defined support level after an FVG gap. This suggests that the market may continue moving lower.
NWOG (New Week Opening Gap):
The NWOG can be used as an additional factor to confirm the FVG signal. The gap between Friday's close and Monday's open is a crucial level for identifying the start of a new move for the week.
NWOG helps to further refine the timing of breakout or breakdown signals, only triggering them when price moves relative to the Monday Open and shows a new direction.
NWOG with FVGThe New Week Opening Gap (NWOG) and Fair Value Gap (FVG) combined indicator is a trading tool designed to analyze price action and detect potential support, resistance, and trade entry opportunities based on two significant concepts:
New Week Opening Gap (NWOG): The price range between the high and low of the first candle of the new trading week.
Fair Value Gap (FVG): A price imbalance or gap between candlesticks, where price may retrace to fill the gap, indicating potential support or resistance zones.
When combined, these two concepts help traders identify key price levels (from the new week open) and price imbalances (from FVGs), which can act as powerful indicators for potential market reversals, retracements, or continuation trades.
1. New Week Opening Gap (NWOG):
Definition:
The New Week Opening Gap (NWOG) refers to the range between the high and low of the first candle in a new trading week (often, the Monday open in most markets).
Purpose:
NWOG serves as a significant reference point for market behavior throughout the week. Price action relative to this range helps traders identify:
Support and Resistance zones.
Bullish or Bearish sentiment depending on price’s relation to the opening gap levels.
Areas where the market may retrace or reverse before continuing in the primary trend.
How NWOG is Identified:
The high and low of the first candle of the new week are drawn on the chart, and these levels are used to assess the market's behavior relative to this range.
Trading Strategy Using NWOG:
Above the NWOG Range: If price is trading above the NWOG levels, it signals bullish sentiment.
Below the NWOG Range: If price is trading below the NWOG levels, it signals bearish sentiment.
Price Touching the NWOG Levels: If price approaches or breaks through the NWOG levels, it can indicate a potential retracement or reversal.
2. Fair Value Gap (FVG):
Definition:
A Fair Value Gap (FVG) occurs when there is a gap or imbalance between two consecutive candlesticks, where the high of one candle is lower than the low of the next candle (or vice versa), creating a zone that may act as a price imbalance.
Purpose:
FVGs represent an imbalance in price action, often indicating that the market moved too quickly and left behind a price region that was not fully traded.
FVGs can serve as areas where price is likely to retrace to fill the gap, as traders seek to correct the imbalance.
How FVG is Identified:
An FVG is detected if:
Bearish FVG: The high of one candle is less than the low of the next (gap up).
Bullish FVG: The low of one candle is greater than the high of the next (gap down).
The area between the gap is drawn as a shaded region, indicating the FVG zone.
Trading Strategy Using FVG:
Price Filling the FVG: Price is likely to retrace to fill the gap. A reversal candle in the FVG zone can indicate a trade setup.
Support and Resistance: FVG zones can act as support (in a bullish FVG) or resistance (in a bearish FVG) if the price retraces to them.
Combined Strategy: New Week Opening Gap (NWOG) and Fair Value Gap (FVG):
The combined use of NWOG and FVG helps traders pinpoint high-probability price action setups where:
The New Week Opening Gap (NWOG) acts as a major reference level for potential support or resistance.
Fair Value Gaps (FVG) represent market imbalances where price might retrace to, filling the gap before continuing its move.
Signal Logic:
Buy Signal:
Price touches or breaks above the NWOG range (indicating a bullish trend) and there is a bullish FVG present (gap indicating a support area).
Price retraces to fill the bullish FVG, offering a potential buy opportunity.
Sell Signal:
Price touches or breaks below the NWOG range (indicating a bearish trend) and there is a bearish FVG present (gap indicating a resistance area).
Price retraces to fill the bearish FVG, offering a potential sell opportunity.
Example:
Buy Setup:
Price breaks above the NWOG resistance level, and a bullish FVG (gap down) appears below. Traders can wait for price to pull back to fill the gap and then take a long position when confirmation occurs.
Sell Setup:
Price breaks below the NWOG support level, and a bearish FVG (gap up) appears above. Traders can wait for price to retrace and fill the gap before entering a short position.
Key Benefits of the Combined NWOG & FVG Indicator:
Combines Two Key Concepts:
NWOG provides context for the market's overall direction based on the start of the week.
FVG highlights areas where price imbalances exist and where price might retrace to, making it easier to spot entry points.
High-Probability Setups:
By combining these two strategies, the indicator helps traders spot high-probability trades based on major market levels (from NWOG) and price inefficiencies (from FVG).
Helps Identify Reversal and Continuation Opportunities:
FVGs act as potential support and resistance zones, and when combined with the context of the NWOG levels, it gives traders clearer guidance on where price might reverse or continue its trend.
Clear Visual Signals:
The indicator can plot the NWOG levels on the chart, and shade the FVG areas, providing a clean and easy-to-read chart with entry signals marked for buy and sell opportunities.
Conclusion:
The New Week Opening Gap (NWOG) and Fair Value Gap (FVG) combined indicator is a powerful tool for traders who use price action strategies. By incorporating the New Week's opening range and identifying gaps in price action, this indicator helps traders identify potential support and resistance zones, pinpoint entry opportunities, and increase the probability of successful trades.
This combined strategy enhances your analysis by adding layers of confirmation for trades based on significant market levels and price imbalances. Let me know if you'd like more details or modifications!

Candle Range Theory | Flux Charts💎 GENERAL OVERVIEW
Introducing our new Candle Range Theory Indicator! This powerful tool offers a strategy built around the Candle Range Theory, which analyzes market movements through the relative size and structure of price candles. For more information about the process, check the "HOW DOES IT WORK" section.
Features of the new Candle Range Theory Indicator :
Implementation of the Candle Range Theory
FVG & Order Block Entry Methods
2 Different TP / SL Methods
Customizable Execution Settings
Customizable Backtesting Dashboard
Alerts for Buy, Sell, TP & SL Signals
📌 HOW DOES IT WORK ?
The Candle Range Theory (CRT) indicator operates by identifying significant price movements through the relative size and structure of candlesticks. A key part of the strategy is determining large candles based on their range compared to the Average True Range (ATR) in a higher timeframe. Once identified, a breakout of either the high wick or the low wick of the large candle is required. This breakout is considered a liquidity grab. After that, the indicator waits for confirmation through Fair Value Gaps (FVGs) or Order Blocks (OBs). The confirmation structure must be the opposite direction of the breakout, for example if the high wick is broken, a bearish FVG is required for the short entry. After a confirmation signal is received, the indicator will trigger entry points based on your chosen entry method (FVG or OB), and exit points will be calculated using either a dynamic ATR-based TP/SL method or fixed percentages. Alerts for Buy, Sell, Take-Proft, and Stop-Loss are available.
🚩 UNIQUENESS
This indicator stands out because it combines two highly effective entry methods: Fair Value Gaps (FVGs) and Order Blocks (OBs). You can choose between these strategies depending on market conditions. Additionally, the dynamic TP/SL system uses the ticker's volatility to automatically calculate stop-loss and take-profit targets. The backtesting dashboard provides metrics about the performance of the indicator. You can use it to tune the settings for best use in the current tiker. The Candle Range Theory approach offers more flexibility compared to traditional indicators, allowing for better customization and control based on your risk tolerance.
⚙️ SETTINGS
1. General Configuration
Higher Timeframe: Customize the higher timeframe for analysis. Recommended combinations include M15 -> H4, H4 -> Daily, Daily -> Weekly, and Weekly -> Monthly.
HTF Candle Size: Define the size of the higher timeframe candles as Big, Normal, or Small to filter valid setups based on their range relative to ATR.
Entry Mode: Choose between FVGs and Order Blocks for your entry triggers.
Require Retracement: Enable this option if you want a retracement to the FVG or OB for entry confirmation.
Show HTF Candle Lines: Toggle to display the higher timeframe candle lines for better visual clarity.
2. Fair Value Gaps
FVG Sensitivity: You may select between Low, Normal, High or Extreme FVG detection sensitivity. This will essentially determine the size of the spotted FVGs, with lower sensitivities resulting in spotting bigger FVGs, and higher sensitivities resulting in spotting all sizes of FVGs.
3. Order Blocks
Swing Length: Swing length is used when finding order block formations. Smaller values will result in finding smaller order blocks.
4. TP / SL
TP / SL Method:
a) Dynamic: The TP / SL zones will be auto-determined by the algorithm based on the Average True Range (ATR) of the current ticker.
b) Fixed : You can adjust the exact TP / SL ratios from the settings below.
Dynamic Risk: The risk you're willing to take if "Dynamic" TP / SL Method is selected. Higher risk usually means a better winrate at the cost of losing more if the strategy fails. This setting is has a crucial effect on the performance of the indicator, as different tickers may have different volatility so the indicator may have increased performance when this setting is correctly adjusted.

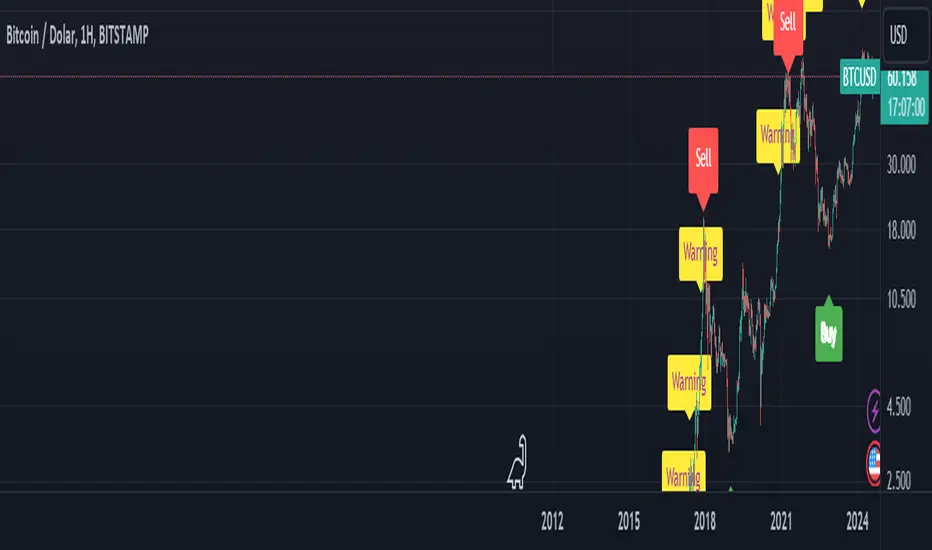
BTC Arcturus IndicatorBTC Arcturus Indicator: This indicator is designed to create buy and sell signals based on the market value of Bitcoin. It also predicts potential market tops with the Pi Cycle Top indicator.
How Does It Work?
1. MVRVZ (Market Value to Realized Value-Z Score) Calculation:
MC: Bitcoin's market cap (Market Cap) is pulled daily from Glassnode data.
MCR: Realized Market Cap of Bitcoin is taken daily from Coinmetrics data.
MVRVZ: It is calculated by dividing the difference between Bitcoin's market value and realized market value by one standard deviation. This value indicates whether the market is overvalued or undervalued.
2. Reception and Warning Signals:
Buy Signal: When MVRVZ falls below the -0.255 threshold value, the indicator gives a "Buy" signal. This indicates that Bitcoin is undervalued and may be a buying opportunity.
Warning Signal: A warning signal turns on when MVRVZ exceeds the threshold value of 2.765. This indicates that the market is approaching saturation and caution is warranted.
3. Tracking the Highest MVRVZ Value:
The indicator records the highest MVRVZ value in the last 10 candlesticks. This value is used to determine whether the market has reached its highest risk levels.
4. Warning Display:
If the MVRVZ value matches the highest value in the last 10 bars and this warning has not been displayed before, a "Warning" signal is displayed.
Once the warning signal is shown, no further warnings are shown for 10 candles.
5. Pi Cycle Top Indicator:
Pi Cycle Top: This indicator predicts Bitcoin tops by comparing two moving averages (350-day and 111-day). If the short-term moving average falls below the long-term moving average, this is considered a sell signal.
The indicator displays this signal with the label "Sell", indicating a potential market top.
User Guide:
Green Buy Signal: It means Bitcoin is cheap and offers a buying opportunity.
Yellow Warning Signal: Indicates that Bitcoin has reached possible profit taking points and caution should be exercised.
Red Sell Signal: Indicates that Bitcoin has reached market saturation and it may be appropriate to sell.
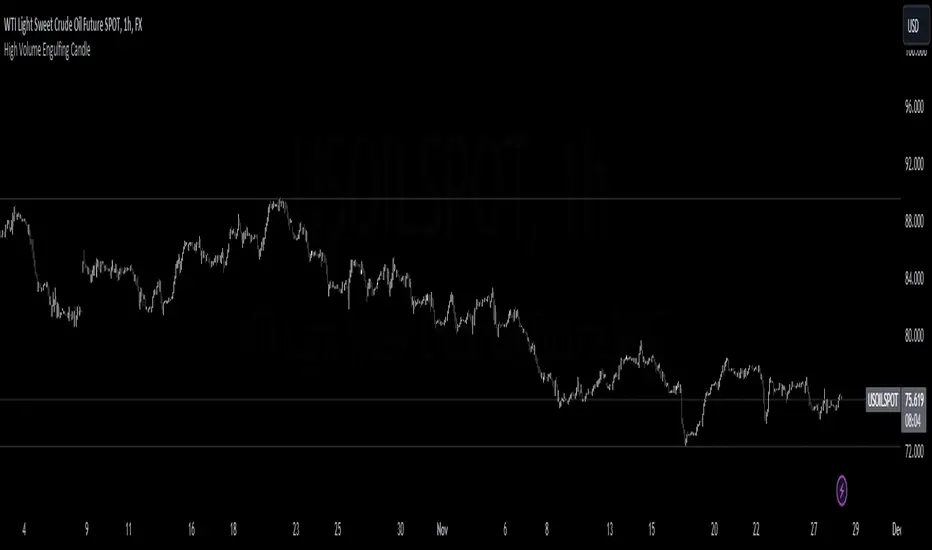
High Volume Engulfing Candle_bullHornThe "High Volume Engulfing Candle" indicator is a technical analysis tool used in trading to identify specific candlestick patterns that suggest potential reversals or significant price movements in a financial instrument. It focuses on two key criteria: the engulfing candlestick pattern and high trading volume. Here's a brief description of the indicator:
Engulfing Candlestick Pattern: The indicator looks for bullish and bearish engulfing candlestick patterns.
Bullish Engulfing: This pattern occurs when the current candlestick completely engulfs the previous one. In other words, the current candlestick's body (the open and close prices) is larger than the previous candlestick's body, and it closes higher than the previous candle's close. It suggests a potential bullish reversal.
Bearish Engulfing: This pattern occurs when the current candlestick's body completely engulfs the previous one, but in the opposite direction. The current candlestick's body is larger than the previous candlestick's body, and it closes lower than the previous candle's close. It suggests a potential bearish reversal.
High Volume Confirmation: In addition to the engulfing pattern, the indicator considers trading volume. It looks for instances where the volume accompanying the engulfing candle is significantly higher than a moving average of the volume. This indicates strong market participation and validates the importance of the engulfing candle pattern.
Arrows on the Chart: When a high volume engulfing candle pattern is detected, the indicator plots arrows on the price chart. A green triangle pointing up is used for bullish engulfing patterns, while a red triangle pointing down is used for bearish engulfing patterns. These arrows help traders quickly identify potential reversal points.
Overall, the "High Volume Engulfing Candle" indicator combines the visual recognition of candlestick patterns with volume analysis to provide traders with potential signals for trend reversals or significant price moves in the market. Traders can use these signals as part of their technical analysis and trading strategies.
Candle GapsWhat This Indicator Does
This indicator shows you where the 'Gaps' are in the market ( as defined by this indicator ). The indicator draws a box that extends indefinitely to the right, this is the 'Gap'. This box will be 'Filled In' when price comes back and overlaps the box.
A Gap As Defined By This Indicator
A candle creates a 'Gap' in the area where there is no price action in front of, or behind ( up to 1 candle ) that area.
A 'Up Gap' is created when the close of a candle is above the high of the previous candle.
A 'Down Gap' is created when the close of a candle is below the low of the previous candle.
Both types of Gaps are coloured with the same colour.
Gaps are 'filled in' and disappear when price action crosses over them.
This indicator does not show gaps where there are no candlesticks.
The Intention Of This Indicator
The intention of this indicator is to make it possible to instantly identify Gaps in the market.
Gaps can be used as a confluence for a variety of different strategies.
Inputs
Gap Colour ( This changes the colour of the Gaps )
Draw Gaps From Wicks ( This changes whether the Gap begins to be drawn from the previous candles high/low, or from the candle the Gap occurs on )
Both inputs are for aesthetic preferences.
A maximum of 50 Gaps will be drawn on the chart at one time.
This indicator is not guaranteed to be 100% accurate.

Scalp Pump-Dump Detector with AlertsThis script displays the percentage of movement of all candles on the chart, as well as identifying abnormal movements to which you can attach alerts. An abnormal movement is considered a rise or fall that exceeds the parameter set in the settings (by default, 1% per 1 bar).
Added a function to display the volume on abnormal candlesticks.

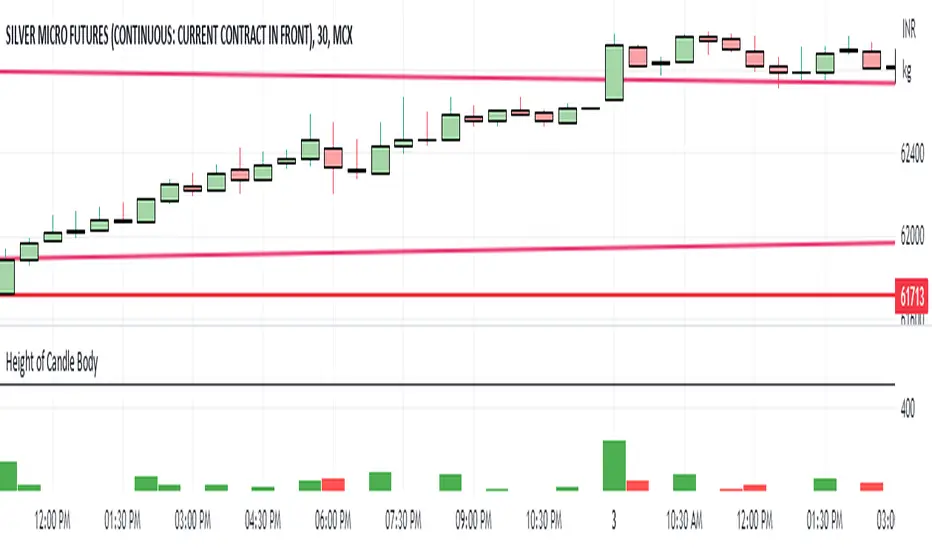
Height of Candle BodyUnderstanding the Height of Candlestick Body
Candlestick charts are a popular method of displaying price data in financial markets. They provide a visual representation of price movements and are used by traders to make informed decisions about buying and selling assets. Understanding the height of a candlestick body is an important aspect of technical analysis and can help traders identify trends and make profitable trades.
The height of a candlestick body is the distance between the opening and closing price of an asset over a given time period. When the closing price is higher than the opening price, the candlestick body is typically colored green or white and is considered bullish. Conversely, when the closing price is lower than the opening price, the candlestick body is typically colored red or black and is considered bearish.
The height of the candlestick body is important because it can provide valuable information about market sentiment. If the candlestick body is relatively small, it suggests that there is indecision in the market and that buyers and sellers are evenly matched. Conversely, if the candlestick body is relatively large, it suggests that there is a significant amount of buying or selling pressure in the market.
Wick Length Dominance IndicatorThis indicator, called the "Wick Momentum Indicator" (WMI), helps to gauge price momentum by comparing the total length of upper and lower wicks of a certain number of candlesticks. The indicator turns green when there is a bullish momentum (total length of lower wicks is greater than that of upper wicks) and turns red when there is a bearish momentum (total length of upper wicks is greater than that of lower wicks).
Price Action CandlesThis simple script provides a visual aid for price action traders by coloring outside & inside candles, which in effect leaves the trader with 6 possible candle colors:
-Regular bullish candle
-Outside bullish candle
-Inside bullish candle
-Regular bearish candle
-Outside bearish candle
-Inside bearish candle
These candlesticks may provide powerful signals when used in conjunction with key levels, market structure and chart patterns.
Make sure to disable the regular candlesticks (body, borders and wicks) in the symbol tab inside the configuration menu!
Hope it can help someone!
3LS | 3 Line Strike Strategy [Kintsugi Trading]What is the 3LS | 3 Line Strike Strategy?
Incorporating the 3 Line Strike candlestick pattern into our strategy was inspired by Arty at The Moving Average and the amazing traders at TheTrdFloor .
The Three Line Strike is a trend continuation candlestick pattern consisting of four candles. Depending on their heights and collocation, a bullish or a bearish trend continuation can be predicted.
In a symphony of trend analysis, price action, and volume we can find and place high-probability trades with the 3LS Strategy.
How to use it!
----- First, start by choosing a Stop-Loss Strategy, Stop PIP Size, and Risk/Reward Ratio -----
- Stop-Loss Strategy
Fixed PIP Size – This uses the top/bottom of the indicator candle and places a TP based on the chosen Risk:Reward ratio.
ATR Trail (No set Target Profit, only uses ATR Stop)
ATR Trail-Stop (Has set Target Profit, however, stop is based on ATR inputs)
**If you choose an ATR Stop-Loss Strategy - input the desired ATR period and Multiple you would like the stop to be calculated at**
**ATR Stop-Loss Strategies have a unique alert setup for Auto-Trading. See Auto-Trading Section**
- Risk/Reward Ratio = If you have a .5 risk/reward, it means you are risking $100 to make $50.
- Additional Stop PIP Size = Number of PIPs over the default stop location of the top or bottom of the indicator candle.
----- Next, we set the Session Filter -----
Set the Timezone and Trade Session you desire. If no specific session is desired, simply set the Trade Session to 00:00 - 00:00.
----- Next, we set the Moving Average Cloud Fill -----
Enter the Fast and Slow Moving Average Length used to calculate trend direction:
MA Period Fast
MA Period Slow
These inputs will determine whether the strategy looks for Long or Short positions.
----- Next, we set the VSA – Volume Spread Analysis Settings -----
Check the box to show the indicator at the bottom of the chart if desired.
This is just a different visual output of the VSA | Volume Spread Analysis indicator available for free under the community indicators tab. You can add that indicator to your chart and see the same output in candle format.
In combination with the Moving Average Cloud, the Volume Spread Analysis will help us determine when to take a trade and in what direction.
The strategy is essentially looking for small reversals going against the overall trend and placing a trade once that reversal ends and the price moves back in the direction of the overall trend.
The 3LS Strategy utilizes confirmation between trend, volume, and price action to place high probability trades.
The VSA is completely customizable by:
Moving Average Length
MA-1 Multiplier
MA-2 Multiplier
MA-3 Multiplier
Check out the VSA | Volume Spread Analysis indicator in the community scripts section under the indicators tab to use this awesome resource on other strategies.
----- Next, we have the option to view the automated KT Bull/Bear Signals -----
Check the boxes to show the buy-sell signal on the chart if desired.
----- Next, we set the risk we want to use if Auto Trading the strategy -----
I always suggest using no more than 1-3% of your total account balance per trade. Remember, if you have multiple strategies triggering per day with each using 1%, the total percent at risk will be much larger.
For Example – if you have 10 strategies each risking 1% your total risk is 10% of your account, not 1%! Be mindful to only use 1-3% of your total account balance across all strategies, not just each individual one.
----- Finally, we backtest our ideas -----
After using the 'Strategy Tester' tab on TradingView to thoroughly backtest your predictions you are ready to take it to the next level - Automated Trading!
This was my whole reason for creating the script. If you work a full-time job, live in a time zone that is hard to trade, or just don't have the patience, this will be a game-changer for you as it was for me.
Auto-Trading
When it comes to auto-trading this strategy I have included two options in the script that utilize the alert messages generated by TradingView.
*Note: Please trade on a demo account until you feel comfortable enough to use real money, and then please stick to 1%-2% of your total account value in risk per trade.*
AutoView
PineConnector
**ATR Auto-Trading Alert Setup**
How to create alerts on 3 Line Strike Strategy
For Trailing Stops:
1) Adjust autoview/pineconnector settings
2) Click "add alert"
3) Select "Condition" = Strategy Name
4) Select "Order Fills Only" from the drop-down
3) Remove template message text from "message" box and place the exact text. '{{strategy.order.alert_message}}'
4) Click "create"
For Fixed Pip Stop:
1) Adjust autoview/pineconnector settings
2) Click "add alert"
3) Select "Condition" = Strategy Name
4) Select "alert() function calls only"
5) I like to title my Alert Name the same thing I named it as an Indicator Template to keep track
Good luck with your trading!

Hammer / Shooting Star ScannerAlways missing hammer and shooting star candlestick pattern?
This script will help you to alert hammer shooting star candlestick.
Please leave your comments for improving this script.

MB-MACD## Description
**MB-MACD** is a custom Pine Script indicator designed to enhance momentum analysis by combining a volume-based "Main Buy Ratio" (MB) calculation with a traditional MACD oscillator. The MB Ratio estimates institutional buying pressure by apportioning volume based on the candle's range and close position, providing a unique proxy for "smart money" flow. This smoothed MB value is then used as the source for MACD computation, allowing for divergence detection between price action, the MB line, and the MACD Histogram.
Key features include:
- **MB Line**: A histogram-style plot showing smoothed buy/sell ratio, colored bullishly (teal) or bearishly (pink) based on direction.
- **MACD Histogram**: Standard MACD applied to the MB source, with optional smoothing.
- **Divergence Detection**: Identifies bullish and bearish divergences on both the MB line and MACD Histogram, with configurable filters for momentum decay and zero-line alignment.
- **Visualization Options**: Display divergence lines and labels in the indicator pane or synced as an overlay on the main chart for better context.
- **Alerts**: Triggers for bullish or bearish divergences to notify users of potential reversal setups.
This indicator is particularly useful for swing traders and momentum followers looking to spot hidden divergences that may signal trend reversals or continuations. It emphasizes risk management by highlighting where price and momentum decouple, but remember: divergences are probabilistic signals and should be confirmed with other tools.
As this is a community-shared script, I encourage users to test it thoroughly and provide feedback. If you spot any bugs, calculation errors, or improvements (e.g., edge cases with low-volume symbols or performance issues on certain timeframes), please comment below or reach out—your input helps refine it for everyone!
## User Manual
### Introduction
The **MB-MACD** indicator integrates volume analysis with MACD to detect divergences in price and momentum. The core innovation is the "Main Buy Ratio" (MB), which approximates buying vs. selling volume within each bar based on its range and close position. This MB value is smoothed and fed into a MACD calculation, enabling divergence scans on both the MB line and the resulting MACD Histogram.
Divergences occur when price makes higher highs/lower lows, but the oscillator (MB or Histogram) fails to confirm—often signaling potential reversals. The script offers flexible display options, filters to reduce false positives, and alerts for real-time notifications.
**Important Notes:**
- This is not financial advice; use it for educational purposes and backtest on your symbols/timeframes.
- Works best on liquid stocks or indices with reliable volume data (e.g., daily or higher timeframes).
- Performance may vary on low-volume assets or during after-hours trading.
- If you encounter issues (e.g., no divergences detected or rendering errors), check your chart settings and report them in the comments for community debugging.
### Inputs Explanation
The inputs are grouped for ease of configuration. Adjust them via the indicator's settings panel in TradingView.
#### Core Parameters
- **Show MB Line** (Default: True): Enables/disables the MB Ratio histogram plot.
- **Show MACD Histogram** (Default: True): Enables/disables the MACD line and histogram plots.
- **MB Smoothing (SMA)** (Default: 10, Min: 1): Length for smoothing the raw MB Ratio using a Simple Moving Average (SMA). Higher values reduce noise but may lag.
- **Pivot Lookback Length** (Default: 5, Min: 2): Bars to look back/forward for detecting price pivots (highs/lows) used in divergence logic.
- **Max Lines Kept** (Default: 100, Min: 10): Limits the number of divergence lines/labels to prevent chart clutter.
#### Display Settings
- **Show Lines (Indicator Pane)** (Default: True): Draws divergence lines on the MB line in the indicator pane.
- **Show Labels (Indicator Pane)** (Default: True): Adds labels (e.g., "L" for line divergence) at divergence points in the pane.
- **Show Hist Divergence Lines** (Default: True): Draws dashed lines for MACD Histogram divergences in the pane.
- **Show Hist Divergence Labels** (Default: True): Adds labels (e.g., "H" for histogram divergence) in the pane.
- **Sync Lines to Main Chart (Overlay)** (Default: True): Mirrors divergence lines and labels onto the main price chart for context (slightly offset for visibility).
#### Filters & Tolerance
- **Peak Alignment Tolerance (Bars)** (Default: 5, Min: 0): Allows flexibility in matching oscillator peaks/valleys to price pivots (e.g., within ±5 bars).
- **Max Divergence Distance (Bars)** (Default: 20, Min: 5): Maximum bars between two pivots for a valid divergence; prevents detecting overly distant signals.
- **Enable Momentum Decay Filter** (Default: True): For Histogram divergences, requires the current peak/valley to have a smaller absolute value than the previous (indicating convergence/decay).
- **Enable Zero-Side Filter** (Default: False): Ensures both peaks/valleys in a divergence are on the same side of the zero line (e.g., both positive or both negative).
#### MACD Settings
- **MACD Fast Length** (Default: 12): Fast EMA length for MACD.
- **MACD Slow Length** (Default: 26): Slow EMA length for MACD.
- **MACD Signal Length** (Default: 9): Smoothing length for the MACD signal line.
- **MACD Source Smoothing** (Default: 3, Min: 1): Additional SMA smoothing applied to the MB Ratio before MACD calculation.
### How It Works
1. **MB Ratio Calculation**: For each bar, the script computes the position of the close within the high-low range (0-1). This scales the volume into "buy" and "sell" portions, then derives a net ratio (-100% to +100%). It's smoothed via SMA for the final MB line.
2. **MACD Application**: The (optionally smoothed) raw MB is used as the MACD source, producing a MACD line, signal line, and histogram.
3. **Pivot Detection**: Uses Pine's `ta.pivothigh`/`ta.pivotlow` to find price highs/lows over the lookback period.
4. **Divergence Scanning**:
- **Bearish (on Highs)**: Price makes a higher high, but MB/Hist makes a lower high.
- **Bullish (on Lows)**: Price makes a lower low, but MB/Hist makes a higher low (closer to zero).
- Scans nearby bars for oscillator matches and applies filters.
5. **Rendering**: Lines/labels are drawn in the indicator pane or overlaid on the chart. Colors: Teal for bullish, Pink/Maroon for bearish.
6. **Cleanup**: Automatically removes old lines/labels to stay under the max limit.
### Interpreting the Outputs
- **MB Line (Columns)**: Positive (teal) indicates net buying pressure; negative (pink) shows selling. Watch for crossovers above/below zero as momentum shifts.
- **MACD Histogram (Area)**: Green/teal for positive momentum; red/maroon for negative. Widening bars suggest strengthening trends; narrowing indicates weakening.
- **Divergence Lines/Labels**:
- Solid lines: MB line divergences (thicker, labeled "L").
- Dashed lines: Histogram divergences (thinner, labeled "H").
- Bullish: Teal lines sloping up (potential bottom reversal).
- Bearish: Pink lines sloping down (potential top reversal).
- **Overlay on Chart**: Lines connect price pivots (or offset slightly for Histogram). Use this to visualize how divergences align with candlesticks.
- **Zero Line**: Gray horizontal line; divergences filtered by side if enabled.
**Example Usage**:
- On a daily stock chart, enable overlays and watch for a bullish "L" or "H" label near a price low—could signal a buy if confirmed by volume breakout.
- In a downtrend, bearish divergences on highs might warn of further downside.
### Alerts
- **Bullish Divergence (L or H)**: Triggers on any detected bullish divergence (MB or Histogram).
- **Bearish Divergence (L or H)**: Triggers on bearish divergences.
- Set up via TradingView's alert menu: Select the indicator, choose the condition, and customize the message (e.g., includes ticker).
### Troubleshooting / Known Issues
- **No Divergences Shown**: Increase "Peak Alignment Tolerance" or reduce filters. Ensure pivot length suits your timeframe (shorter for intraday).
- **Too Many Lines/Labels**: Lower "Max Lines Kept" or increase "Max Divergence Distance" to filter distant signals.
- **Performance on Low-Volume Symbols**: MB Ratio may be unreliable; test on high-volume assets first.
- **Rendering Errors**: If lines don't appear, check chart zoom or ensure "force_overlay=true" isn't conflicting with other indicators.
- **NaN/Undefined Values**: Rare on live data but possible in historical backtests; report with symbol/timeframe for fixes.
### Feedback and Contributions
This script is open for community improvement! If you find bugs (e.g., false positives in divergences, calculation edge cases, or UI glitches), or have suggestions (like additional filters or visualizations), please share in the comments. Your feedback helps make it better—let's debug and enhance it together!

Lord Mathew ATSThe Smart Money Structure & Pattern Analyzer is a complete, all-in-one visual trading system that brings together every essential element of Smart Money Concepts (SMC), ICT methodology, and candlestick psychology into one powerful indicator.
It is designed to help traders instantly understand the market’s structure, liquidity flow, and potential turning points without switching tools or manually marking charts. Whether you trade forex, indices, crypto, or commodities, this indicator automatically identifies where institutional activity, imbalances, and price inefficiencies occur in real time.
With its advanced algorithm, it plots market structure shifts, equal highs and lows, liquidity zones, order blocks, fair value gaps (FVGs), and previous week and day levels (PWO, PWH, PWL, PWC, PDO, PDH, PDL, PDO). It also integrates a deep candlestick recognition engine that detects over ten classic and advanced candle formations including engulfing patterns, dojis, hammers, shooting stars, morning/evening stars, and spinning tops to provide precise confirmation at critical points of interest.
This indicator isn’t just a tool it’s a complete market map that helps traders visualize how institutional order flow and candlestick sentiment interact.
Core Features
📊 Market Structure Detection:
Automatically marks swing highs/lows, Break of Structure (BOS), and Change of Character (CHOCH) in real time.
💧 Liquidity Mapping:
Highlights equal highs/lows and liquidity grabs, showing where price is likely to target before a reversal or continuation.
🧱 Order Block Visualization:
Displays the last bullish or bearish candle before an impulsive displacement, acting as a potential institutional entry zone.
⚡ Fair Value Gap (FVG) Scanner:
Detects and highlights imbalances where price moved too fast, helping you identify high-probability retracement areas.
🕯️ Candlestick Pattern Recognition:
Recognizes key reversal and continuation patterns (engulfing, hammer, shooting star, doji, morning/evening star, etc.) in real time.
📅 Institutional Reference Points:
Plots previous week & day open (PWO, PDO), previous week & day high (PWH, PWH), previous week & day low (PWL, PDL), previous week & day close (PWC, PDC) and optionally previous day levels to help frame bias.
🎨 Customizable Design:
Toggle any feature, change colors, and set alerts when multiple Smart Money signals align for cleaner, faster decision-making.
How It Works
Add the indicator to your chart on any timeframe or market.
The algorithm automatically detects structure, liquidity, and imbalance zones.
Candlestick patterns are highlighted when they form near high-probability areas (like OBs or FVGs).
When confluence occurs such as a liquidity grab, FVG fill, and bullish engulfing candle—the indicator provides a visual signal zone for your confirmation-based entries.
You can refine your trades using higher-timeframe bias (HTF order flow) and lower-timeframe execution (LTF confirmation).
Best For
Traders using ICT, Smart Money Concepts, or price-action systems.
Intraday and swing traders looking for clear, data-driven chart structure.
Traders who want to simplify confluence analysis and focus on precision execution.
Why It Stands Out
Unlike standard candlestick or pattern scanners, this indicator merges institutional market logic with technical candle behavior, allowing traders to see where smart money might be entering or exiting positions.
It’s not about random signals it’s about context, structure, and confirmation.
Every feature in this indicator is built around the principle of liquidity engineering:
price creates liquidity, grabs it, and moves toward imbalance or order flow efficiency.
By merging that institutional logic with candlestick patterns, this tool gives traders an edge in recognizing not only where to trade but why price is reacting in that exact area.
Disclaimer
This indicator is intended for educational and analytical use. It does not provide financial advice or guaranteed trading results. Always backtest and manage your risk responsibly.

Level Founder indicatorQuesto strumento, ideato per l'individuazione dei livelli orizzontali sensibili si prepone l'obiettivo di semplificare la lettura tecnica dei grafici. Alla base di questo indicatore c'è il concetto di volatilità, inteso come scontro tra domanda ed offerta, come escursione delle forze nel campo di battaglia fino alla determinazione del prezzo finale di ogni candela. Di fatto, andando a cogliere quella che è la volatilità candela per candela, l'indicatore la calcola in termini assoluti rendendola un numericamente comparabile, in un range tra 0 e 100. Quando questo valore tocca i 100 si genera un picco di volatilità, il quale va ad identificare un punto di attenzione sul grafico di uno strumento. In corrispondenza di questi picchi si osserva dove la battaglia tra compratori e venditori si è conclusa, ovvero dove domanda ed offerta si sono incontrati per definire un prezzo: la chiusura di candela. In corrispondenza di tale prezzo si ha, quindi, un accordo certo tra domanda ed offerta dopo un periodo di contrattazione volatile, andando a certificare quello che è un livello di prezzo "sudato" per un determinato sottostante. Tale soglia si traduce in un livello orizzontale sensibile, che in futuro (avendo il mercato memoria degli scontri passati) potrà comportarsi da supporto o da resistenza, a seconda della situazione. In breve quindi, si traccia una linea orizzontale in corrispondenza delle chiusure di candela che condividono un picco sull'indicatore "Level Founder Indicator". Funziona su ogni time-frame e sottostante.
N.B. A ridosso di questi livelli si possono cercare pattern per l'operatività oppure cercare delle rotture di questi livelli per delle conferme/inversioni, spaziando dal trading intraday all'investimento di lungo periodo.
ENGLISH VERSION:
This tool, designed to identify sensitive horizontal levels, aims to simplify the technical reading of charts. This indicator is based on the concept of volatility, understood as the clash between supply and demand, the oscillation of forces on the battlefield until the final price of each candlestick is determined. By capturing the volatility candlestick by candlestick, the indicator calculates it in absolute terms, making it numerically comparable, within a range between 0 and 100. When this value reaches 100, a volatility spike is generated, which identifies a point of focus on an instrument's chart. At these peaks, we observe where the battle between buyers and sellers has concluded, that is, where supply and demand have met to define a price: the candlestick's close. At this price, therefore, a definite agreement between supply and demand occurs after a period of volatile trading, certifying what is a "hard-earned" price level for a given underlying asset. This threshold translates into a sensitive horizontal level, which in the future (given the market's memory of past clashes) could act as support or resistance, depending on the situation. In short, a horizontal line is drawn at the candlestick closes that share a peak on the "Level Founder Indicator." It works on any timeframe and underlying asset.
N.B.: Near these levels, you can look for trading patterns or look for breakouts of these levels for confirmations/reversals, ranging from intraday trading to long-term investing.
Canuck Trading IndicatorOverview
The Canuck Trading Indicator is a versatile, overlay-based technical analysis tool designed to assist traders in identifying potential trading opportunities across various timeframes and market conditions. By combining multiple technical indicators—such as RSI, Bollinger Bands, EMAs, VWAP, MACD, Stochastic RSI, ADX, HMA, and candlestick patterns—the indicator provides clear visual signals for bullish and bearish entries, breakouts, long-term trends, and options strategies like cash-secured puts, straddles/strangles, iron condors, and short squeezes. It also incorporates 20-day and 200-day SMAs to detect Golden/Death Crosses and price positioning relative to these moving averages. A dynamic table displays key metrics, and customizable alerts help traders stay informed of market conditions.
Key Features
Multi-Timeframe Adaptability: Automatically adjusts parameters (e.g., ATR multiplier, ADX period, HMA length) based on the chart's timeframe (minute, hourly, daily, weekly, monthly) for optimal performance.
Comprehensive Signal Generation: Identifies short-term entries, breakouts, long-term bullish trends, and options strategies using a combination of momentum, trend, volatility, and candlestick patterns.
Candlestick Pattern Detection: Recognizes bullish/bearish engulfing, hammer, shooting star, doji, and strong candles for precise entry/exit signals.
Moving Average Analysis: Plots 20-day and 200-day SMAs, detects Golden/Death Crosses, and evaluates price position relative to these averages.
Dynamic Table: Displays real-time metrics, including zone status (bullish, bearish, neutral), RSI, MACD, Stochastic RSI, short/long-term trends, candlestick patterns, ADX, ROC, VWAP slope, and MA positioning.
Customizable Alerts: Over 20 alert conditions for entries, exits, overbought/oversold warnings, and MA crosses, with actionable messages including ticker, price, and suggested strategies.
Visual Clarity: Uses distinct shapes, colors, and sizes to plot signals (e.g., green triangles for bullish entries, red triangles for bearish entries) and overlays key levels like EMA, VWAP, Bollinger Bands, support/resistance, and HMA.
Options Strategy Signals: Suggests opportunities for selling cash-secured puts, straddles/strangles, iron condors, and capitalizing on short squeezes.
How to Use
Add to Chart: Apply the indicator to any TradingView chart by selecting "Canuck Trading Indicator" from the Pine Script library.
Interpret Signals:
Bullish Signals: Green triangles (short-term entry), lime diamonds (breakout), blue circles (long-term entry).
Bearish Signals: Red triangles (short-term entry), maroon diamonds (breakout).
Options Strategies: Purple squares (cash-secured puts), yellow circles (straddles/strangles), orange crosses (iron condors), white arrows (short squeezes).
Exits: X-cross shapes in corresponding colors indicate exit signals.
Monitor: Gray circles suggest holding cash or monitoring for setups.
Review Table: Check the top-right table for real-time metrics, including zone status, RSI, MACD, trends, and MA positioning.
Set Alerts: Configure alerts for specific signals (e.g., "Short-Term Bullish Entry" or "Golden Cross") to receive notifications via TradingView.
Adjust Inputs: Customize input parameters (e.g., RSI period, EMA length, ATR period) to suit your trading style or market conditions.
Input Parameters
The indicator offers a wide range of customizable inputs to fine-tune its behavior:
RSI Period (default: 14): Length for RSI calculation.
RSI Bullish Low/High (default: 35/70): RSI thresholds for bullish signals.
RSI Bearish High (default: 65): RSI threshold for bearish signals.
EMA Period (default: 15): Main EMA length (15 for day trading, 50 for swing).
Short/Long EMA Length (default: 3/20): For momentum oscillator.
T3 Smoothing Length (default: 5): Smooths momentum signals.
Long-Term EMA/RSI Length (default: 20/15): For long-term trend analysis.
Support/Resistance Lookback (default: 5): Periods for support/resistance levels.
MACD Fast/Slow/Signal (default: 12/26/9): MACD parameters.
Bollinger Bands Period/StdDev (default: 15/2): BB settings.
Stochastic RSI Period/Smoothing (default: 14/3/3): Stochastic RSI settings.
Uptrend/Short-Term/Long-Term Lookback (default: 2/2/5): Candles for trend detection.
ATR Period (default: 14): For volatility and price targets.
VWAP Sensitivity (default: 0.1%): Threshold for VWAP-based signals.
Volume Oscillator Period (default: 14): For volume surge detection.
Pattern Detection Threshold (default: 0.3%): Sensitivity for candlestick patterns.
ROC Period (default: 3): Rate of change for momentum.
VWAP Slope Period (default: 5): For VWAP trend analysis.
TradingView Publishing Compliance
Originality: The Canuck Trading Indicator is an original script, combining multiple technical indicators and custom logic to provide unique trading signals. It does not replicate existing public scripts.
No Guaranteed Profits: This indicator is a tool for technical analysis and does not guarantee profits. Trading involves risks, and users should conduct their own research and risk management.
Clear Instructions: The description and usage guide are detailed and accessible, ensuring users understand how to apply the indicator effectively.
No External Dependencies: The script uses only built-in Pine Script functions (e.g., ta.rsi, ta.ema, ta.vwap) and requires no external libraries or data sources.
Performance: The script is optimized for performance, using efficient calculations and adaptive parameters to minimize lag on various timeframes.
Visual Clarity: Signals are plotted with distinct shapes and colors, and the table provides a concise summary of market conditions, enhancing usability.
Limitations and Risks
Market Conditions: The indicator may generate false signals in choppy or low-liquidity markets. Always confirm signals with additional analysis.
Timeframe Sensitivity: Performance varies by timeframe; test settings on your preferred chart (e.g., 5-minute for day trading, daily for swing trading).
Risk Management: Use stop-losses and position sizing to manage risk, as suggested in alert messages (e.g., "Stop -20%").
Options Trading: Options strategies (e.g., straddles, iron condors) carry unique risks; consult a financial advisor before trading.
Feedback and Support
For questions, suggestions, or bug reports, please leave a comment on the TradingView script page or contact the author via TradingView. Your feedback helps improve the indicator for the community.
Disclaimer
The Canuck Trading Indicator is provided for educational and informational purposes only. It is not financial advice. Trading involves significant risks, and past performance is not indicative of future results. Always perform your own due diligence and consult a qualified financial advisor before making trading decisions.
