Delta Volume Columns [LucF]Displays delta volume columns using intrabar volume information. Each volume column is divided into three sections: buying, selling and neutral volume. Volume for each section is determined from the volume and price movement of each intrabar at a user-selected lower resolution.
Features include:
- Choice of color themes for either dark or light chart backgrounds
- Delta volume columns
- Volume Balance displayed as the difference between the MAs of buying and selling volume
- Display of divergences between a bar’s volume balance and the bar’s price movement (example: buying volume > selling volume but close < open). Divergences can be shown in 2 different color schemes (including green/red showing a tentative direction), on volume columns and/or on chart bars
- Display of bar by bar volume balance with highlighting of above average volume
- Display of the usual total volume MA
- Choice of the lower resolution used to retrieve intrabar information
- Alerts configurable on any combination of the markers, with control over long/short direction
- Choice of 3 different markers:
1. Double bumps: two consecutive bars where buying or selling volume is in the same direction and where volume > volume MA
2. Divergence confirmations: direction of the price bar following a price/volume balance divergence
3. Volume balance shifts: zero level crossings of the volume balance MA delta
The chart shows the two main modes of display:
- Top pane : shows the stacked volume columns with divergences in orange and the flattened volume balance MAs delta at the bottom of the volume columns. This volume balance is the same shown in the bottom pane. The top pane also shows the instant volume balance strip above the volume columns. The strip’s colors show which of the buying or selling volume was greater, and colors are brighter if the total volume was above the total volume MA.
- Bottom pane : shows the volume balance MAs delta with markers 1 and 2. Given that this graphic has no price momentum component, I find quite eerie how it often looks like a momentum-based signal.
The default 5 minute intrabar resolution is used in combination with the weekly chart, which is excessive.
This script uses a special characteristic of the security() function’s behavior when it is sent to a resolution lower than the chart’s resolution. Details are given in the script’s comments. This method has the advantage of working under more circumstances than some of the other loop-based methods, but it also has its limits.
IMPORTANT
This is what you need to know:
- The method used does not work on the realtime bar—only on historical bars. Consequently, the volume column shown on the realtime bar is a normal volume column plotted in green or red, following price movement. The column will only show delta volume information after it closes and becomes a historical bar.
- The indicator only works on some chart resolutions: 5, 10, 15 and 30 minutes, 1, 2, 4, 6, and 12 hours, 1 day, 1 week and 1 month. The script’s code can be modified to run on other resolutions, but chart resolutions must be divisible by the lower resolution used for intrabars.
- Intrabar resolutions can be selected from 1, 5, 15, 30, 45 minutes, 1, 2, 3, 4 hours, 1 day, 1 week and 1 month. The intrabar resolution must of course be smaller than the chart’s resolution.
- Contrary to my other indicators where alerts must be configured to trigger “Once Per Bar Close” in order to avoid false triggers (or repainting), all this indicator’s alerts are designed to trigger using previous bar information since the indicator’s calculations in the realtime bar are not exact. Markers are not plotted with a negative offset; they appear at the beginning of the realtime bar following confirmation of the marker’s condition on the previous bar. Alerts for this indicator should thus be configured to trigger “Once Per Bar” so they trigger at the beginning of the realtime bar. Note that the penalty is not that great, as it is simply the instant between the close of the previous realtime bar and the opening of the next. The advantage of using this technique is that the indicator does not repaint; a marker that appears at the beginning of the realtime bar will never disappear.
- The script only plots information that is reliable in the realtime bar, i.e., total volume and markers. All other plots are set to n/a to prevent misleading traders.
- When the difference between the chart’s resolution and the lower resolution is too important, volume columns will not calculate for all bars in the dataset.
On Delta Volume
Buying or selling volume are misnomers, as every unit of volume transacted is both bought and sold by 2 different traders. There is no such thing as “buy only” or “sell only” volume, but trader lingo is riddled with original fabulations.
Without access to order book information, traders work with the assumption that when price moves up during a bar, there was more buying pressure than selling pressure. The built-in volume indicator available on TradingView uses this logic to color the volume columns green or red. While this script’s numbers are more precise because it analyses a number of intrabars to calculate its information, it uses the exact same imperfect logic to calculate its buying/selling/neutral sections.
Until Pine scripts can have access to how much volume was transacted at the bid/ask prices, our so-called buying/selling volume information will always be a mere proxy.
Divergences
You may wonder how there can be divergences between buying/selling volume information and price movement. This will sometimes be due to the methodology’s shortcomings we have just discussed, but divergences may also occur in instances where because of order book structure, it takes less volume to increase the price of an asset than it takes to decrease it.
As usual, divergences are points of interest because they reveal imbalances, which may or may not become turning points. I do not share the overwhelming enthusiasm traders have for divergences. To your pattern-hungry brain, the orange bars this indicator shows on chart will—as divergences on other indicators do–appear to often indicate turnarounds. My opinion is that reality is generally quite sobering, as many who have tried building automated rules based on divergences will tell you. I do not have hard numbers on the lack of performance of divergences—only many failed attempts to make them perform, which a few experienced strategy modelers I know share with me. Please don’t try to read too much into them. While they look great on past data, I find they are often difficult to use in realtime to make bets with good odds.
Thanks to:
- A guy called Kuan who commented on a Backtest Rookies presentation of an intrabar delta volume indicator using a for loop. The heart of “my” indicator is code borrowed from Kuan; I just built a hopefully useful wrapper around it.
- @theheirophant, my partner in the exploration of the sometimes weird abysses of security() ’s behavior at lower resolutions.
Pesquisar nos scripts por "Buy sell"

Consensio With SignalsUsing the ideas from "Consensio" system, by Tyler Jenks, this Indicator shows a Buy and sell values, with 3 levels
using the position order of 3 smas: short, medium and large
There are 3 combinations indicating buy and 3 indicating sell:
Example: LSM (Long SMA Top, Then Short, Then Medium)
3 levels each. More level more power signal for buy or sell
MLS = Sell Level 1
LSM = Sell Level 2
LMS = Sell Level 3
SLM = Buy Level 1
SML = Buy Level 3
MSL = Buy Level 2
The triangles on top of the indicator shows any cross of the 3 SMAs and the level of buy/sell signal of the combination

Consensio HystogramUsing the ideas from "Consensio" system, by Tyler Jenks, this Indicator shows a Buy and sell values, with 3 levels
using the position order of 3 smas: short, medium and large
There are 3 combinations indicating buy and 3 indicating sell:
Example: LSM (Long SMA Top, Then Short, Then Medium)
3 levels each. More level more power signal for buy or sell
MLS = Sell Level 1
LSM = Sell Level 2
LMS = Sell Level 3
SLM = Buy Level 1
SML = Buy Level 3
MSL = Buy Level 2
The triangles on top of the indicator shows any cross of the 3 SMAs and the level of buy/sell signal of the combination
The hystogram shows a composed value, using the distance of each SMA to the close price of each bar and te result is
multiplied by the actual combination order of the SMAs, positive values for Buy, negative for shell, using values from 1 to 3
The longer the SMA period, more weight has in the result value.
(These factors are editables)
My defaults:
50% using Long SMA
35% Using Medium SMA
15% Using Short SMA
Let me know if you encounter this as useful as me.
Nakitxu

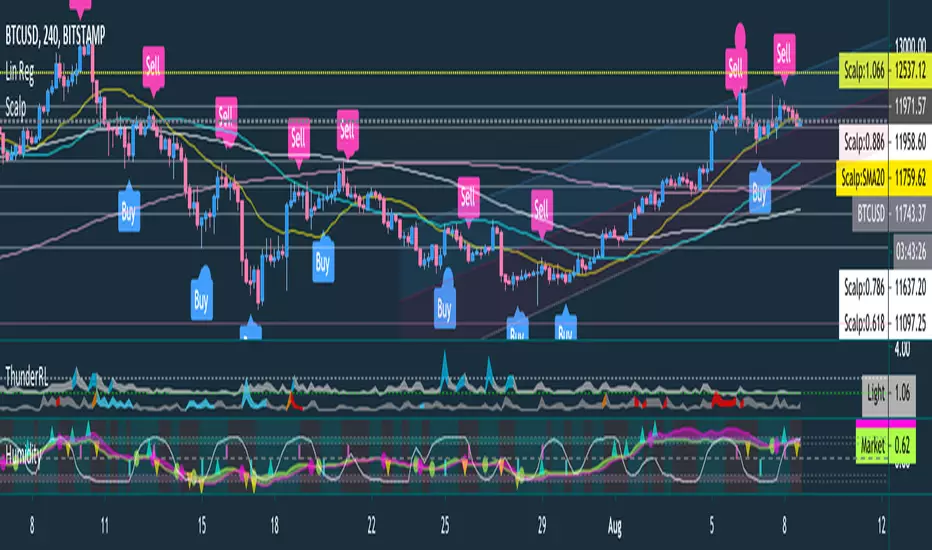
Buy and Sell scanner by ThunderTraderHumidity contains indicators:
Stocashtic RSI : is provided as background color, where the green is uptrend and the orange is downtrend
Buy/Sell Pole : the red line from top is signal for sell and green line from bottom is signal for buy
Humidity Ribbon : is price trend ribbon, if the ribbon touch or cross-down the bottom area (the red zone), means accumulation is started and best area to buy, but when ribbon touch cross up the top area (blue zone), means the uptrend is very strong. Ribbon cross down from top area can be used as breakout to sell and also ribbon cross up from bottom area can be used as breakout to buy.
Market Wave : is market circulation where 1 top and 1 bottom are equal to 1 circulation, if 1 circulation is ended then it will be best position to buy or if line touches the bottom, it can be used to buy and vice versa
Goldclay movement (TF H1) for Trading Gold(XAUUSD)I test this scripts in Gold , mainly I use in Timeframe 15 min
( I try to use with other pairs , It is Ok after I finish test more parameter will post again)
This script will alarm when buy and exit buy , sell and exit sell.
Background :
Dark Green : Buy
Dark Red : Sell
Pink : may sell but not recommend or must use small lot size
Green : may buy but not recommend or must use small lot size
Blue : Interest zone for movement but not confirm buy or sell.
For position sizing I use Stoploss from Daily ATR with %Risk as shown.
you must try many parameter in TP SL %Risk ,....
But I think default value is Ok.
Chaikin MF% (CMFP) w. Alerts, Bells & Whistles [LucF]This is Chaikin’s Money Flow indicator on a 0-100 scale with buy/sell signals, alerts and other bells & whistles.
It includes:
- a fast EMA (16 periods by default),
- a slow MA (64 periods by default),
- histograms,
- 3 different sorts of crosses,
- big swings identification,
- buy/sell signals on CMFP crossing back from outside user-defined levels,
- buy/sell signals on the slow MA pivots above/below user-defined levels,
- alerts on big swings and buy/sells.
This indicator started with @LazyBear code (VAPI) at:
@cI8DH then changed the scale to 0-100, which I find very useful:
I then added the rest.
The chart above shows both clean and busy versions of the indicator.
Note that the default length is 10 rather than the commonly used 20. I use CMFP in conjunction with VFI and like the fact that it is faster than VFI. The default inputs show the way I normally use this indicator, with the slow MA shown in histogram mode. I find it gives good context to the signal line. Crosses between the two are often useful.
The buy/sell signals aren’t the main attraction of this indicator, and nothing to write home about. Like the big swing markers, I think it’s more realistic to view them as pointers to potentially interesting areas on charts. Their nature makes them more suited to identifying reversals. They certainly aren’t reliable enough to turn this study into a strategy and I normally don’t use them. The levels pre-defined for the buy/sell signals on CMFP are most useful on short intervals. The buy/sell signals on the slow MA pivots work on a more complete range of intervals. Optimization for your specific instruments and intervals will improve their reliability.
As usual when defining alerts, be sure you already have defined proper inputs and that you are on the intended interval, as they will be used when triggering alerts.

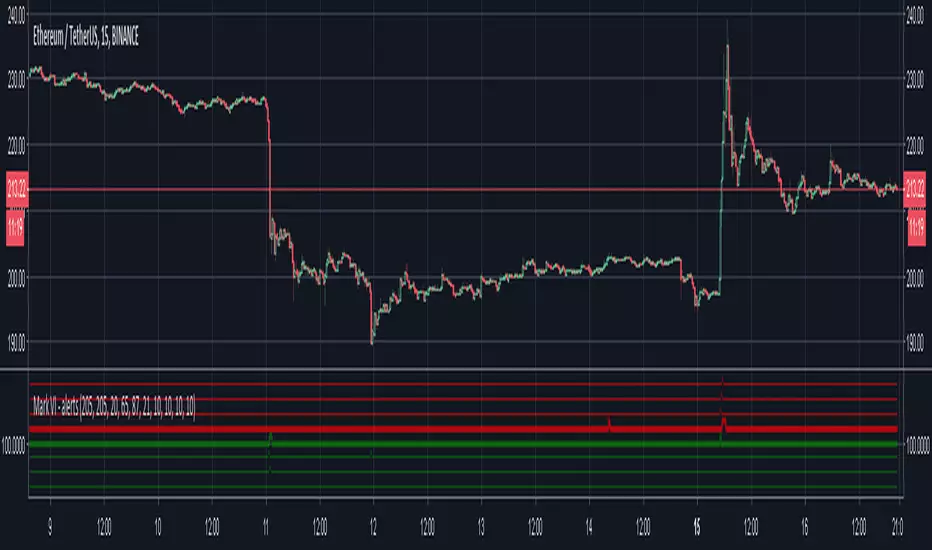
Mark IX - alertsUse only on ETH/USD(T) 15 minute candles
-Small green spikes = partial buys
-Large green spikes = 100% buys
-Small red spikes = partial sells
-Large red spikes = 100% sells
When looking at where the spikes occur, they happen based on current price, so you won't know exactly where it would have bought/sold until you run it live. The alerts happen on every tick, not on candle-close so they often buy/sell at far better prices than where the candle closed.
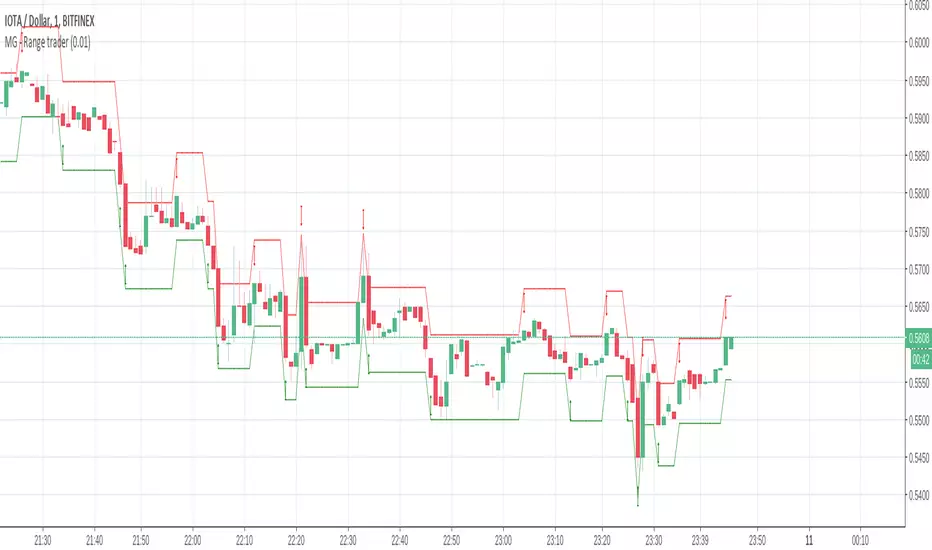
MG - Range trader - 1.0This one is a bit of an experiment..
The theory is, if you have an asset that you firmly believe will rise in the future for fundamental reasons and are happy to hold until that happens i.e. a be a position trader, you can take advantage of market volatility at the same time in a relatively safe way, so theoretically, you profit when the price goes up or down
E.g. You have $1000, an asset in which you want to become a position trader and you are happy to either make more money or more of the asset as you believe that will make you more money in the future, you could wait until a decent retracement, maybe around a good support level, then buy $500 of the asset and simply sell if it goes up by X, buy if it goes down by X. If you keep doing this, you will end up with either with more of the asset or more money. You have a sure gain either way (if you are happy to have either money or asset)
There are some considerations:
The higher the trade size, the faster profit compounds and the faster you exhaust your available buys and sells
- E.g. If asset is $100, you have $500 and you plan to buy / sell every $10 change, if the asset drops straight to $40, your last buy will be at $50, at which point, the asset is still dropping. But it you only plan to buy / sell $5 every $10 price, you will be able to buy right down to 0.
In times of strong trend, it may be better to avoid this approach altogether as there may not be so much oscillation or at least to use a small if not minimum order size.
Application:
The buy and sell triggers can be connected using autoview to convert this indicator into a range trading bot
oenbot BB Buying OpportunitiesThis is my first attempt to emulate the eonbot BB strategy (github.com).
Definitely a beta version, need to work out why false positives, and stop buy/sells after previous buy/sell.
In the wiki page example of eonbot it refers to 75%, in this script enter the converse ... 25% and it should plot accurately.
If you are not familiar with eonbot check out the wiki & github sites : github.com
credits to: www.tradingview.com for the trending components

AutoTrader v2 by CryptoProToolsAutoTrader v2 comes with the ability to heavily customize / fine tune your Buying and Selling strategies separately.
Want to factor in RSI, LOWBB and EMAGAIN for Buys, but then only use MFI and EMA Channels for Sells?
THIS CAN DO THAT!
Choose from the following to create your ideal strategy :
- HIGH BB / LOW BB
- EMAGAIN
- RSI (Relative Strength Index)
- MFI (Money Flow)
- EMA Channels
------------------------------------
CryptoProTools Members Only
-----------------------------------
Hit me up to learn more about becoming a member.
SMMA Analyses - Buy / Sell signals and close position signals This script combines the usage of the SMMA indicator in order to provide signals for opening and closing trades, either buy or sell signals.
It uses two SMMA , a fast and a slow one, both configurable by the users.
The trigger of Buy and Sell Signals are calculated through the SMMA crosses:
Buy Signals : The fast SMMA crosses over the slow SMMA . They are highlighting by a green area and a "B" label.
Sell Signals : The fast SMMA crosses under the slow SMMA . They are highlighting by a red area and a "S" label
The trigger of Close Buy and Close Sell Signals are calculated through the close price crosses with the fast SMMA:
Close Buy Signals : The fast SMMA crosses under the close price and at the same time the trend is bullish , so the fast SMMA is greater than the slow SMMA . They are highlighted by a lighter green area
Close Sell Signals : The fast SMMA crosses over the close price and at the same time the trend is bearish , so the fast SMMA is lower than the slow SMMA . They are highlighted by a lighter red area
Few important points about the indicator and the produced signals :
This is not intended to be a strategy, but an indicator for analyzing the SMMA conditions. It gives you the triggers depending on the real time analysis of the SMMA and prices, but not being a proper strategy, pay attention about "fake signals" and add always a visual analysis to the provided signals
Following this indicator, the trade positions should be opened only when a cross happens. Either in this case, analyse the chart in order to see if the signals are a "weak" ones, due to "waves" around the SMMA . In these cases, you might wait for the next confirmation signals after the waves, when the trend will be better defined
The close trade signals are provided in order to help to understand when you should close the buy or sell trades. Even in this case, always add a visual analysis to the signals, and pay attention to the support/resistance areas. Sometimes, you can have the close signals in correspondence to support/resistance areas: in these cases wait for the definition of the trend and eventually for the next close trade signals if they will be better defined


Reversal Candle Pattern SetUp
An outside reversal candle set up script with buy/sell signals. Looks simple but it's pretty powerful especially if combined with your choice confirming indicator.
The pattern psychology is this one (Frank Ochoa explanation): " The power behind this pattern lies in the psychology behind the traders involved in this setup. If you have ever participated in a breakout at support or resistance only to have the market reverse sharply against you, then you are familiar with the market dynamics of this setup.
[Basically, market participants are testing the waters above resistance or below support to make sure there is no new business to be done at these levels. When no initiative buyers or sellers participate in range extension, responsive participants have all the information they need to reverse price back toward a new area of perceived value.
As you look at a bullish outside reversal pattern, you will notice that the current bar's low is lower than the
prior bar's low. Essentially, the market is testing the waters below recently established lows to see if a downside
follow-through will occur. When no additional selling pressure enters the market, the result is a flood of buying
pressure that causes a springboard effect, thereby shooting price above the prior bar's highs and creating the
beginning of a bullish advance."

Key Levels Inc ORB by JJThis indicator is designed specifically for Stock CFDs and Indices (e.g. US30, US500, NAS100, Tesla, AMD, Meta) to help traders quickly visualise and trade around key market levels with a focus on the Opening Range Breakout (ORB).
✨ Features:
• Previous Week High/Low (PWH/PWL) – plots institutional key levels for higher-timeframe confluence.
• Opening Range (ORB) – fully customisable start & end time (default: 14:30–14:45 UK time for US markets).
• Trading Range Filter – avoid false signals in choppy markets by requiring a minimum range size (Points or %).
• Signal System
• Buy/Sell signals triggered only on candle close beyond ORH/ORL (no wick traps).
• Optional Flip Trades mode (invert signals).
• Longs, Shorts, or both can be toggled.
• Multiple signal styles (Label, Circle, Triangle, Arrow) with custom size and colours.
• Retest Confirmation (optional) – signal only fires after a price retest of the breakout level, with flexible tolerance controls (Points, %, ATR).
• ATR% Filter – suppresses signals when volatility is too low (default: ATR(14) ≥ 0.3% of price).
• Session Filter – signals only during your defined trading session (default: 14:30–21:00 UK).
• Customisable Levels – change line widths, label text, and visibility to fit your charting style.
🎯 Why use it?
This tool combines classic key levels with a robust ORB strategy to remove noise and highlight only high-probability breakout conditions. It’s flexible enough for scalpers and day traders, but also powerful for swing traders seeking confluence with weekly highs/lows.
⚙️ Default Settings (v1.0 Benchmark):
• ORB: 14:30–14:45 UK
• Trading Range: 14:30–15:00 UK (≥ 1 point)
• ATR Filter: 14-length, 0.3%
• Session: 14:30–21:00 UK
• Retest Confirmation: ON, Wick touch, 0.1 pts tolerance, 20 bars max
• Signal Style: Arrow, Size: Normal
• Buy: Green, Sell: Red
Wick Pressure Zones [BigBeluga]
The Wick Pressure Zones indicator highlights areas where extreme wick activity occurred, signaling strong buy or sell pressure. By measuring unusually long upper or lower wicks and mapping them into gradient volume zones , the tool helps traders identify levels where liquidity was absorbed, leaving behind footprints of supply and demand imbalances. These zones often act as support, resistance, or liquidity sweep magnets .
🔵 CONCEPTS
Extreme Wicks : Large upper or lower shadows indicate aggressive rejection — upper wicks suggest selling pressure, lower wicks suggest buying pressure.
Volumatic Gradient Zones : From each detected wick, the indicator projects a layered gradient zone, proportional to the wick’s size, showing where most pressure occurred.
Liquidity Footprints : These zones mark levels where significant buy/sell volume was executed, often becoming reaction points on future retests.
Automatic Expiration : Zones persist until price decisively trades through them, after which they are cleared to keep the chart clean.
🔵 FEATURES
Automatic Wick Detection : Identifies extreme upper and lower wick events using percentile filtering and Realative Strength Index.
Gradient Zone Visualization : Builds a 10-layer zone from the wick top/bottom, shading intensity according to pressure strength.
Volume Labels : Each zone is annotated with the bar’s volume at the origin point for added context.
Dynamic Zone Extension : Zones extend to the right as long as they remain relevant; once price closes through them, they are removed.
Support & Resistance Mapping : Upper wick zones (red) behave like supply/resistance, lower wick zones (green) like demand/support.
Clutter Control : Limits the number of active zones (default 10) to keep charts responsive.
Background Highlighting : Optional background shading when new wick zones appear (red for sell, green for buy).
🔵 HOW TO USE
Look for Upper Wick Zones (red) : Indicate strong selling pressure; watch for resistance, reversals, or liquidity sweeps above.
Look for Lower Wick Zones (green) : Indicate strong buying pressure; watch for support or liquidity sweeps below.
Trade Retests : When price returns to a zone, expect a reaction (bounce or rejection) due to leftover liquidity.
Combine with Context : Align wick pressure zones with HTF support/resistance, order blocks, or volume profile for stronger signals.
Use Volume Labels : High-volume wicks indicate more significant liquidity events, making the zone more likely to act as a strong reaction point.
🔵 CONCLUSION
The Wick Pressure Zones is a powerful way to visualize hidden liquidity and aggressive rejections. By mapping extreme wick events into dynamic, volume-annotated zones, it shows traders where the market absorbed heavy buy/sell pressure. These levels frequently act as magnets or turning points, making them valuable for timing entries, stop placement, or fade strategies.

Derivative Dynamics Indicator [MarktQuant]The Derivative Dynamics Indicator is a versatile technical indicator that combines several critical metrics used in cryptocurrency and derivatives trading. It helps traders understand the relationship between spot prices, perpetual contract prices, trading volume pressure, and open interest across multiple exchanges. This indicator provides real-time visualizations of:
Funding Rate : The cost traders pay or receive to hold perpetual contracts, indicating market sentiment.
Open Interest (OI) : The total value of outstanding derivative contracts, showing market activity.
Cumulative Volume Delta (CVD) : A measure of buying vs. selling pressure over time.
Additional Data: Includes customizable options for volume analysis, smoothing, and reset mechanisms.
Key Features & How It Works
1. Metric Selection
You can choose which main metric to display:
Funding Rate: Shows the current funding fee, reflecting market sentiment (positive or negative).
CVD: Tracks buying vs. selling pressure, helping identify trend strength.
Open Interest: Displays total outstanding contracts, indicating market activity levels.
2. Volume Data Validation
The script checks if the selected chart includes volume data, which is essential for accurate calculations, especially for CVD. If volume data is missing or zero for multiple bars, it warns you to verify your chart setup.
3. CVD Calculation Methods
You can select how the CVD (Cumulative Volume Delta) is calculated:
Basic: Uses candle open and close to estimate whether buying or selling pressure dominates.
Advanced: Uses a money flow multiplier considering price position within high-low range, generally more accurate.
Tick Estimation: Uses percentage price change to estimate pressure.
You can also choose to display a smoothed version of CVD via a Simple Moving Average (SMA) to better visualize overall trends.
4. CVD Reset Option
To prevent the CVD value from becoming too large over long periods, you can set the indicator to reset periodically after a specified number of bars.
5. CVD Scaling
Adjust the scale of CVD values for better visibility:
Auto: Automatically adjusts based on magnitude.
Raw: Shows raw numbers.
Thousands/Millions: Divides the CVD values for easier reading.
Funding Rate Calculation
The indicator fetches data from multiple popular exchanges (e.g., Binance, Bybit, OKX, MEXC, Bitget, BitMEX). You can select which exchanges to include.
It calculates the funding rate by taking the mean of spot and perpetual prices across selected exchanges.
Open interest is fetched similarly and scaled according to user preferences (auto, millions, billions). It indicates the total amount of open contracts, providing insight into market activity intensity.
Visualizations & Data Presentation
Funding Rate: Shown as colored columns—green for positive (bullish sentiment), red for negative (bearish sentiment).
Open Interest: Displayed as a line, showing overall market activity.
CVD & SMA: Plotted as lines to visualize buying/selling pressure and its smoothed trend.
Information Table: Located at the top right, summarizes:
Current base currency
Number of active sources (exchanges)
Calculated funding rate
Total open interest
Current CVD and its SMA
Last delta (buy vs. sell pressure)
How to Use It
Select Metrics & Exchanges: Choose which data you want to see and from which exchanges.
Adjust Settings: Tweak CVD calculation method, SMA length, reset interval, and scaling options.
Interpret Visuals:
A positive funding rate suggests traders are paying long positions, often indicating bullish sentiment.
Negative funding rates can indicate bearish market sentiment.
Rising CVD indicates increasing buying pressure.
Open interest spikes typically mean increased market participation.
Important Notes
The indicator relies on the availability of volume data for accurate CVD calculation.
Always verify that the exchanges and symbols are correctly set and supported on your chart.
Use the combined insights from funding rates, CVD, and open interest for a comprehensive market view. This tool is designed for research purposes only.
Smart Money Footprint & Cost Basis Engine [AlgoPoint]Smart Money Footprint & Cost Basis Engine
This indicator is a comprehensive market analysis tool designed to identify the "footprints" of Smart Money (institutions, whales) and pinpoint high-probability reaction zones. Instead of relying on lagging averages, this engine analyzes the very structure of the market to find where large players have shown their hand.
How It Works: The Core Logic
The indicator operates on a multi-stage confirmation process to identify and validate Smart Money zones:
Smart Money Detection (The Trigger): The engine first scans the chart for signs of intense, urgent buying or selling. It does this by identifying Fair Value Gaps (FVGs) created by large, high-volume Displacement Candles. This is our initial Point of Interest (POI).
Cost Basis Calculation (The Average Price): Once a potential Smart Money move is detected, the indicator calculates the Volume-Weighted Average Price (VWAP) for that specific move. This gives us a highly accurate estimate of the average price at which the large players entered their positions.
Historical Confirmation (The "Memory"): This is the indicator's most unique feature. It checks its historical database to see if a similar Smart Money move (in the same direction) has occurred in the same price area in the past. If a match is found, the zone's significance is confirmed.
Verified Cost Basis Zone (The Final Output): A zone that passes all the above checks is drawn on the chart as a high-probability Verified Cost Basis Zone. These are the "memory zones" where the market is likely to react upon a re-visit.
How to Use This Indicator
Cost Basis Zones (The Boxes):
Green Boxes: Bullish zones where Smart Money likely accumulated positions. When the price returns here, a BUY reaction is expected.
Red Boxes: Bearish zones where Smart Money likely distributed positions. When the price returns here, a SELL reaction is expected.
Zone Strength (★★★): Each zone is created with a star rating. More stars indicate a higher-confidence zone (based on factors like volume intensity and historical confirmation).
BUY/SELL Signals: A signal is only generated when the price enters a zone AND the confirmation filters (if enabled in the settings) are passed.
Zone Statuses:
Green/Red: Active and waiting to be tested.
Gray: The zone has been tested, and a signal was produced.
Dark Gray (Invalidated): The zone was broken decisively and is no longer considered valid support/resistance.
Key Settings
Signal Accuracy Filters: You can enable/disable three powerful filters to balance signal quantity and quality:
Momentum Confirmation (Stoch): Waits for momentum to align with the zone's direction.
Candlestick Confirmation (Engulfing): Waits for a strong reversal candle inside the zone.
Lower Timeframe MSS Confirmation: The most advanced filter; waits for a trend shift on a lower timeframe before giving a signal.
Historical Confirmation:
Require Historical Confirmation: Toggle the "Memory" feature on/off. Turn it off to see all potential SM zones.
Tolerance Calculation Method: Choose between a dynamic ATR Multiplier (recommended for all-around use) or a fixed Percentage to define the zone size.

Balance & Reversal Indicator [SYNC & TRADE]ndicator Description: "Balance & Reversal Indicator "
Purpose of the Indicator
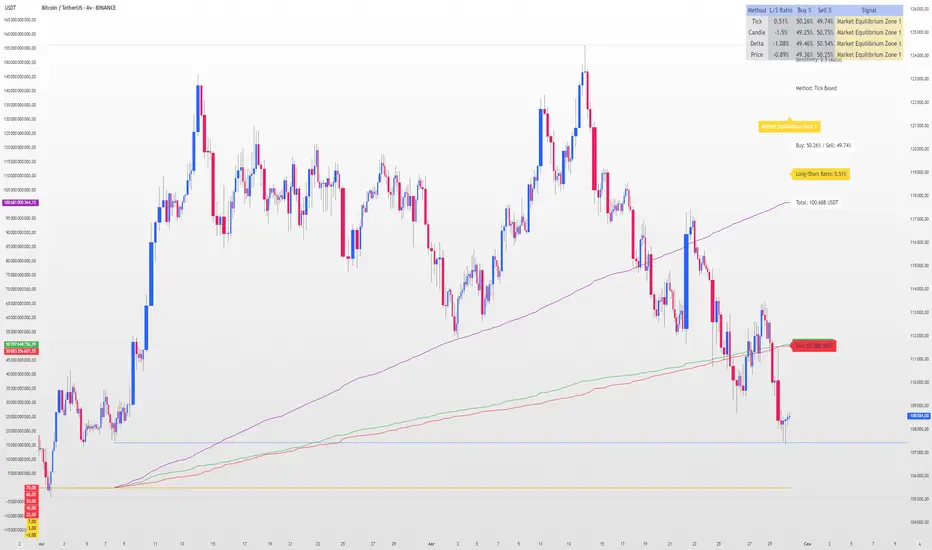
The "Balance & Reversal Indicator " indicator is designed for analyzing market activity in cryptocurrency and other financial markets. It assists traders in identifying potential trend reversal points, detecting market equilibrium zones, and evaluating the balance between buying and selling volumes. The indicator is suitable for both short-term and long-term trading, offering flexible settings to adapt to various trading styles and timeframes.
What Does the Indicator Provide?
Volume Analysis: Calculates buy and sell volumes, along with the Long/Short Ratio, to assess current market dynamics.
Reversal Signals: Generates signals for potential Long (buy) and Short (sell) reversals based on customizable levels, ranging from "Potential Reversal" to "Maximum Signal."
Equilibrium Zones: Identifies zones where the market is in balance, useful for recognizing neutral market conditions.
Flexible Calculation Methods: Supports four volume calculation methods (Tick Based, Candle Based, Delta Based, Price Movement) to suit different trading approaches.
Auto and Manual Sensitivity: Offers "Auto" mode for timeframe-based sensitivity or "Manual" mode for custom sensitivity settings.
Data Visualization: Displays key metrics (total volume, buy/sell volumes, ratio, and percentages) via a comparison table and on-chart labels for easy interpretation.
Volume Unit Customization: Allows volume display in USDT, Active contracts, or other units for enhanced flexibility.
How to Use the Indicator?
Adding to the Chart:
Find "Balance & Reversal Indicator " in the TradingView library and add it to your chart.
The indicator appears in a separate panel below the chart, keeping price data unobstructed (overlay=false).
Configuring Settings:
Calculation Method: Choose one of four volume analysis methods:
Tick Based: Analyzes price movement within a candle.
Candle Based: Evaluates candle direction (up/down).
Delta Based: Considers the difference between open and close prices.
Price Movement: Assesses movement strength based on candle body and wick sizes.
Sensitivity Mode:
In "Auto" mode, sensitivity adjusts automatically based on the timeframe (e.g., higher for minute charts, lower for daily charts).
In "Manual" mode, set sensitivity manually (from 0.1 to 1.0).
Reversal Levels (Long/Short): Configure levels for Long and Short signals with associated ranges. For example, Long Reversal Level 1 = -30% with a 5% range triggers signals between -35% and -30%.
Equilibrium Levels: Set levels for neutral market zones (e.g., ±7% for Equilibrium Level 1).
Messages: Customize signal messages to align with your trading style.
Analysis Period (Start/End Time): Define the time range for volume calculations.
Volume Unit: Select USDT, Active (active contracts), or Contracts for volume display.
Interpreting Signals:
Comparison Table (Top-Right Corner): Displays analysis results for all four calculation methods (Long/Short Ratio, Buy %, Sell %, Signal), enabling method comparison.
On-Chart Labels: Show total volume, buy/sell volumes, Long/Short Ratio, buy/sell percentages, current method, and sensitivity.
Color-Coded Signals:
Green: Potential Long (buy) opportunity.
Red: Potential Short (sell) opportunity.
Yellow: Market in equilibrium zone.
Chart Levels: Horizontal lines indicate reversal levels (green for Long, red for Short, yellow for equilibrium) with a transparency gradient for clarity.
Applying in Trading:
Use reversal signals to enter positions. For example, a "Maximum Long Signal" may indicate a strong buying opportunity.
Equilibrium zones help avoid trading during low-volatility periods.
Compare methods in the table to confirm signals.
Adjust settings to match your timeframe and asset. For instance, use "Tick Based" with high sensitivity for scalping on minute charts or "Price Movement" with low sensitivity for long-term trading.
Recommendations:
Test the indicator on historical data to optimize settings for your asset and strategy.
Combine indicator signals with other technical analysis tools (e.g., support/resistance levels or trend indicators) for greater accuracy.
Regularly update the time range (Start/End Time) to ensure relevant data analysis.
Who Is This Indicator For?
"Balance & Reversal Indicator " is ideal for traders who:
Trade on cryptocurrency exchanges and want to analyze trading volumes.
Seek reversal points for entering Long or Short positions.
Prefer customizable settings and the ability to compare different analysis methods.
Operate across various timeframes, from minutes to months.
Note: This indicator is not financial advice. Always conduct your own analysis and consider risks before making trading decisions.
© TradingStrategyCourses, 2025. All rights reserved.
Third Eye ORB Pro (0915-0930 IST, no-plot)Third Eye ORB Pro (Opening Range Breakout + Range Mode)
This indicator is designed specifically for Indian stocks and indices (NIFTY, BANKNIFTY, FINNIFTY, MIDCAP, etc.) to track the Opening Range (09:15–09:30 IST) and generate actionable intraday trade signals. It combines two key modes — Range Mode (mean reversion inside the opening range) and Breakout Mode (momentum trading beyond the range).
1. Opening Range Framework (09:15–09:30 IST)
The indicator automatically plots the Opening Range High (ORH) and Opening Range Low (ORL) after the first 15 minutes of market open.
The area between ORH and ORL acts as the intraday battlefield where most price action occurs (historically ~70–80% of the day is spent inside this zone).
A shaded box and horizontal lines mark this range, serving as a visual reference for support and resistance throughout the day.
2. Range Mode (Mean Reversion Inside OR)
When price trades inside the Opening Range, the indicator looks for edge rejections to capture range-bound trades.
Range BUY (RB): Triggered near ORL when a bullish rejection candle forms (strong body + long lower wick).
Range SELL (RS): Triggered near ORH when a bearish rejection candle forms (strong body + long upper wick).
Optional filters (toggleable in settings):
RSI Filter: Only allow range buys if RSI is oversold (≤45) and range sells if RSI is overbought (≥55).
VWAP Filter: Only allow range trades if price is not too far from VWAP (distance ≤ X% of OR size).
Labels show suggested Stop Loss (just outside the OR band) and Target (midline/VWAP).
Cooldown logic prevents consecutive whipsaw signals.
3. Breakout Mode (Directional Moves Beyond OR)
When price closes strongly outside the ORH/ORL with momentum, the indicator confirms a breakout/breakdown trade.
Buffers are applied to avoid false breakouts:
ATR Buffer: Price must extend at least ATR × multiplier beyond the range edge.
% Buffer: Price must extend at least a percentage of OR size (default 10%).
Confirmation Filters:
Candle must have a strong body (≥60% of total bar range).
Optional “two closes” rule: price must close outside the range for 2 consecutive candles.
BUY BO: Trigger when price closes above ORH + buffer with momentum.
SELL BD: Trigger when price closes below ORL – buffer with momentum.
Labels and alerts are plotted for quick action.
4. Practical Usage
Works best on 5-minute charts for intraday trading.
Designed to help traders capture both:
Range-bound moves during the day (mean reversion plays).
Strong directional breakouts when institutions push price beyond the opening range.
Particularly effective on expiry days, trending sessions, and major news days when breakouts are more likely.
On sideways days, Range Mode provides reliable scalp opportunities at the OR edges.
5. Features
Auto-plots Opening Range High, Low, Midline.
Box + line visuals (no repainting).
Buy/Sell labels for both Range Mode and Breakout Mode.
Customizable buffers (ATR, % of range) to suit volatility.
Alerts for all signals (breakouts and range plays).
Built with risk management in mind (suggested SL and TP shown on chart).

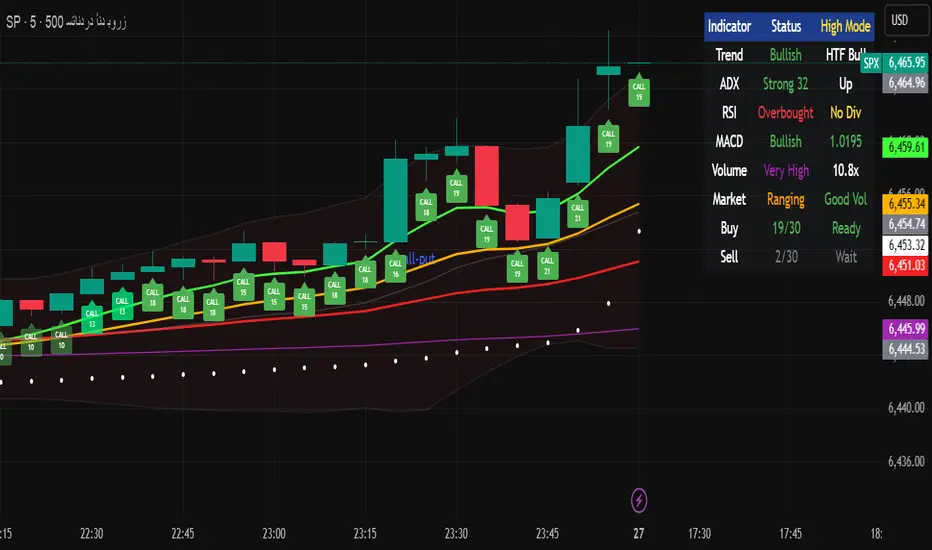
Multi-Timeframe Options Strategy with Dynamic Scoring System## Multi-Timeframe Options Strategy with Dynamic Scoring System
### Overview
This indicator combines 12 technical analysis tools using a proprietary 30-point scoring system to generate options trading signals (CALL/PUT). It's designed for traders seeking confluence-based entries with multiple confirmation layers.
### How the Scoring System Works
The indicator evaluates market conditions across three categories:
**Trend Analysis (9 points maximum):**
- EMA Alignment (9, 21, 50, 200): Checks if moving averages are properly stacked (3 points)
- ADX Trend Strength: Confirms trend momentum above 25 threshold (3 points)
- Higher Timeframe Confirmation: Validates signals against larger timeframe trend (3 points)
**Momentum Indicators (7 points maximum):**
- RSI Position & Direction: Optimal zones 40-65 for buys, 35-60 for sells (2 points)
- MACD Signal Line Cross: Momentum confirmation (2 points)
- Stochastic Oscillator: Overbought/oversold conditions (2 points)
- Bollinger Band Position: Price relative to middle band (1 point)
**Market Quality Filters (4 points maximum):**
- Volume Confirmation: 1.5x average volume requirement (2 points)
- VWAP Position: Trend alignment check (1 point)
- ATR Volatility: Ensures adequate price movement (1 point)
### Key Features
**1. Fair Value Gaps (FVG)**
- Identifies price inefficiencies between candles
- Bullish FVG: Current low > high (potential support)
- Bearish FVG: Current high < low (potential resistance)
- Visual representation with colored boxes on chart
**2. Three Operating Modes**
- Normal Mode: Minimum 10 points - balanced signal frequency
- High Mode: Minimum 15 points - fewer but stronger signals
- Ultra Mode: Minimum 20 points - only highest quality setups
**3. Protection Mechanisms**
- Bollinger Band squeeze detection avoids ranging markets
- Prevents conflicting signals (no simultaneous CALL/PUT)
- 5-bar minimum cooldown between signals
- Filters extreme RSI readings (>75 or <25)
**4. Risk Management**
- Three profit targets: 0.5%, 1%, 1.5%
- Stop loss: 0.5% or ATR-based
- Visual target lines with entry/exit levels
### How Components Work Together
The indicator creates a comprehensive market analysis by combining:
- **EMAs** provide the trend structure framework
- **Oscillators** (RSI, Stochastic) identify optimal entry timing
- **ADX** confirms trend strength to filter weak signals
- **Volume** validates institutional participation
- **Higher timeframe** acts as a directional filter
Each component contributes points to either bullish or bearish scoring. Signals only generate when one direction significantly outweighs the other and meets minimum thresholds.
### Usage Instructions
1. **Select Mode**: Choose Normal/High/Ultra based on your trading style
2. **Monitor Dashboard**: Check real-time scoring and market conditions
3. **Wait for Signals**: Main BUY/SELL labels appear when criteria met
4. **Follow Targets**: Use automated TP and SL levels for risk management
5. **Candle Labels**: Optional CALL/PUT labels show building momentum
### Dashboard Information
The dashboard displays:
- Current trend direction and HTF confirmation
- ADX strength and direction
- RSI status with divergence detection
- MACD momentum state
- Volume multiplier
- Market condition (trending/ranging)
- Live scoring for both directions
### Important Notes
- This is a technical analysis tool, not financial advice
- Past performance does not guarantee future results
- Always use proper risk management
- Test thoroughly on demo before live trading
### Originality
This indicator's unique value comes from:
1. The 30-point weighted scoring system that prioritizes different factors
2. Integration of Fair Value Gaps with traditional indicators
3. Multi-mode operation allowing traders to adjust signal frequency
4. Higher timeframe validation system
5. Comprehensive filtering to reduce false signals
The combination creates a systematic approach to options trading that goes beyond simple indicator mashups by providing clear, scored reasoning for each signal.
---
### Updates and Support
For questions or suggestions, please comment below. The indicator will be updated based on community feedback while maintaining compliance with all platform rules.
RealEdgeFX EdgeMap ProPresentation
RealEdgeFX EdgeMap Pro is built for systematic intraday decision-making. It combines a rule-based Daily Bias engine with an intraday (1-hour) regime engine based on medium timeframe engulfing (a structure change where a new directional run overwhelms the prior one). The study continuously evaluates candlestick behavior, session-level displacement, previous-day range interaction, and clearly defined points of interest (price areas left by sharp moves that often act as magnets or rejection zones). Intraday highs/lows inside an active regime are updated in real time on lower timeframes, so levels expand tick-by-tick when price makes new extremes.
Description
RealEdgeFX EdgeMap Pro is built on the idea that price alternates between contraction and expansion. Expansion begins when price drives in one direction with conviction. The study blends higher-timeframe daily context with a confirmed 1-hour structure shift called ME (Medium timeframe engulfing)—the moment a fresh run closes beyond the opening level that began the previous opposite run. From that confirmation forward, the active range’s high and low are maintained in real time on lower timeframes, expanding tick-by-tick whenever price prints new extremes. The tool also marks points of interest derived from zones where the price usually reacts following the 1h order flow context. Only the most relevant, side-aligned area is shown, and it is removed as soon as price trades decisively through it.
The engine outputs a Buy/Sell/Neutral stance and a 0–100 strength score. The definitive rules are the ones displayed in the on-chart table: the bias is produced when at least three of those criteria are active, or when a rule-based override flips the stance. Strength is calculated from the same table and increases with the number and intensity of active checks.
Tools
- Daily Bias & Strength (table-driven): Produces a Buy/Sell/Neutral bias and a 0–100 strength score for the day. The decision follows the rules shown in the on-chart table; the bias is set when at least three table criteria are active, or when a rule-based override flips it. Strength scales with how many checks are active and how strong they are.
- Medium-Timeframe Engulfing (ME) on 1-Hour: Detects a confirmed 1-hour structure shift when a new move closes beyond the opening price that started the prior opposite move. From that moment, the active range’s high/low is maintained in real time on lower timeframes, expanding tick-by-tick as new extremes print. A 1-hour close through the invalidation clears the ME and its dependents.
- Points of Interest (POI): Marks areas created by a distinct three-candle move on the 1-hour chart where the middle bar’s range does not overlap the bar from two candles earlier, or the initial candle that produces the Medium-Timeframe Engulfing. Only POIs formed after the current ME begins and lying inside the active ME range are eligible. Overlapping same-side areas merge; only the nearest, side-aligned POI is shown and it is removed once price trades decisively through it.
- ME-Based Fibonacci Levels: Draws three live reference lines tied to the active ME range—100% at the active extreme, 50% at the midpoint, and 0% at the opposite extreme. These levels extend forward, update in real time as the ME range grows, and hide automatically when no valid ME is active.
- Intraday Visuals: On the first bar of each new trading day (on intraday charts), prints an up/down arrow reflecting the current Daily Bias and a clean text label with its strength. Sizes and colors are configurable to keep the chart readable.
- On-Chart Diagnostic Table: Displays the exact rules used to build the Daily Bias and Strength, broken down by sections (Price Body & Structure, Breakout & Liquidity, POI Context, Overrides). A check mark means the criterion is currently contributing; this table is the single source of truth for the engine’s decisions.
What can you customize?
- ME Level & Label (Medium-Timeframe Engulfing): Choose line style (solid, dashed, dotted), line width, and separate colors for bullish and bearish levels. Set the label text (e.g., “ME”), its color, and size. Control how far the line/label project forward in time. Once a 1-hour close invalidates the setup, the ME line and label are removed automatically, keeping the view clean.
- POI Areas (Points of Interest): Toggle on/off. Pick separate fill colors for bullish/bearish areas, adjust transparency, and set border color, width, and style. Define how far each area extends forward. Only the most relevant, side-aligned area is shown; when price closes decisively through it, the box is cleared to avoid clutter.
- ME-Based Fibonacci Levels (100/50/0): Toggle the three reference lines, and customize each level’s color, width, and style. Turn labels on/off and set label text size and color. Control forward extension so levels project the way you prefer. Levels auto-update in real time as the ME range expands and hide when no valid ME is active.
- Intraday Day-Change Arrows & Strength Labels: Select arrow size (Tiny, Small, Normal, Large) and separate colors for buy/sell arrows. Choose text color and size for the strength percentage, also separated for buy/sell. Control the history window (how many past days’ arrows/labels remain visible) to keep the chart minimal or more informative.
- Diagnostics Table (Daily Bias & Strength): Toggle the table on/off and place it in any corner (top/bottom, left/right). Customize header background/text colors, row background/text colors, and the colors used for Buy/Sell/Neutral states. Set border width and overall text size to match your chart theme.
- Forward Extensions & History Windows: Independently control how far ME lines, POI boxes, and ME-Fibonacci levels extend into the future, and how much intraday arrow/label history is kept. These controls let you balance context vs. cleanliness on any timeframe.
How to use properly
- Add RealEdgeFX EdgeMap Pro to any TradingView symbol and timeframe.
- For execution, use intraday charts (e.g., 1–15 minutes).
- The study pulls its higher-timeframe context from the Daily and confirms structure on the 1-hour engine.
Originality & value
This study is not a mashup; it integrates a daily rule engine with a 1-hour regime detector that maintains live extremes on lower timeframes and a single, side-aligned point-of-interest filter with merging/invalidations. The combination produces a table-audited bias and strength built from measurable, configurable checks rather than generic overlays.
Terms and Conditions
Purpose and no advice. These charting tools are provided for informational and educational purposes only. They do not predict markets or provide financial, investment, or trading advice. Past performance is not indicative of future results.
User responsibility and liability. By using these tools, you agree that all decisions and outcomes are your sole responsibility. RealEdgeFX EdgeMap Pro and its creator(s) are not liable for any losses or consequences arising from the use of these products. You agree to indemnify and hold RealEdgeFX EdgeMap Pro harmless from any claims related to your use.
Access and use. Access may be granted via TradingView invite and requires an active subscription. Access is personal and non-transferable. Sharing, reselling, redistributing, copying, decompiling, or attempting to reverse engineer the code is prohibited. Access may be suspended or revoked for violations of these terms or platform policies.
Subscriptions, discounts, and cancellation. If you receive access through a Friends & Family program or use a discount code, the discount applies only to the first purchase or first billing cycle unless explicitly stated otherwise. You are solely responsible for canceling—or requesting cancellation of—your subscription if you do not wish to continue after the discounted period and/or at full price.
Refund policy. No reimbursements, refunds, or chargebacks are provided, to the maximum extent permitted by law.
Acceptance and updates. By continuing to use these tools, you acknowledge and agree to these Terms and Conditions. RealEdgeFX EdgeMap Pro may update these terms from time to time; continued use after updates constitutes acceptance of the revised terms.

Delta Pulse Oscillator — GSK-VIZAG-AP-INDIA“Delta Pulse Oscillator visualizes buy vs. sell pressure using smoothed delta %, baselines, and crossover markers.”
📌 Delta Pulse Oscillator — GSK-VIZAG-AP-INDIA
The Delta Pulse Oscillator is a custom-built momentum tool that measures the balance between buying and selling activity and smooths it with moving averages. It provides a visual representation of percentage delta strength with dynamic coloring, baseline levels, and crossover markers.
🔎 Key Features
Delta EMA (%) Line → Shows the smoothed percentage difference between simulated buy and sell volumes.
Signal EMA Line → A shorter EMA applied on Delta EMA to highlight momentum shifts.
Baseline Levels
0 line (neutral balance of buy/sell activity).
+5 baseline (stronger positive pressure).
-5 baseline (stronger negative pressure).
Dynamic Coloring → Green when Delta EMA is above zero, red when below.
Cross Dots
Yellow dots mark when Delta EMA or Signal EMA crosses the zero line.
Orange dots appear when Delta EMA crosses the +5 or –5 baselines.
Green/Red dots highlight when both EMAs stay above +5 or below –5.
Background Fills → Visual zones for positive and negative regions.
🧩 How It Can Be Used
Helps to visualize buying vs. selling pressure in real time.
Highlights when momentum is strengthening or weakening around defined baseline levels.
Useful as a confirmation tool when combined with other forms of analysis.
⚠️ Note: This script is for educational and analytical purposes only. It is not a trading strategy and does not provide buy/sell signals. Always use with additional tools, price action, and proper risk management.

Svl - Trading SystemPrice can tell lies but volume cannot, so keeping this in mind I have created this indicator in which you see sell order block and buy order block on the basis of price action + volume through which we execute our trade
First of all, let us know its core concepts and logic, which will help you in taking the right decisions in it.
core concept of the " Svl - Trading System " TradingView indicator is based on professional price action, volume, and swing structure. This indicator smartly gives real-time insights of important price turning points, reversal zones, and trend continuation. Its deep explanation is given below.
Edit - default swing length -5 , change according your nature , tested With 7 For 5 minute timeframe
Core Concept:
1. Swing Structure Detection
The indicator automatically detects swing highs (HH/LH) and swing lows (HL/LL) on the chart.
HH: Higher High
HL: Higher Low
LH: Lower High
LL: Lower Low
These swings are the backbone of price action – signaling a change in trend, a bounce, reversal or trend continuation.
2. Order Block (OB) Mapping
Buy Order Block (Buy OB): When the indicator detects the HL/LL swing, we declare Buy OB, the lowest point of the swing.
Sell Order Block (Sell OB): On HH/LH swing, the highest point of our swing is called Sell OB.
Order Blocks are those important zones of price where historically price has reacted strongly – where major clusters of buyers/sellers are located in the market.
3. Volume Analysis (Optional Dashboard/Barcolor)
The candle color depends on the volume ranking on the chart (most high/low, normal, pressure blue shade).
Highest/lowest volume candles are a special highlight, which helps to spot liquidity spikes, exhaustion, or big orders.
4. Live Dashboard
There is an automated dashboard in the top-right of the chart, which shows this in real-time:
Last swing type (HH/HL/LH/LL)
Reversal price (last swing level)
Swing direction (Bull/Bear/Neutral)
Volume, Buy OB, Sell OB, etc.
This helps the trader understand the market situation at a glance.
5. Smart Plotting/Labels
Buy/Sell are plotted as distinct lines on the OB chart.
The Labels option gives clear visual swing points.
All calculations are fast and automated – the user does not need to mark manually.
This indicator is an advanced, fully-automated price action tool that combines
trend, reversal, volume, liquidity and zone detection in one smart system,
makes entry/exit decisions objective and error-free,
and provides complete trading confidence with a live monitor/dashboard.
All of its functions/properties such as: swing detect, OB plot, volume color, dashboard follow best practice for professional chart analysis!
