Zeta Volume Profile ProWhat is Volume Profile?
Volume Profile is an advanced order flow analysis which displays volume distribution at various price points over time. It may be called a recent biodata of a stock which is displayed on a chart as a horizontal histogram. Volume Profile can help reveal significant price levels where smart money is sitting.
Why Volume Profile is important?
The life of a Future Contract is of maximum 3 months. All the near month contracts expire on the last Thursday of the respective month. But, the traders who want to continue holding on to their winning positions would likely take the same position in the next series. So they often close the existing position near the expiry and take position in the next series. This activity is termed as Rolling Over the position and mostly it catches strength about 5-6 days before the expiry.
If we start tracking Volume Profile 5-6 days before the monthly expiry, we get to know the levels where maximum concentration of volume is located. In layman terms, we want to see where the biggest crowd is sitting. In this crowd, there will be equal number of buyers and sellers and when either party starts feeling the heat (market goes against them), they try to limit their loss by Buying/Selling and the random walks become a unidirectional march.
Zeta Volume Profile Pro tries to detect this crowd behavior by tracking maximum volume concentration area and when price leaves this area, it generates Buy/Sell Signals.
What is unique about Zeta Volume Profile Pro?
There are other volume profile indicators also in the market but Zeta Volume Profile Pro is unique in following aspects:
1. Whenever last Thursday of any month starts, Zeta Volume Profile Pro resets automatically and starts calculating volume and price levels from 30 bars backwards (default value which the user can change). Assuming we are looking at 30 Min. Time-Frame chart and your Stock Exchange opens for 6 hours a day, the last 30 candles cover 5 days data. If in your time zone, stock exchange remains open for longer hours, you can either increase minimum number of bars to be considered or you may increase your time-frame. The idea is you should cover 5-6 days of data on last Thursday of the month.
2. Once you set the minimum number of bars and time-frame relevant to you, leave everything to Zeta Volume Profile Pro. Now with every passing tick, the volume profile created by Zeta Volume Profile Pro will keep changing and more and more price bars will keep adding to the minimum number of bars set by you till last Wednesday of the current month occurs.
3. On any given day or time, whenever price breaks out of maximum volume concentration area, the indicator generates a Buy/Sell Signal and often such breakouts give handsome returns.
What markets it is suitable for?
It can be used in any time-zone on any stock exchange. However, since the concept is based upon Volume Concentration, it works best on highly liquid stocks, commodities, currency pairs and indices.
It will not give good results if the underlying security is illiquid because volume profile generated will not be efficient one.
Since Future Contracts volume tends to be more than cash segment, it gives much better results on Futures Charts.
Which time frames are best for this indicator?
Choose such time-frame and minimum number of bars which are equivalent to 5-6 trading sessions in your time-zone. In settings, there is an option to set your time-zone.
How to Take Buy/Sell Entry with Zeta Volume Profile Pro?
Whenever you see a Buy Signal appearing on your chart, take Buy Entry and whenever you see a Sell Signal, take Sell side Entry.
Your STOP LOSS would be high or low of candle which occurs just before the Buy/Sell Signal respectively.
Keep moving your STOP LOSS up as the price moves in your favor and when market turns around and you see a SELL signal, it is time to book your BUY position profit and take Entry on SELL Side now and so on.
What are the limitations of this indicator?
Sometimes price takes a break out of maximum volume concentration area and then again comes back which might hit your stop loss. However, as the backtested data shows, having faith in the indicator will give you some so nice breakouts that a single trade will cover your 10 to 20 Stop Loss hits.
How to get this indicator?
This is invite-only indicator. Get in touch with us using information given below in Signature field to try this tool FREE for 02 live sessions. After that, it is subscription based access.
Pesquisar nos scripts por "Buy sell"

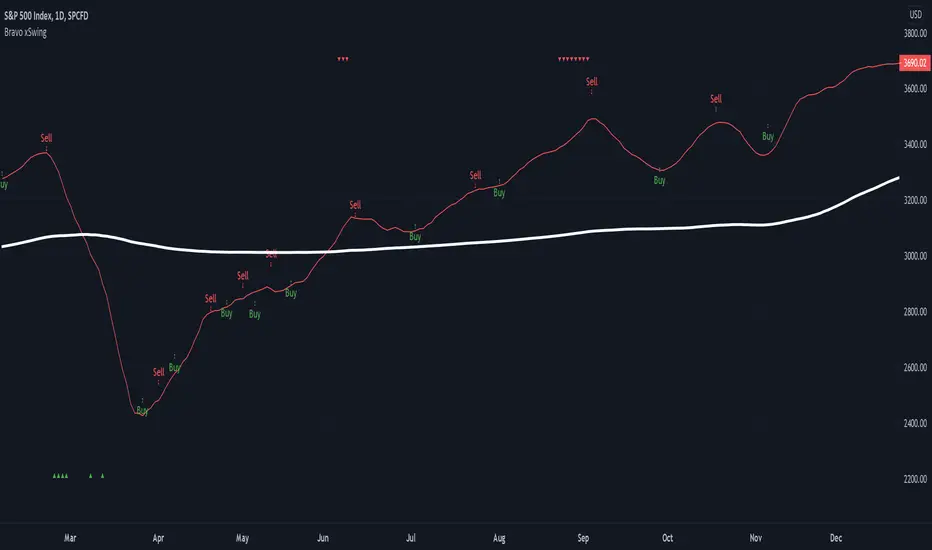
Bravo xSwingThe Bravo xSwing is a hybrid of my Original Bravo Swing script (BUY) and the Accurate Swing Trading System script by ceyhun (SELL) - also know as SMA 9/50/180 | EMA 20 | BUY/SELL.
This system buys in on a full candle close above the SMA 9 (indicating a strong bullish trend) and sells using the above mentioned Accurate Swing algorithm.
Back-testing results suggest 15% greater returns than using the Accurate Swing Trading System or Original Bravo swing alone. **
RSI overbought/oversold are also included as references and display as follows:
- Overbought - red down arrows display on top of chart.
- Oversold - green up arrows display on bottom of chart.
Note: Back-testing suggests that these indicators are not as effective with Extended Hours turned on.
** If you are using the 1 hour chart, the sell indicators will appear on a close below the SMA9, as back-testing suggests better profitability using the Original Bravo Close for this time period.
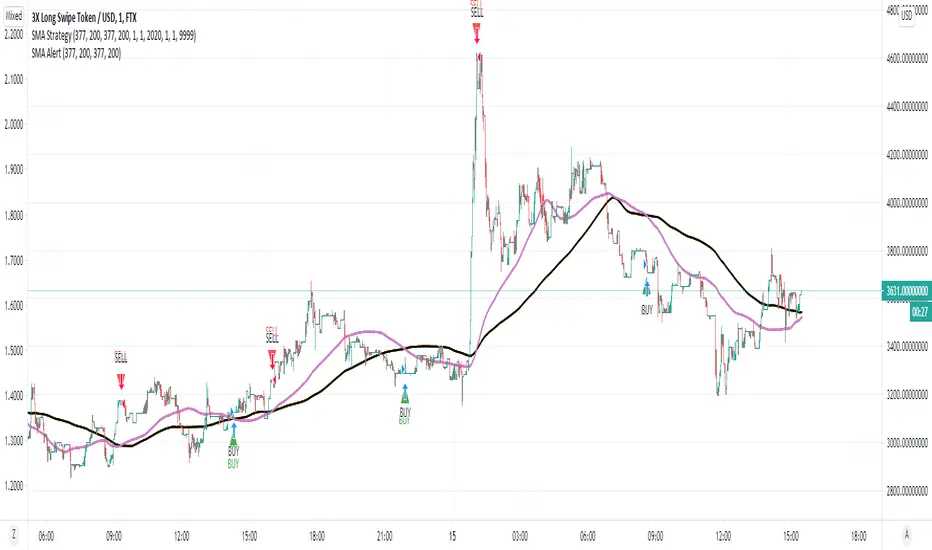
SMA Strategy - Indicator Version for AlertIn this indicator, I made use of two different sma intersections for buying and selling points. You can use the intersection of 2 sma values for buying and 2 separate sma intersection for selling.
There are 3 different alarms for those who want to set an alarm.
- Cross Alarm: The alarm that will work on buy-sell signals for those who have the right to set a single alarm.
- Buy Alarm: The alarm that will operate at the receiving point according to the values you specified.
- Sell Alarm: The alarm that will operate at the sales point according to the values you specify.
CryptoSignalScanner - OverBought/OverSold Zone IndicatorDESCRIPTION:
This indicator has been designed to do some swing trading on 4 hour and daily candles.
It also gives good results on the lower timeframes 5m, 15m and 1h but trading on those levels is time consuming and stressful.
• This indicator is based on RSI, Stochastic RSI and some other indicator(s).
• This indicator is based on our "CryptoSignalScanner - Advanced BUY/SELL Indicator" but with a small difference in calculation to define the OverBought and OverSold zones.
• It displays the OverBought and OverSold zones.
• It is also possibility to set an OverBought/OverSold, OverBought and OverSold alert.
HOW TO USE:
• When the OverBought zone is displayed it means that the trading pair is OverBought. Wait for the reversal to SELL. Use the Fibonacci tool together with the Eliot Waves Theory to SELL.
• When the OverSold zone is displayed it means that the trading pair is OverSold. Wait for the reversal to BUY. Use the Fibonacci tool together with the Eliot Waves Theory to BUY.
FEATURES:
• You can adjust the OverBought and OverSold zones.
• You can display/hide the RSI.
• You can adjust RSI values.
• You can display/hide the Stochastic RSI.
• You can adjust Stochastic RSI values.
• You can display/hide the ...
• You can adjust the ...
• You can set OverBought/OverSold alert.
• You can set OverBought alert.
• You can set OverSold alert.
• Etc...
REMARKS:
• This advice is NOT financial advice.
• We do not provide personal investment advice and we are not a qualified licensed investment advisor.
• All information found here, including any ideas, opinions, views, predictions, forecasts, commentaries, suggestions, or stock picks, expressed or implied herein, are for informational, entertainment or educational purposes only and should not be construed as personal investment advice.
• We will not and cannot be held liable for any actions you take as a result of anything you read here.
• We only provide this information to help you make a better decision.
• While the information provided is believed to be accurate, it may include errors or inaccuracies.
HOW TO GET ACCESS TO THE SCRIPT:
• Use the link below to subscribe to our indicators.
Good Luck,
SEOCO

GnG - Cuan Sniper with 7MA and Buy Sell SignalThis Indicator possible users to get a signal when buying and selling.
Using Cross EMA :
when short EMA cross-up Long EMA is Signal to Buy
when short EMA cross-down Long EMA is Signal to Sell
Using Stochastic 14-3-3 to get signal overbought and oversold.
when oversold, and StochK is crossing-up stochD, will show signal to buy.
when overbought, and StockK is crossing-down stockD, will show signal to sell.
Using Parabolic SAR, Pivot H/L, Cloud and Linear Regression to find Resistance and Support.
Disclaimer On. Take your own risk.

Cracking Cryptocurrency - IchimokuCracking Cryptocurrency Ichimoku
The Ichimoku Cloud is designed to measure both momentum and trend. This script is optimized for **Cryptocurrency** by default but the settings can easily be adjusted from the Input Window to trade on any asset.
The core of the Ichimoku Strategy can be broken down into two facets, depending on whether you prefer to trade short-term or long-term. The Ichimoku is a trending indicator by default, it will not catch bottoms or tops. It is a momentum indicator .
Features & Functions
Multiple Time Frames Feature: With this feature, you can view the Ichimoku of a different time frame than you are currently viewing. This is very useful for looking at daily support and resistance (Kumo, Chikou) but wishing to trade a different strategy (Price Action, Moving Averages, etc.) on a lower time frame.
Short-Term Strategy
Revolves around Tenkan and Kijun crosses. Should the Tenkan crossover the Kijun, that is a bullish indication, and a signal to buy or go long.
Conversely, should the Tenkan crossunder the Kijun that is a bearish indication, and a signal to sell or go short.
In the settings, you can choose to plot Tenkan/Kijun crosses. With this option selected, several things will occur when Tenkan/Kijun crosses happen.
1. The current bar will change colors depending on whether the signal is a buy or a sell. Buy = Aqua, Sell = Fuchsia
2. A dot will appear on the Tenkan. Buy = Green, Sell = Red
3. A label will appear above or below bar indicating the correct decision. Buy = Buy, Sell = Sell.
Long-Term Strategy
Revolves around price closing above or below the Kumo Cloud itself. Should price close above a bearish Kumo Cloud, that is a bullish indication, and a signal to buy or go long.
Conversely, should price close below a bullish Kumo Cloud, that is a bearish indication, and a signal to sell or go short.
In either case, it's important to understand what the cloud breaks are representing. They are representing a potential shift in the dominant trend. Ichimoku attempts to identify when that shift happens, so we can get on the side of the emerging trend.
In the settings, you can choose to plot Kumo Cloud Breaks. With this option selected, several things will occur when Kumo Cloud breaks happen.
1. The current bar will change colors depending on whether the signal was a buy or a sell. Buy = Aqua, Sell = Fuchsia
2. A label will appear above or below bar indicating the correct decision. Buy = Buy, Sell = Sell.
---
Please note, that the Kumo Cloud Breaks indicate stronger signals, and thus more weight should be given to them than TK Crosses. However, depending on what time frame you are trading on, Kumo Cloud breaks are a rarer occurrence than TK Crosses.
---
Additional Features
---
The Chikou (Lagging) Spam is run through a Zero Lag filter. The reason for this is aesthetic. The smoothing can be disabled in the input windows.
The purpose of the Chikou Span is to identify Support and Resistance.
If you have any questions, success or failure stories, or seek advice feel free to send me a private message here on Trading View. Trade safely.

[BT] - Manual TSSL [ALERTS] v1Manual TSSL - V1
Enter the market on your own, and use this script to alert you when to sell. I found myself many times in position but wanted a script to help automatically exit the market when I stepped away.
Directions
You must provide the timestamp and price in the settings. Adjust the TSSL settings, make sure you leave enough room so the market can breath. Once the price goes below the bottom TSSL red line, is when the alert will trigger. Added some labels to keep track of the buy/sell and when the bottom TSSL price moves up.
If you like this idea, but would like another indicator instead of TSSL, please feel free to message me directly.
Thanks for looking!

FibMAThis study visually demonstrates Fibonacci moving averages.
The darker the color, the stronger the signal is for either buying or selling.
Buys/Sells only take place when each moving average is above/below the its adjactent fibonacci sequence, i.e 5<8<13<21<34<55<89<144 for buying..
Alerts are provided as BUY ASSET and SELL ASSET.
Multiple moving averages are also provided.

HiLoMAHiLoMA (High/Low Moving Average) was designed specifically for calculating moving average boundries similar to Bollinger Bands, but is derived from the highest and lowest prices of an asset, not just the closing price. The timeframe is configurable and the study displays arrows where buys (below) and sells (above) should take place.
On exchanges with low or discounted fees, the study does excessively well at scalping. Backtesting, in general, shows this study to be very robust in any market conditions.
The alert conditions are clearly identified as BUY ASSET and SELL ASSET for automated trading.
Buys only occur when the entire spread is below the momentum line.
Sells only take place when the entire spread is above the momentum line.
When the momentum line cuts through the spread, any potentional buys/sells are ignored as these are considered weak.
Be sure your calculate your momentum on the basis of your candlestick timeframe. If you are using 3 minutes candlesticks and you want a 24 hour momentum, you need to set your momentum to 480. This holds true for all timeframes.
Sep 24
Release Notes: Seperated buys/sells where spread crosses momentum.
Cyan (lighter blue) arrows are buy/sell signals that disregard momentum.
Buys/Sells that honour momentum are now labeled MOMBUY ASSET and MOMSELL ASSET.
Buys/Sells that disregard momentum are now BUY ASSET and SELL ASSET accordingly.
Oct 4
Release Notes: Momentum is now a band with an upper and lower boundry. Buys and sells must now be completely above the band or below the band respectively. The effect is to produce stronger signals for momentum precomditional trades.

Sell / Buy RatesThis script finds sell / buy rates and adds its linear regression to the chart. its aim is finding buying and selling power, then you can try to find trend reversals. Also you can find divergences, it's very important signal for trend reversal.
Linear regression is a basic and commonly used type of predictive analysis.
if you choose lower periods then it will be more sensitive. I choose 34 as it's one of fibonnaci number.
If you find my works useful, please consider a donation
BTC: 16XRqyS3Vgh1knAU1tCcruqhUrVm4QWWmR

Gunbot Machine Gun (trial version)Hello fellow Gunbotters, you have requested and I have delivered. Here is the trial version for Gunbot Machine Gun strategy.
Note:
1. This is the trial version so the customization settings are locked, subscribe to unlock features.
2. Green triangles = buy signals, Red triangles = sell signals.
3. Both buy and sell alerts are set-up so you can create alerts easily.
This is how the Gunbot Machine Gun works: I have 200 slots for alerts in Tradingview. I use all of those slots to set buy and sell alerts on BTC pairs. I have volatility filter in my script so the Machine Gun will only start firing out rounds (Buy alerts) when the volatility becomes high. Tradingview sends email to gmail. Gunbot waits for the email, once it reads it Gunbot will action the email (buy/sell depending on the message). Gunbot buys the coin based on email message received from Tradingview. It will be rapid fire, accumulating buys while coin is pumping up. Then when the dust settles and momentum starts dying, the script will throw a hand grenade (pink triangles), send a sell signal/email then Gunbot reads that email and executes the sell all trade.
Buys early during pumps. Finds coins that will pump soon. Sells at peak.
Legend:
Green triangles = buy signals
Pink triangles = sell signals
Note:
During period of low volatility there will rarely be any buy signals. The sell signals during this time is irrelevant (can only sell after you bought). But once high volatility is detected the script gets ready to activate. Then it starts sending buy signals close and during the pumps. Sells at peak.
Works on most coins and stocks.

Color CandlesUses 6 most common indicators to color candles when they give buy/sell signals.
Use line view to see candle colors.
Purple = 6 buy signals
Teal = 5 buy signals
Navy = 4 buy signals
Lime = 3 buy signals
Green = 2 buy signals
Pale Green = 1 Buy signal
White = neutral
Gray = 1 sell signal
Yellow = 2 sell signals
Orange = 3 sell signals
Red = 4 sell signals
Firebrick = 5 sell signals
Black = 6 sell signals
Parabolic SAR calculated as .02, .02, .2. Traditional Buy/Sell. Green/Red Dots.
Bollinger Band calculated as 20, 1. Buy/Sell when above or below band. Aqua filled band.
MACD calculated with emas 12, 26, 9. Traditional MACD/Signal cross Buy/Sell. Filled Blue/Orange band.
RSI length 14. Traditional Buy/Sell below 30 and above 70. Green/Yellow/Red line below price.
ADX/DI len 14. Traditional crossover Buy/Sell. Filled Lime/Green above price.
Stochastic 14/3/3. Traditional 20/80 Buy/Sell. Filled teal/orange above price.

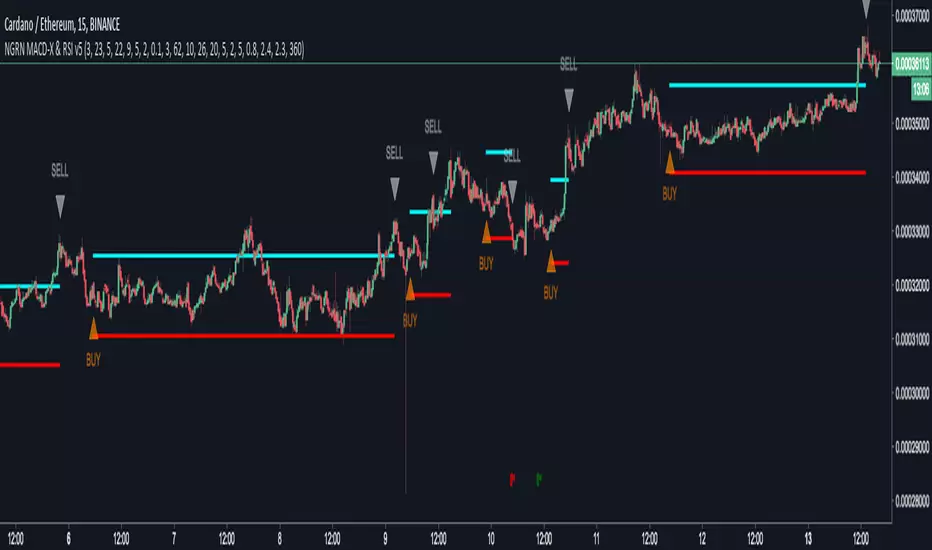
NGRN MACD-X & RSI v5MACD-X, RSI & Volume Indicator & Alerts Study - Version 5
Overview
This study and it's associated strategy were modeled after the famous Philakone described algorithms on his now defunct instructional video series.
This indicator allows for full customisation of parameters and interaction between three indicators that allow users to shape their trading methods to their desired goals.
This associated strategy also allows users to backtest the study alerts script and find the best settings towards that end.
MACD + RSI + VOLUME - are of the most powerful and widely usded indicators, MACD/Histogram crosses, coupled with RSI & Volume increases/decreases will detects areas of deeply oversold / overbought and buys/sells on the reversal
Features
Full customisation - All parameters are open for customising to allow the trader to build their own strategy and adapt from market to market.
Clean/Simple UI - Facilitating ease of use.
Enable Buying OR Selling, - or have them both active at the same time.
Toggle off and on ALTERNATING Buy and Sell feature (pyramiding) - to allow for consecutive DCA style buys or SCALING out of an entry (partial sell).
Customizable Stop-Loss plot - to enable users to create a STOP-LOSS alert option or other alert(s) based on the plot location. See settings screenshot.
Toggle Auto Stop-Loss sell option - to enable users choose whether or not to automatically issue a sell signal when close crosses stop loss plot, or choose to toggle off if not profitable.
Customizable Take-Profit plot - to enable users to create a TAKE-PROFIT alert option or other alert(s) based on the plot location.
Study and associated Strategy - to use the TradingView ‘Strategy Tester’ back-testing features to find the best alert settings for specific coins in bear, bull and sideways markets.
Changes Version 5
Added STOP-LOSS time-out period where users may specify a duration of trading pause time after a stop-loss has been triggered. A value of zero disables the feature. Time out start is indicated by a red flag icon and resumption is indicated with a green flag.
Settings
SCREENSHOT LINKS:
BUY SETTINGS: prntscr.com
SELL SETTINGS: prntscr.com
Access
For a 4 DAYS TRAIL, sign up as an Explorer subscriber @ Patreon page: www.patreon.com
Full Access is 0.25 ETH , one time fee for LIFETIME access to the STUDY indicator, STRATEGY and future updates as well as support and SETTINGS for various markets on the Binance Exchange.
NGRN MACD-X & RSI v4MACD-X, RSI & Volume Indicator & Alerts Study - Version 4
Overview
This study and it's associated strategy were modeled after the famous Philakone described algorithms on his now defunct instructional video series.
This indicator allows for full customisation of parameters and interaction between three indicators that allow users to shape their trading methods to their desired goals.
This associated strategy also allows users to backtest the study alerts script and find the best settings towards that end.
MACD + RSI + VOLUME - are of the most powerful and widely usded indicators, MACD/Histogram crosses, coupled with RSI & Volume increases/decreases will detects areas of deeply oversold / overbought and buys/sells on the reversal
Features
Full customisation - All parameters are open for customising to allow the trader to build their own strategy and adapt from market to market.
Clean/Simple UI - Facilitating ease of use.
Enable Buying OR Selling, - or have them both active at the same time.
Toggle off and on ALTERNATING Buy and Sell feature (pyramiding) - to allow for consecutive DCA style buys or SCALING out of an entry (partial sell).
Customizable Stop-Loss plot - to enable users to create a STOP-LOSS alert option or other alert(s) based on the plot location. See settings screenshot.
Toggle Auto Stop-Loss sell option - to enable users choose whether or not to automatically issue a sell signal when close crosses stop loss plot, or choose to toggle off if not profitable.
Customizable Take-Profit plot - to enable users to create a TAKE-PROFIT alert option or other alert(s) based on the plot location.
Study and associated Strategy - to use the TradingView ‘Strategy Tester’ back-testing features to find the best alert settings for specific coins in bear, bull and sideways markets.
Changes Version 4
Improved STOP-LOSS plot draw (red line).
Added the option to automatically sell when stop-loss cross triggered or have the option disabled, in the event a better profit can be achieved.
Added new TAKE-PROFIT plot (aqua line) to visually guide users where to place the TAKE-PROFIT parameter as well as give users options to create alerts based on the TAKE-PROFIT plot.
Access
Full Access is 0.1 ETH , one time fee for LIFETIME access to the STUDY indicator, STRATEGY and future updates as well as support and SETTINGS for various markets on the Binance Exchange.
Settings
SCREENSHOT LINKS:
BUY SETTINGS: prntscr.com
SELL SETTINGS: prntscr.com

CryptogramTR with OPEN CODEIndicator is obtained by importing RSI(14) into HULL moving average source with 2 different periods, as one is long period and the other is short.
When green line (short period) cross upward the red line (long period) , this is a BUY; vice versa it is a SELL.
When HMA Short Period is set to 1 (one), yielding line is absolutely the same line of RSI (14). You can change it into 8(eight) preferably.
İndikatör, RSI(14) indikatörünün, hull hareketli ortalamasının kod kaynağı olarak atanması ile elde edilmiştir. Uzun ve kısa olmak üzere 2 ayrı periyot kullanılmıştır.
Yeşil çizgi yani kısa periyotlu çizgi, kırmızı yani uzun periyotlu olanı yukarı keserse AL, tersi durum SAT olarak düşünülmelidir.
Hull Kısa Periyodu 1 iken oluşan yeşil çizgi, RSI(14) indikatörünü vermektedir. Kısa periyot olarak tercihinize göre bu değeri 8 olarak da kullanabilirsiniz.

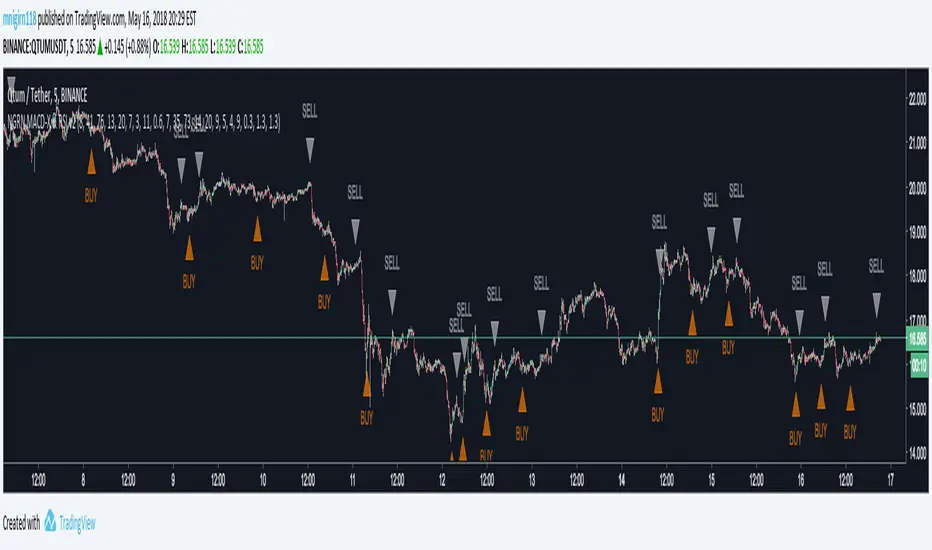
NGRN MACD-X & RSI v3.1 MACD-X, RSI & Volume Indicator & Alerts Study - Version 3.1
Overview
This study and it's associated strategy were modeled after the famous Philakone described algorithms on his now defunct instructional video series.
This indicator allows for full customisation of parameters and interaction between three indicators that allow users to shape their trading methods to their desired goals.
This associated strategy also allows users to backtest the study alerts script and find the best settings towards that end.
MACD + RSI + VOLUME - are of the most powerful and widely usded indicators, MACD/Histogram crosses, coupled with RSI & Volume increases/decreases will detects areas of deeply oversold / overbought and buys/sells on the reversal
Features
Full customisation - All parameters are open for customising to allow the trader to build their own strategy and adapt from market to market.
Clean/Simple UI - Facilitating ease of use.
Enable Buying or Selling, - or have them both active at the same time.
Toggle off and on ALTERNATING Buy and Sell feature (pyramiding) - to allow for consecutive DOLLAR COST AVERAGING style buys or SCALING out of an entry (partial sell).
Customizable Stop-Loss plot - to enable users to create a STOP-LOSS alert option or other alert(s) based on the plot location. See settings screenshot.
Study and associated Strategy - to use the TradingView ‘Strategy Tester’ back-testing features to find the best alert settings for specific coins in bear, bull and sideways markets.
Ideal for use with the Autoview trading bot
Changes Version 3.1
UI consolidates reduntant script inputs making the script easier to use.
Fixes STOP-LOSS algorithm.
Adds a STOP-LOSS Plot (red line) to enable users to create a STOP-LOSS alert option or other alert(s) based on the plot location. See settings screenshot.
Access
Full Access is 0.1 ETH , one time fee for LIFETIME access to the STUDY indicator, STRATEGY and future updates as well as support and SETTINGS for various markets on the Binance Exchange.
Settings
BUY SETTINGS: prntscr.com
SELL SETTINGS: prntscr.com
STOP-LOSS SETTINGS: prntscr.com

NGRN MACD-X & RSI v2 StudyMACD-X, RSI & Volume Indicator Study - Version 2.0
Overview
This study and it's associated strategy were modeled after the famous Philakone described algorithms on his now defunct instructional video series.
This indicator allows for full customisation of parameters and interaction between three indicators that allow users to shape their trading methods to their desired goals.
This associated strategy also allows users to backtest the study alerts script and find the best settings towards that end.
MACD + RSI + VOLUME - are of the most powerful and widely usded indicators, MACD/Histogram crosses, coupled with RSI & Volume increases/decreases will detects areas of deeply oversold / overbought and buys/sells on the reversal
Features
Full customisation - All parameters are open for customising to allow the trader to build their own strategy and adapt from market to market.
Toggle Buying and Selling, or have them both active at the same time.
Toggle off and on ALTERNATING Buy and Sell feature to allow for consecutive DCA style buys or SCALING out of an entry (partial sell).
Access
Full Access is 0.07 ETH, one time fee for full unlimited access to the indicator, strategy and future updates as well as support and SETTINGS for various markets on the Binance Exchange (currently only USDT)
CandelaCharts - Composite Pressure Index 📝 Overview
The CandelaCharts – Composite Pressure Index (CPI) is a multi-factor oscillator that blends RSI , Money Flow Index (MFI) , and Chaikin Money Flow (CMF) into a single, stretchable “pressure” line. Instead of looking at three separate indicators, CPI compresses price momentum and volume flow into one normalized curve around 0 , then amplifies extremes using a rolling z-score .
The result is a dynamic gauge of buying vs. selling pressure that can travel beyond ±1 during strong regime shifts, helping you spot exhaustion, climaxes, and trend-strength phases more intuitively.
📦 Features
Composite pressure engine – Combines RSI, MFI, and CMF into a single normalized oscillator around 0, giving you a unified view of market pressure.
Custom weighting of components – Independently weight RSI, MFI, and CMF to prioritize pure price momentum or volume-driven signals.
Rolling z-score stretch – Uses a configurable z-score window to “stretch” the composite values, letting the line exceed ±1 during extremes instead of staying capped.
Adaptive amplitude control – An amplitude (gain) factor lets you scale how aggressive or subtle the CPI swings appear.
EMA smoothing – Optional smoothing removes noise while preserving the timing of swings and reversals.
Visual pressure band – Zero, +1, and -1 reference lines with a shaded band make it easy to see when pressure is “normal” vs. extended.
Dynamic color gradients – Warm/orange tones above 0 for bullish pressure and cool/blue tones below 0 for bearish pressure, with saturation increasing as pressure intensifies.
NA-safe statistics – Custom mean and standard deviation routines ensure stable behavior from the start of the chart and during partial history.
⚙️ Settings
RSI Length : Lookback length for RSI . Higher values smooth the RSI component; lower values make it more reactive to short-term price momentum.
MFI Length : Lookback length for the manual Money Flow Index . Adjust this to control how sensitive CPI is to price–volume interaction.
CMF Length : Lookback length for Chaikin Money Flow . This defines the window used to assess accumulation/distribution through volume flow.
RSI Weight : Relative importance of RSI within the composite. Increasing this emphasizes pure price momentum in the CPI.
MFI Weight : Relative importance of MFI. Higher values strengthen the influence of volume-weighted price moves.
CMF Weight : Relative importance of CMF. Raising this highlights accumulation/distribution as a driver of the pressure index.
Smoothing : EMA length applied to the stretched CPI line. A value of 1 effectively disables smoothing, while higher values reduce noise at the cost of a slight lag.
Z-score Window : Rolling window used to compute the mean and standard deviation of the raw composite. This defines the statistical context for what counts as “extreme”. Shorter windows adapt faster; longer windows give a more stable regime.
Amplitude : Gain factor applied to the z-scored composite. Values above 1.0 exaggerate swings and make extremes more visually pronounced; values below 1.0 compress them.
⚡️ Showcase
Composite Pressure Index
Mean Line
Divergences
📒 Usage
1. Identify directional pressure regimes
Use 0 as the key balance line:
CPI > 0 → Net bullish pressure (buyers in control).
CPI < 0 → Net bearish pressure (sellers in control).
You can treat prolonged stays above or below 0 as confirmations of trend direction, especially when price structure agrees.
2. Read statistical extremes instead of fixed levels
Because CPI is stretched via a z-score , values beyond ±1 typically represent statistically meaningful extremes within your chosen window:
CPI > +1 → Overextended bullish pressure / potential euphoria.
CPI < -1 → Overextended bearish pressure / potential capitulation.
These zones are not automatic reversal signals, but they highlight areas where monitoring for exhaustion, blow-offs, or risk-reward shifts can be beneficial.
3. Spot divergences with price
Classic divergence logic applies particularly well when pressure is composite:
Bearish divergence – Price makes higher highs, but CPI makes lower highs or fails to confirm.
Bullish divergence – Price makes lower lows, but CPI makes higher lows or shows less downside extension.
These patterns can be integrated with support/resistance, liquidity levels, and other CandelaCharts tools.
4. Tune the weights to your strategy
Adjust the three weights to match your focus:
Higher RSI weight → More sensitivity to pure price momentum (good for breakout or trend-following systems).
Higher MFI weight → Greater emphasis on price–volume interaction (ideal for spotting volume-confirmed moves).
Higher CMF weight → Stronger focus on accumulation/distribution (helpful for swing and position traders).
5. Integrate with existing setups
The CPI is designed to sit comfortably below price:
Use it as a “context” oscillator underneath your main price-action and liquidity models.
Combine CPI extremes and divergences with key levels, range models, or order flow signals for higher-confluence entries.
🚨 Alerts
The indicator does not provide any alerts!
⚠️ Disclaimer
Trading involves significant risk, and many participants may incur losses. The content on this site is not intended as financial advice and should not be interpreted as such. Decisions to buy, sell, hold, or trade securities, commodities, or other financial instruments carry inherent risks and are best made with guidance from qualified financial professionals. Past performance is not indicative of future results.

CVD & Big Trade Detector By HKOverview The CVD & Big Trade Detector By HK offers a unique perspective on Cumulative Volume Delta (CVD). This indicator utilizes Floating Bars (Candles) to visualize the cumulative buying and selling pressure. This design allows you to clearly see the net delta of each specific candle relative to the cumulative trend.
Additionally, it integrates the "Big Trade" algorithm to highlight statistically significant volume anomalies (Whale activity) directly on the CVD bars.
How it Works Since standard volume data does not always provide buy/sell splitting, this script estimates intrabar pressure using price action logic:
Buying Pressure: Calculated based on the push from the Low to the Close.
Selling Pressure: Calculated based on the push from the High to the Close.
The indicator then calculates the Delta (Buy Vol - Sell Vol) and accumulates it.
Floating Bars: Instead of plotting from the zero-line, each bar opens at the previous CVD value and closes at the new cumulative value.
Teal/Green Bar: Net buying in the current period (CVD increased).
Maroon/Red Bar: Net selling in the current period (CVD decreased).
Key Features
Floating CVD Structure: Prevents the "barcode effect" common in histogram CVDs. It provides a clean, candle-like view of momentum accumulation.
Whale Detection:
The script calculates the moving average and standard deviation (Sigma) of the buying/selling volume.
Green Dots: Appear when buying volume exceeds the statistical threshold (Signifying a "Big Buy").
Red Dots: Appear when selling volume exceeds the statistical threshold (Signifying a "Big Sell").
Precise Positioning: Whale markers are plotted exactly at the closing value of the CVD bar, showing you exactly where the volume spike impacted the delta.
How to Use
Divergences: Look for situations where Price makes a Higher High, but the CVD Bars fail to make a new high (bearish divergence).
Absorption: If you see a Large Whale Dot on a very small CVD bar (doji-like), it indicates massive volume fighting for direction with little net result—often a sign of absorption or a pending reversal.
Trend Confirmation: Strong floating bars in the direction of the trend, accompanied by Whale Dots, confirm smart money participation.
Settings
Lookback Period: Defines the baseline for the statistical volume calculation (default: 50).
Sensitivity (Sigma): Adjusts how strict the "Whale" detection is (default: 3.0). Higher values = fewer, more significant signals.
Colors: Fully customizable colors for Up/Down bars and Buy/Sell markers.
Built with Pine Script™ v6

Order Flow Signals - Alphaomega18═══════════════════════════════════════════════════════════════════════════════
ORDER FLOW SIGNALS - TRADINGVIEW PUBLICATION (ENGLISH)
Created by Alphaomega18
═══════════════════════════════════════════════════════════════════════════════
📌 PUBLICATION TITLE
═══════════════════════════════════════════════════════════════════════════════
Order Flow Signals - Absorptions & CVD Divergences - Alphaomega18
📝 COMPLETE DESCRIPTION
═══════════════════════════════════════════════════════════════════════════════
🎯 DETECT INSTITUTIONAL MOVES IN REAL-TIME
Order Flow Signals is an advanced order flow analysis indicator that displays institutional absorption signals, hidden CVD divergences, and extreme buy/sell pressure directly on your chart.
Fully customizable with 9 configurable colors, adjustable label sizes, and extreme absorption detection (300%+), this indicator allows you to trade WITH institutions, not against them.
🔥 THE PROBLEM IT SOLVES
Have you ever:
✗ Taken a technically perfect setup but got stopped out?
✗ Seen price reject a support/resistance but go the other way?
✗ Entered counter-trend without knowing institutions were accumulating?
✗ Missed big moves due to lack of confirmation?
Order Flow Signals solves these problems by revealing what smart money is REALLY doing behind each candle.
📊 SIGNALS DISPLAYED ON CHART
🔷 ABSORPTIONS (💎 Diamonds)
Institutions absorb order flow when volume is high BUT price doesn't move in the expected direction.
💎 BULLISH ABSORPTION (Cyan)
→ Volume spike + bearish candle + positive delta
→ Institutions are BUYING despite selling pressure
→ Strong accumulation signal
💎 BEARISH ABSORPTION (Orange)
→ Volume spike + bullish candle + negative delta
→ Institutions are SELLING despite buying pressure
→ Strong distribution signal
🔥 EXTREME ABSORPTIONS (Fuchsia Fire)
→ Volume > 300% of average (customizable)
→ MASSIVE institutional activity
→ Ultra-rare and ultra-strong signals
→ Indicates major moves in preparation
🔺 DIVERGENCES (▲ Green Triangles)
Price makes lower lows BUT CVD makes higher lows
→ Hidden accumulation in progress
→ Bullish reversal signal likely
→ Confirms your BUY entries
🔻 DIVERGENCES (▼ Red Triangles)
Price makes higher highs BUT CVD makes lower highs
→ Hidden distribution in progress
→ Bearish reversal signal likely
→ Confirms your SELL entries
🚀 EXTREME BUY PRESSURE (Rockets)
Delta > 2x average
→ Massive aggressive buying
→ Strong bullish momentum
→ Continuation likely
💥 EXTREME SELL PRESSURE (Explosions)
Delta < -2x average
→ Massive aggressive selling
→ Strong bearish momentum
→ Capitulation or panic
📈 DELTA PER CANDLE DISPLAY (NEW)
Option to display numerical delta on each candle:
• ✅ GREEN when delta positive (+250, +180, etc.)
• ❌ RED when delta negative (-320, -150, etc.)
• Tiny size to avoid clutter
• Perfect for tracking flow in real-time
🎯 REAL USE CASES
📌 Example 1: Avoid the Classic Trap
Technical setup:
→ Price rejects VWAP Weekly (resistance)
→ FVG below attracting
→ Single Prints above
→ You think: "Perfect SELL setup!"
WITHOUT Order Flow Signals:
❌ You enter SELL
❌ Price goes up and stops you out
❌ Frustration and loss
WITH Order Flow Signals:
✅ You see 💎 CYAN DIAMOND (Bullish absorption)
✅ Institutions are BUYING despite rejection
✅ You DON'T ENTER SELL
✅ Trade saved, loss avoided!
📌 Example 2: Confirm a Breakout
Setup:
→ Price breaks major resistance
→ But is it a real breakout or fakeout?
Check Order Flow Signals:
→ 🚀 ROCKET appears (extreme buy pressure)
→ 💎 CYAN DIAMOND (bullish absorption)
→ Massive positive delta visible
Clear signal: It's a REAL breakout!
→ Enter BUY with confidence
→ Institutions pushing price
📌 Example 3: Detect Hidden Accumulation
Situation:
→ Price consolidating in range
→ Apparently neutral
→ No clear technical signal
Order Flow Signals reveals:
→ ▲ GREEN TRIANGLE (bullish divergence)
→ Price flat BUT CVD rising progressively
→ Institutional accumulation in progress
Action: Prepare LONG position
→ When price breaks, it will be violent!
⚙️ COMPLETE CUSTOMIZATION
🎨 COLORS (9 configurable colors)
• Bullish Absorption (default: cyan)
• Bearish Absorption (default: orange)
• EXTREME Absorption (default: fuchsia)
• Bullish Divergence (default: green)
• Bearish Divergence (default: red)
• Buy Pressure (default: lime)
• Sell Pressure (default: fuchsia)
• Positive Delta (default: green)
• Negative Delta (default: red)
Adapt the indicator to your chart style!
📏 LABEL SIZES
5 sizes available: Tiny / Small / Normal / Large / Huge
→ Perfect for all screen types
→ Large 4K screen? → Large or Huge
→ Small laptop? → Small or Normal
🔍 CUSTOMIZABLE DETECTION
• Normal Absorption Threshold: 1.5x (default)
• EXTREME Absorption Threshold: 3.0x (default)
• Divergence Periods: 14 (default)
• All thresholds adjustable to your style
👁️ ON/OFF DISPLAY
• Absorptions 💎 (On/Off)
• Divergences ▲▼ (On/Off)
• Extreme Pressure 🚀💥 (On/Off)
• Delta per Candle (On/Off)
Display only what you need!
🔔 COMPLETE ALERT SYSTEM
8 independently configurable alert types:
1. 🔵 Bullish Absorption
2. 🔴 Bearish Absorption
3. 🔥🔵 EXTREME Bullish Absorption
4. 🔥🔴 EXTREME Bearish Absorption
5. 📈 Bullish Divergence
6. 📉 Bearish Divergence
7. 🚀 Extreme Buy Pressure
8. 💥 Extreme Sell Pressure
Receive push, email or SMS notifications when institutions act!
💡 MARKETS AND TIMEFRAMES
✅ ALL markets compatible:
• Futures (ES, NQ, YM, RTY, MNQ, MES, etc.)
• Forex (EUR/USD, GBP/USD, USD/JPY, etc.)
• Crypto (BTC, ETH, altcoins)
• Stocks (Tesla, Apple, Nvidia, etc.)
• Indices (S&P 500, Nasdaq, Dow Jones)
• Commodities (Gold, Oil, etc.)
✅ All timeframes:
• Scalping: 1min, 5min
• Day Trading: 15min, 30min, 1H ⭐ (optimal!)
• Swing Trading: 4H, Daily
Note: More reliable signals with real volume data
→ TradingView Premium recommended for tick data
🏆 UNIQUE ADVANTAGES
✅ Automatic institutional absorption detection
✅ EXTREME absorptions (300%+) for ultra-strong signals
✅ Integrated CVD (Cumulative Volume Delta)
✅ Optional per-candle delta display (green/red)
✅ 9 customizable colors - adapt to your style
✅ 5 label sizes - perfect for all screens
✅ Clear visual signals directly on chart
✅ Detailed tooltips on each signal
✅ 8 independent configurable alerts
✅ Clean, optimized code, no repaint
✅ Compatible all markets and timeframes
📊 RECOMMENDED CONFIGURATION
For MNQ / ES / NQ (15min):
```
Detection:
├─ Normal Absorption Threshold: 1.5x
└─ EXTREME Absorption Threshold: 3.0x
Display:
├─ Absorptions: ✅ ON
├─ Divergences: ✅ ON
├─ Extreme Pressure: ✅ ON
└─ Delta per Candle: ❌ OFF (or ON if preferred)
Customization:
└─ Label Size: Normal (or Large for big screen)
Colors:
└─ Default (or customize!)
Alerts:
└─ All ✅ ON
```
For Scalping (1-5min):
```
└─ Label Size: Small
└─ Delta per Candle: ✅ ON (useful in scalping)
└─ Absorption Threshold: 2.0x (stricter)
```
🎓 SUPPORT AND TOOLTIPS
Each signal includes detailed tooltip on hover:
• Exact volume and multiplier (e.g. 2.3x)
• Precise delta
• Signal explanation
• Suggested action
Hover over 💎▲🚀 to understand each signal!
🔗 PERFECT COMPLEMENT
This indicator works perfectly with:
• Order Flow Dashboard (to see CVD and pressures)
• VWAP Multi-Timeframe
• Fair Value Gaps (FVG)
• Market Profile (POC/VPOC)
• Support/Resistance
Combine Order Flow signals with your technical analysis!
⚠️ DISCLAIMER
Technical indicators are decision support tools. No indicator guarantees profits. Always use:
• Appropriate risk management
• Stop loss on every trade
• Proper position sizing
• Demo account testing first
Order Flow Signals improves your analysis but doesn't replace a complete strategy.
📞 CONTACT AND SUPPORT
Created by Alphaomega18
For questions, bugs or suggestions:
Find my other indicators:
• Order Flow Dashboard (CVD and pressures)
• VWAP Multi-Timeframe Pro
• Fair Value Gap Detector
• Volume & Volatility Crisis Detector

Hybrid Strategy: Trend/ORB/MTFHybrid Strategy: Trend + ORB + Multi-Timeframe Matrix
This script is a comprehensive "Trading Manager" designed to filter out noise and identify high-probability breakout setups. It combines three powerful concepts into a single, clean chart interface: Trend Alignment, Opening Range Breakout (ORB), and Multi-Timeframe (MTF) Analysis.
It is designed to prevent "analysis paralysis" by providing a unified Dashboard that confirms if the trend is aligned across 5 different timeframes before you take a trade.
How it Works
The strategy relies on the "Golden Trio" of confluence:
1. Trend Definition (The Setup) Before looking for entries, the script analyzes the immediate trend. A bullish trend is defined as:
Price is above the Session VWAP.
The fast EMA (9) is above the slow EMA (21). (The inverse applies for bearish trends).
2. The Signal (The Trigger) The script draws the Opening Range (default: first 15 minutes of the session).
Buy Signal: Price breaks above the Opening Range High while the Trend is Bullish.
Sell Signal: Price breaks below the Opening Range Low while the Trend is Bearish.
3. The Confirmation (The Filter) A signal is only valid if the Higher Timeframe (default: 60m) agrees with the direction. If the 1m chart says "Buy" but the 60m chart is bearish, the signal is filtered out to prevent false breakouts.
Key Features
The Matrix Dashboard A zero-lag, real-time table in the corner of your screen that monitors 5 user-defined timeframes (e.g., 5m, 15m, 30m, 60m, 4H).
Trend: Checks if Price > EMA 21.
VWAP: Checks if Price > VWAP.
ORB: Checks if Price is currently above/below the Opening Range of that session.
D H/L: Warns if price is near the Daily High or Low.
PD H/L: Warns if price is near the Previous Daily High or Low.
Visual Order Blocks The script automatically identifies valid Order Blocks (sequences of consecutive candles followed by a strong explosive move).
Chart: Draws Green/Red zones extending to the right, showing where price may react.
Dashboard: Displays the exact High, Low, and Average price of the most recent Order Blocks for precision planning.
Risk Management (Trailing Stop) Once a trade is active, the script plots Chandelier Exit dots (ATR-based trailing stop) to help you manage the trade and lock in profits during trend runs.
Visual Guide (Chart Legend)
⬜ Gray Box: Represents the Opening Range (first 15 minutes). This is your "No Trade Zone." Wait for price to break out of this box.
🟢 Green Line: The Opening Range High. A break above this line signals potential Bullish momentum.
🔴 Red Line: The Opening Range Low. A break below this line signals potential Bearish momentum.
🟢 Green / 🔴 Red Zones (Boxes): These are Order Blocks.
🟢 Green Zone: A Bullish Order Block (Demand). Expect price to potentially bounce up from here.
🔴 Red Zone: A Bearish Order Block (Supply). Expect price to potentially reject down from here.
⚪ Dots (Trailing Stop):
🟢 Green Dots: These appear below price during a Bullish trend. They represent your suggested Stop Loss.
🔴 Red Dots: These appear above price during a Bearish trend.
🏷️ Buy / Sell Labels:
BUY: Triggers when Price breaks the Green Line + Trend is Bullish + HTF is Bullish.
SELL: Triggers when Price breaks the Red Line + Trend is Bearish + HTF is Bearish.
Settings
Session: Customizable RTH (Regular Trading Hours) to filter out pre-market noise.
Matrix Timeframes: 5 fixed slots to choose which timeframes you want to monitor.
Order Blocks: Adjust the sensitivity and lookback period for Order Block detection.
Risk: Customize the ATR multiplier for the trailing stop.
Disclaimer
This tool is for educational purposes only. Past performance does not guarantee future results. Always manage your risk properly.

Trend Fusion Indicator🎯 Trend Fusion Indicator🎯
Professional trading indicator combining EMA momentum with Supertrend volatility for high-probability signals.
📊KEY FEATURES:
• 9 EMA & Supertrend (10,3) crossover signals
• Visual trend direction with colored fills
• Buy/Sell arrows at crossover points
• Real-time trend tracking
• Clean, professional interface
⚡SIGNAL LOGIC:
✅ BUY: When EMA crosses ABOVE Supertrend
✅ SELL: When EMA crosses BELOW Supertrend
🎨VISUAL INDICATORS:
• Green Zone/Fill: Bullish trend (EMA > Supertrend)
• Red Zone/Fill: Bearish trend (EMA < Supertrend)
• Triangle Arrows: Entry signals
• Background Colors: Trend confirmation
⚙️CUSTOMIZABLE SETTINGS:
• EMA Length (Default: 9)
• Supertrend ATR Length (Default: 10)
• Supertrend Factor (Default: 3.0)
🔔ALERTS INCLUDED:
• Buy Alert: EMA crosses above Supertrend
• Sell Alert: EMA crosses below Supertrend
📈 BEST FOR:
• Swing Trading
• Day Trading
• Trend Following
• Market Reversals
⚠️ DISCLAIMER: This indicator is for educational purposes only.
Trading involves risk. Not financial advice. Use at your own risk.

DR.SS.SMART BUY/SMARTSELL SCALPER1️⃣ BEST TIMEFRAME
Use this as a scalper / intraday trend tool
✅ Best
5 min
15 min
⚠️ Avoid
1 min (too noisy)
Daily (signals become late)
2️⃣ FIRST CHECK – MARKET CONDITION (Dashboard)
Before taking any trade, look at the Smart Panel (Dashboard):
✔ Trade ONLY when:
Market State = Trending
Volatility = Active
Trend Pressure = Bullish or Bearish
At least 3–4 MTF boxes are same color
❌ Avoid trades when:
Market State = No trend / Ranging
Purple candles (ADX sideways)
Remember:
T-V-T rule → Trend + Volatility + Timeframe agree
3️⃣ BUY SETUP (LONG TRADE)
✅ Conditions in your code:
Price crosses ABOVE Supertrend
Close ≥ SMA 13
Bar color turns BLUE
Price above EMA 200 → Smart Buy
ADX not sideways (no purple bars)
📍 Chart shows label:
“Buy” → normal buy
“Smart Buy” → high-probability trade (BEST)
🔵 HOW TO ENTER BUY
Enter at candle CLOSE where Buy / Smart Buy appears
Do NOT enter mid-candle
🛑 STOP LOSS (Auto from code)
SL = ATR-based stop
Shown as red SL line
👉 Safe rule:
Never widen SL
🎯 TARGETS (Auto plotted)
TP1 = 1:1
TP2 = 2:1
TP3 = 3:1
📌 Recommended management:
Book 50% at TP1
Move SL to Entry
Hold rest till TP2 / Trail
4️⃣ SELL SETUP (SHORT TRADE)
✅ Conditions:
Price crosses BELOW Supertrend
Close ≤ SMA 13
Bar color turns RED
Price below EMA 200 → Smart Sell
No sideways (ADX > 15)
📍 Label shown:
“Sell”
“Smart Sell” (BEST)
🔴 HOW TO ENTER SELL
Enter at close of signal candle
Follow same SL & TP rules
5️⃣ SUPPLY & DEMAND CONFIRMATION (POWER FILTER)
🔹 Best Buy:
Price near Demand Zone
Then Smart Buy appears
🔹 Best Sell:
Price near Supply Zone
Then Smart Sell appears
👉 These are institutional entries
6️⃣ WHEN NOT TO TRADE ❌
Avoid trades when:
Purple candles (Sideways)
Supertrend flipping repeatedly
MTF dashboard mixed colors
During low-volume sessions
7️⃣ SESSION WISE BEST PERFORMANCE
From your session logic:
✅ Best Scalping:
London
London + New York overlap
⚠️ Avoid:
Mid-Tokyo (low volatility)
8️⃣ PERFECT TRADE CHECKLIST (SAVE THIS)
Before clicking BUY/SELL, ask:
✔ Smart Buy / Smart Sell?
✔ Price above/below EMA 200?
✔ Dashboard trend agrees?
✔ No sideways candles?
✔ Volatility Active?
👉 If 4 out of 5 = YES → TAKE TRADE
9️⃣ SIMPLE ONE-LINE STRATEGY
Trade only Smart Buy/Sell in trending market, book partial at 1:1, trail rest with Smart Trail
✅ BEST TRADING SESSIONS (Use ONLY these)
🥇 LONDON SESSION (BEST & SAFE)
🕒 12:30 PM – 4:30 PM IST
Why best for your script
Clean trends
Good volatility
Less fake signals
Supertrend + EMA200 works perfectly
👉 This should be your PRIMARY session
🥈 LONDON → NEW YORK OVERLAP (MOST POWERFUL)
🕒 6:00 PM – 8:30 PM IST
Why
Institutional money enters
Strong breakouts
Smart Buy / Smart Sell accuracy highest
👉 Use only Smart signals in this session
🥉 NEW YORK SESSION (Early Part Only)
🕒 6:00 PM – 9:00 PM IST
Use when
Market State = Trending
Volatility = Active
MTF mostly same color
⚠️ Stop after 9:00 PM IST
❌ SESSIONS TO AVOID
🚫 TOKYO SESSION
🕒 5:30 AM – 10:30 AM IST
Low volatility
Sideways (purple candles)
Many fake reversals
🚫 SYDNEY SESSION
🕒 2:30 AM – 5:30 AM IST
Very low volume
Not suitable for scalping
🚫 INDIAN MIDDAY
🕒 11:00 AM – 12:15 PM IST
Choppy
Stop-hunting candles
📌 BEST DAILY ROUTINE (Follow This)
Time (IST) Action
9:15 – 10:30 ❌ Avoid (fake moves)
12:30 – 4:30 ✅ TRADE (Best zone)
6:00 – 8:30 ✅ TRADE (High accuracy)
After 9:00 ❌ Avoid
🧠 EASY MEMORY RULE (Your Style)
“LON → NY = MONEY” 💰
“ASIA = NO TRADE” ❌
🎯 FINAL RECOMMENDATION
If you want only ONE session:
👉 Trade ONLY: 12:30 PM – 4:30 PM IST
This will give:
Less stress
Higher win-rate
Cleaner Smart Buy/Sell signals
🇮🇳 BEST TRADING SESSIONS (INDIA – IST)
🥇 LONDON SESSION – BEST FOR INDIAN TRADERS
🕒 12:30 PM – 4:30 PM IST
✅ THIS IS THE BEST SESSION
Strong trend moves
High accuracy Smart Buy / Smart Sell
Less sideways (purple candles reduce)
Works perfectly with Supertrend + EMA 200
👉 Use this as your MAIN session
🥈 LONDON → NEW YORK OVERLAP (POWER SESSION)
🕒 6:00 PM – 8:30 PM IST
✅ Very strong moves
Institutional activity
Best breakouts
High RR trades (2:1 / 3:1)
⚠️ Trade only Smart Buy / Smart Sell
⚠️ Avoid over-trading
🥉 INDIAN MARKET OPEN (LIMITED USE)
🕒 9:20 AM – 10:15 AM IST
✔ Use only if:
Dashboard = Trending
Volatility = Active
Direction same as higher TF
❌ Avoid after 10:30 AM
❌ SESSIONS TO AVOID (INDIA)
Session Time (IST) Reason
Tokyo 5:30 – 10:30 AM Sideways / fake moves
Mid-day Chop 11:00 – 12:15 PM Low volume
Late NY After 9:00 PM Whipsaws
📌 BEST DAILY ROUTINE (INDIA)
Time What to Do
9:15 – 9:20 ❌ No trade
9:20 – 10:15 ⚠️ Only clean Smart signals
12:30 – 4:30 ✅ MAIN TRADING WINDOW
6:00 – 8:30 ✅ HIGH PROBABILITY
After 9:00 ❌ Stop trading
🧠 EASY MEMORY RULE
“INDIA → LONDON → MONEY” 💰
“ASIA MIDDAY → NO TRADE” ❌
🎯 FINAL ANSWER (ONE-LINE)
👉 For India (IST), trade ONLY between
12:30 PM – 4:30 PM and 6:00 PM – 8:30 PM
