Pesquisar nos scripts por "BTC"

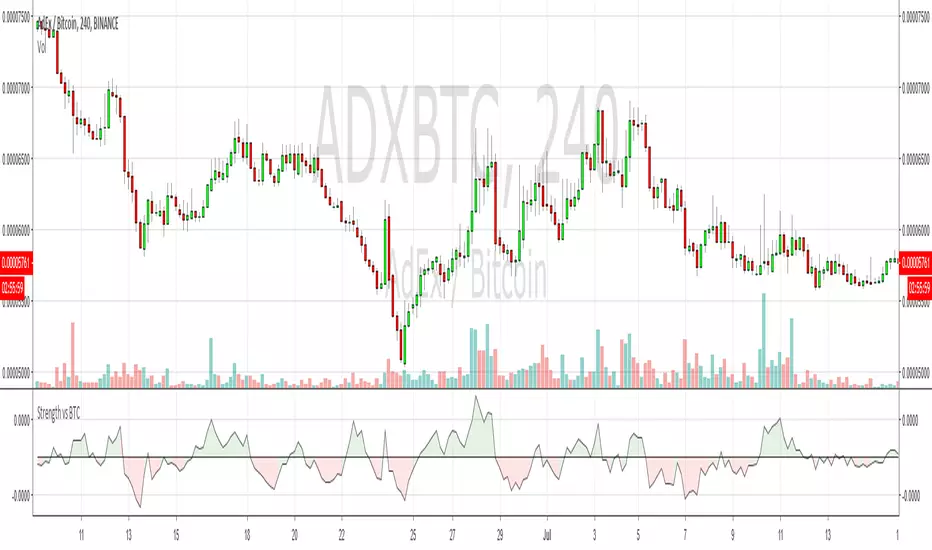
Strength Relative to BTCShows strength of the currently charted alt compared to BTCUSD. If BTC is going down or sideways and the alt is going up, then you'll see green and vice-versa for red. Good for quick at-a-glance strength evaluation when flying through a watchlist. The output uses a normalised moving average to reduce signal noise.
1 HOUR Trend Friend (BTC)Trend Friend V.1.
-The Trend Friend indicator is tuned for 1 HOUR timeframe (BTC) only to capture the overall trend.
-Signals are meant to be possible entries and profit taking opportunities
-No strategy is 100%
-Fib Band width can be adjusted for instrument and volatility
ABOVE BASIS (Uptrend)
Long signals = buy and hold bias
Short signals = take profit OR scalp opportunities
Price drops below basis, exit Long position
BELOW BASIS (Downtrend)
Short signals = Short and hold bias
Long signals = take profit OR scalp opportunities


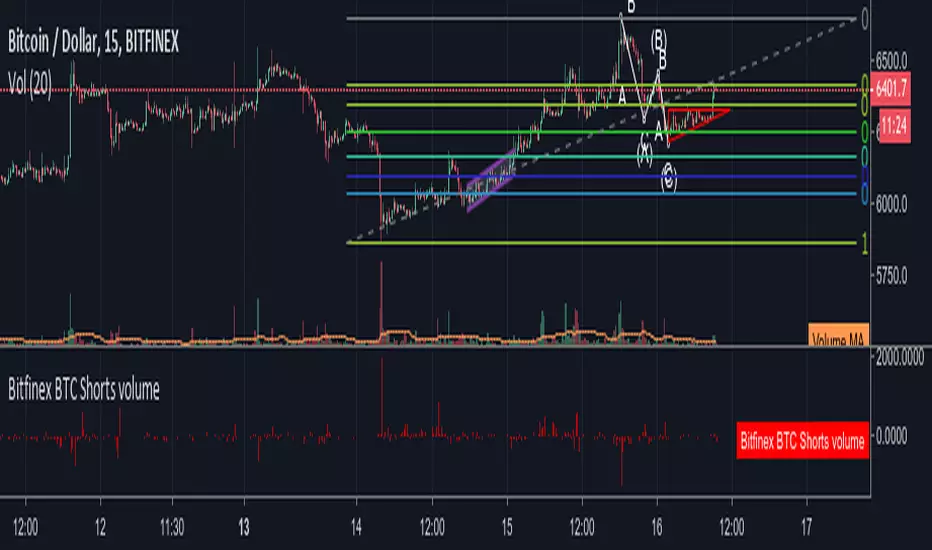
Bitfinex BTC longs vs Short & RatioSince the last BTC Short Squeeze on Bitmex maintenance I decided to made a Indicator plotting Long:Short ratio, and their respective graphs.
Green = Longs
Red = Shorts
Black = Ratio (Longs:Shorts)*Close <= Close price just for chart normalization!
I hope you find it useful.
NOTE: It isn't a prospective indicator, but try to find out who's bitching the market and when ;p
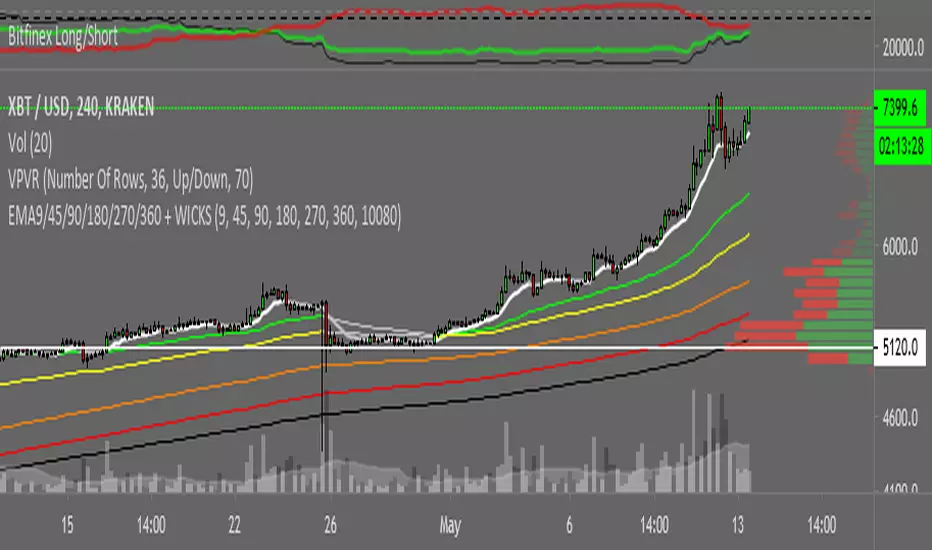
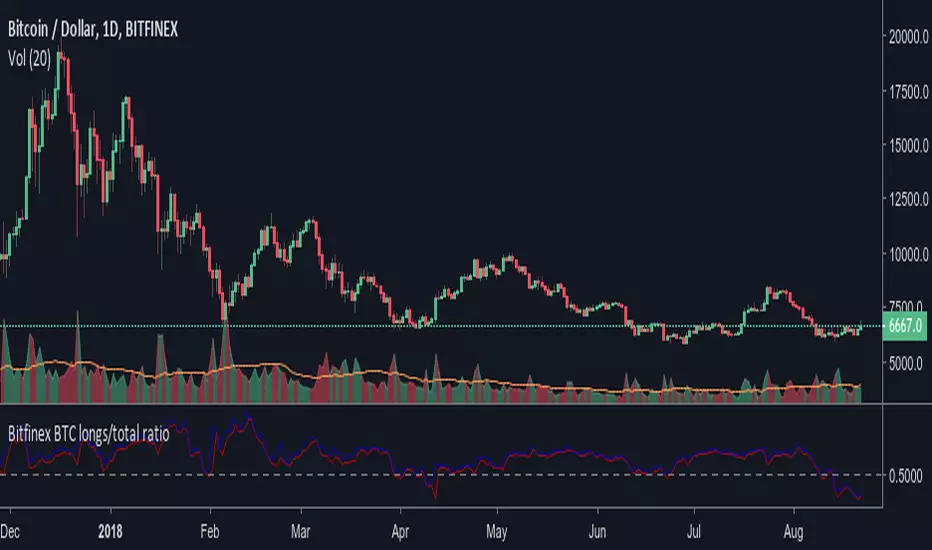
Bitfinex BTC longs/total ratioRatio of bitfinex longs versus the total btc in positions. Maybe a good indicator of market sentiment. It allows you to see too where were people taking profit or closing positions. Remember that ratio going up doesn't necesarily mean more longs positions are being added. It could mean shorts are closing position massively. The conversely is also true.
The rate above 0.5 doesn't necesarily bullish, though, and the indicator is "timeframe" agnostic. So take into account that there could be tons of longs positions that were opened since back before summer 2017, It seems to be too of positions opened at prices below 4.000$. That's why the average seems to be around 0.6.
The blue lines indicates current ratio (or on close for past bars). The red line is the max ratio (higher shorts versus lowest longs).
TPA BTC Chart
We created this chart to compare the Altco Saturn chart with the Bitcoin chart of the same time zone. The source of this chart is BITSTAMP: BTCUSD.
동시간대의 비트트코인 차트와 알트사토시 차트를 비교하기 위해 만들었습니다.이 차트의 소스는 BITSTAMP:BTCUSD 입니다.

Bitfinex BTC Shorts histogramDifference between the BTC amount of short positions at every candle, respect to the previous one, plotted as an histogram.
Neo BitMEX Futures Hedge Grid Alerts Premium v1.0This indicator was made to streamline finding the optimal entry to cash and carry/hedge on a futures contract when margin trading.
Explanation of the indicator:
This indicator has built-in alert conditions that you can use to give you email alerts, in-browser sound alerts, or SMS alerts. These alerts are based upon futures prices being in contango or backwardation.
From top to bottom, the grid shows XBTU18, XBTZ18, OkEx's Quarterlies (OKCOIN:BTCUSD3M), and CME's futures.
Red: Futures are trading above your defined range (default 1%) of spot
Maroon: Futures are trading above twice your defined range of spot
Lime: Futures are trading below your defined range (default 1%) of spot
Green: Futures are trading below twice your defined range of spot
What's configurable:
% to trigger
Grid size
Bar color toggle
Label toggle
Spot/index source (Bitfinex's BTCUSD, BitMEX's XBTUSD, and BitMEX's XBT Index are available)
Pricing:
Currently this standalone indicator is 0.007 BTC for lifetime use.
Example of use:
On 4 May 2018, BitMEX's XBTU18 was trading >2% above perpetual swap. The grid alerts signaled that and if one were long on bitcoin spot on any exchange, then it would have been a good idea to hedge a short on XBTU18. Eventually from there the premium gap was closed while bitcoin fell.
Here is the indicator shown with bar coloring and labels.

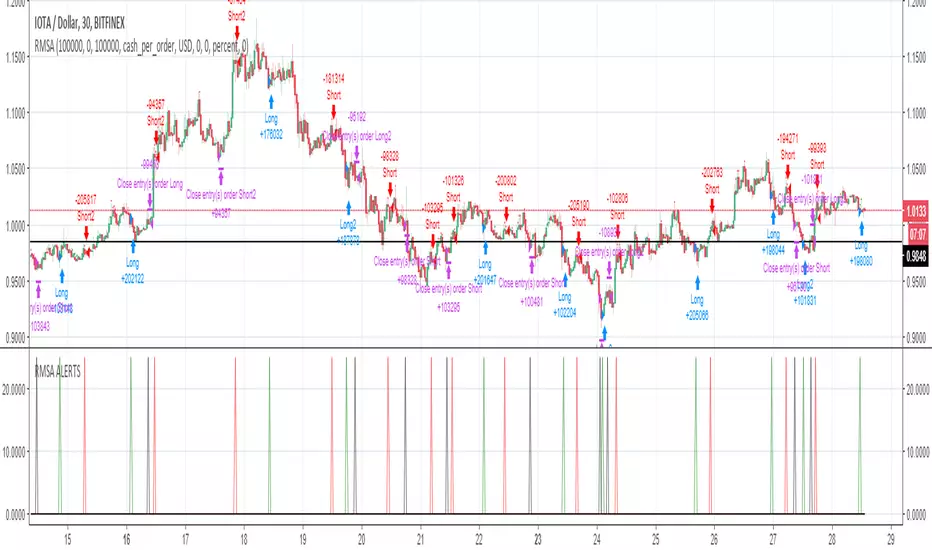
RMSA - Strategy - BTC/IOT/BCH/EOS - no repaint ALERTSHi Alerts for Strategy
Put alerts on Bar closed


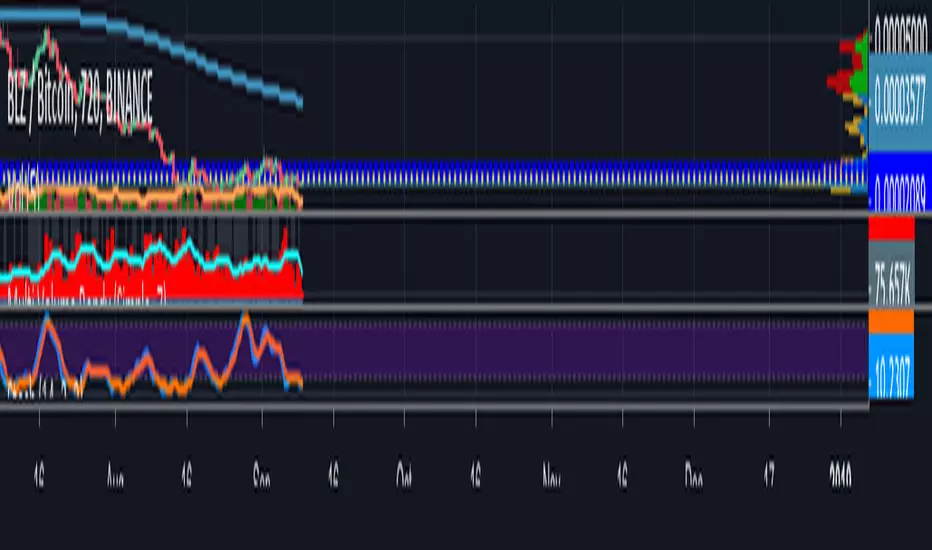
Volatility Across CoinsCompare the recent volatility of 8 cryptocurrencies, based on percentage change per candle.
Useful for volatility strategies to find the highest volatility coins over recent periods or to get an at-a-glance view of volatility correlations.
Options to change the resolution and find average % change per candle over user defined length.
Key:
BTC = Yellow/Gold
ETH = Purple
LTC = Gray
NEO = Green
IOTA = Light Blue
XMR = Orange
BCH = Red
Dash = Blue

Bimex Long Short PRO [PlungerMen]Hello!
This free community edition is very good for all time frame , for all the crypto
This Script recognized overbought area and over-selling area extremely accurate
This Script is very well used as it works by itself and very well used in conjunction with the "Bitmex scalping " script, both compliment for each other. the "Bitmex Scalping" script is Free, you can find it
If you want to be more accurate and more efficient, more comfortable when you do not want to see too many other indicators, you can register for our Professional edition.
- The Professional Edition supports Level 1 and Level 2 commands, which are very effective in allocating funds and optimizing your profits
Besides that,You will be supported by personal preferences, profit maximization
- Register for a Professional version will be used 2 Script,Bimex Scalping Pro and Bitmex Long Short Pro
- We will invite you to the signal channel with the announcement of the bottom and the peak of the BTC ,the big variable variable has exists
We hope you enjoy this script. Your support will help us develop more good quality scripts in the future to serve the community
**Remember, Like this script and posivite feedback if you are satisfied**
if you have any questions Plz post a comment ... below here
******
Thanks

Bitfinex BTC Delta Long & ShortShows short term changes in BTC/USDT Short and Long Positions and their difference to determine cost of a manipulative move.

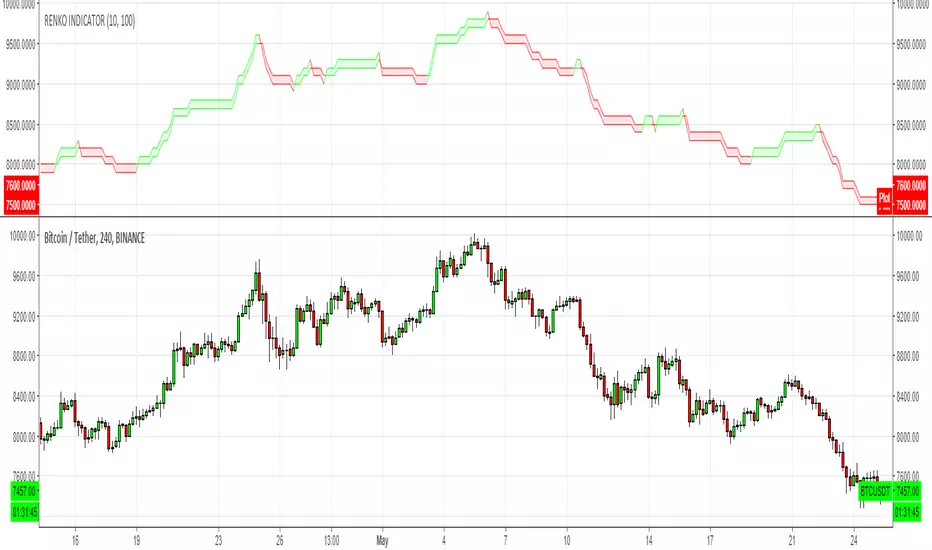
RENKO INDICATOR OVERLAY by CryptoJoncisA very simple and basic renko indicator for any time frame and ticker.
Please be aware, the minimum value for traditional renko box size = 0.0001 so if you are using this indicator for trading with cryptocurrencies, it might be better to use ATR for that.
Can be merged together with main chart for better performance.
Consider a tip if you find this helpful
BTC: 3FiBnveHo3YW6DSiPEmoCFCyCnsrWS3JBR
ETH: 0xac290B4A721f5ef75b0971F1102e01E1942A4578

GDAX Coin CorrelationPretty viz of how correlated/uncorrelated price of coins BTC ETH LTC BCH are on GDAX.
From the ref:
"Correlation coefficient. Describes the degree to which two series tend to deviate from their sma values."

Bull ComparisonBull Comparison is a script that compares the Bull trends for upto 10 coins. This could be dizzying, so for starters start with 3 coins and turn off the 7 remaining in the settings. Default 3 coins are BNB, BTC, ETH USDT. User can customize the coins they want to check, just follow the format in the settings - to see if there is meaningful correlation with other pairs.

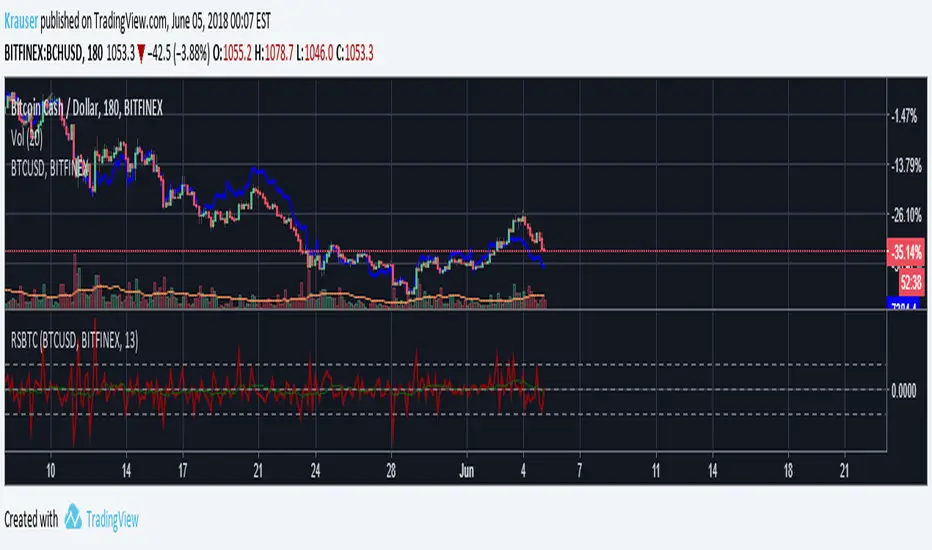
relative strength to BTCMeasure the relative strength of a crypto compared to Bitcoin.
Pair trading strategy:
Pairs trading is a strategy in which a trader matches long and short positions of two stocks that are perceived to have a strong correlation to each other and are currently trading outside of their historical relative strength range.
Formula:
a: tickerid, the crypto selected
b: BTCUSD Bitfinex
as: security a, (close-close )/close *100+100)
bs: BTC, (close-close )/close *100+100)
rs= (as-bs)/bs*1000
Green line is a moving average.