CCV Crypto Margin Positions Via BitfinexAllows you to change between multiple assets to see open longs versus shorts. Includes BTC, ETH, LTC, TRX and more. You can also choose the quote pair of USD or BTC to get an idea for Bitmex assets as well. If you choose BTC on a BTC quote the USD positions will appear. All other assets will show the BTC paired positions.
Like and follow for more free scripts in the future.
Pesquisar nos scripts por "BTC"

100+ BTC Tracker + 182-Day Dormant (6-Month HODL)Instantly see what the biggest Bitcoin whales are doing — and exactly how much of the supply has been completely untouched for 6 full months or longer (182+ days), the strictest and most respected definition of true HODLing.
What this indicator shows you in real time:
Number of wallets holding ≥100 BTC (~15,800 whales)
Total Bitcoin controlled by these whales (~3.25 million BTC)
6-Month Dormant Supply — Bitcoin that hasn’t moved in 182+ days (~14.1 million BTC)
6-Month Dormant % — What percentage of circulating supply is truly locked away
Why 182 days matters:
The 6-month threshold (≈182 days) is the industry-standard cutoff used by Glassnode, CryptoQuant, and analysts worldwide to define ultra-long-term holders. These are the coins least likely to ever hit exchanges — the ultimate measure of conviction and scarcity.
Key features:Live or fallback? — Instantly know if you’re seeing real-time on-chain data (green) or verified backup values (yellow)
Works on free accounts — No paid data subscription required (though it becomes even more accurate with Glassnode/CryptoQuant add-ons)
Clean, non-intrusive design — Three bold plots + sleek dark table in the top-right corner
Always up to date — Fallback values manually verified as of November 21, 2025
Perfect for:
Spotting whale accumulation/distribution phases
Tracking real Bitcoin scarcity during bull or bear markets
Confirming long-term holder conviction before big moves
Add it to any BTC chart and instantly understand who really controls Bitcoin — and how much of it is locked away forever by the strongest hands in crypto.

Scalp BTC/ETH — Reversal & Continuation (v1, Pine v6)Scalp BTC/ETH — Reversal & Continuation (1m à 10m)
Cet indicateur détecte des opportunités de micro-scalping sur futures (BTC/ETH) basées sur deux mécaniques courtes validées par structure de prix :
A) Reversal de pression (contre-mouvement contrôlé)
Détection d’une sur-extension brutale suivie d’une absorption sur la bougie suivante.
Objectif : capturer la première respiration après un excès de prix (rejet court).
B) Continuation courte (momentum + reprise)
Détection de 3 bougies directionnelles consécutives suivies d’un pullback léger, puis signal sur la reprise du mouvement initial.
Gestion intégrée (scénario standard TP dynamique)
TP1 → 50% de la position à un gain fixe (% adaptable au timeframe)
Stop déplacé au Break-Even sur le restant
Sortie finale sur bougie inverse significative
(correction ≥ X% du corps précédent) ou timeout (max bars en trade)
Scalp BTC/ETH — Reversal & Continuation (1m to 10m)
This indicator detects short-term futures scalping setups on BTC & ETH using two mechanical price-action models designed for fast execution:
A) Reversal Compression (counter-move entry)
Identifies a sharp impulse (overextension) followed by absorption / failure to extend on the next candle.
Objective: capture the first corrective pullback after exhaustion.
B) Controlled Continuation (momentum follow-through)
Identifies 3 consecutive trend candles, then a shallow pullback, and triggers an entry on the resumption of the main leg.
Built-in trade logic (dynamic TP structure)
TP1 → scale out 50% of the position at a fixed percentage (auto-scaled per timeframe)
Stop moved to Break-Even after TP1
Final exit on either:
• a meaningful opposite candle (≥ X% correction of prior body), or
• a timeout (max bars in trade)
Technical characteristics
Designed for 1m / 3m / 5m / 7m / 10m
No repainting (bar-close confirmed logic)
Works for both LONG & SHORT
Built-in alert events:
ENTRY_LONG / ENTRY_SHORT / TP1 / EXIT_STOP / EXIT_INVERSE / EXIT_TIMEOUT
Suitable for manual execution, semi-automation (alerts) or full bot integration (webhook JSON)
Purpose
Provide a repeatable, rule-based, non-subjective framework to harvest micro-moves with controlled risk, without relying on lagging indicators or long-term prediction.
(A Strategy / backtesting version is planned as a next iteration.)

NUPL Z-Score | Vistula LabsWhat is NUPL?
NUPL (Net Unrealized Profit/Loss) is a fundamental on-chain metric used to evaluate the profit or loss state of a cryptocurrency's market participants, such as Bitcoin (BTC) and Ethereum (ETH). It compares the current market capitalization—the total value of all coins at their current price—to the realized capitalization, which represents the average price at which all coins were last transacted on-chain.
Market Capitalization: Current price × circulating supply.
Realized Capitalization: The sum of the value of all coins based on the price at their last on-chain movement.
For Bitcoin (BTC):
NUPL = (Market Cap - Realized Cap) / Market Cap * 100
For Ethereum (ETH):
NUPL = (Market Cap - Realized Cap) / Market Cap
A positive NUPL indicates that the market holds unrealized profits, meaning the current value exceeds the price at which coins were last moved. A negative NUPL signals unrealized losses. Extreme NUPL values—high positives or low negatives—can suggest overvaluation (potential market tops) or undervaluation (potential market bottoms), respectively.
How NUPL is Calculated for BTC & ETH
This indicator calculates NUPL using data sourced from Glassnode and CoinMetrics:
For Bitcoin:
Market Cap: GLASSNODE:BTC_MARKETCAP
Realized Cap: COINMETRICS:BTC_MARKETCAPREAL
Formula: ((btc_market_cap - btc_market_cap_real) / btc_market_cap) * 100
For Ethereum:
Market Cap: GLASSNODE:ETH_MARKETCAP
Realized Cap: COINMETRICS:ETH_MARKETCAPREAL
Formula: ((eth_market_cap - eth_market_cap_real) / eth_market_cap) * 100
The indicator then transforms these NUPL values into a Z-Score, which measures how many standard deviations the current NUPL deviates from its historical average. The Z-Score calculation incorporates:
A customizable moving average of NUPL (options: SMA, EMA, DEMA, RMA, WMA, VWMA) over a user-defined length (default: 220 periods).
The standard deviation of NUPL over a specified lookback period (default: 200 periods).
Z-Score Formula:
Z-Score = (Current NUPL - Moving Average of NUPL) / Standard Deviation of NUPL
This normalization allows the indicator to highlight extreme market conditions regardless of the raw NUPL scale.
How This Indicator Can Be Used
Trend Following
The NUPL Z-Score indicator employs a trend-following system with adjustable thresholds to generate trading signals:
Long Signals: Triggered when the Z-Score crosses above the Long Threshold (default: 0.26).
Short Signals: Triggered when the Z-Score crosses below the Short Threshold (default: -0.62).
Visual Representations:
Green up-triangles: Indicate long entry points (plotted below the bar).
Red down-triangles: Indicate short entry points (plotted above the bar).
Color-coded elements:
Candles and Z-Score plot turn teal (#00ffdd) for long positions.
Candles and Z-Score plot turn magenta (#ff00bf) for short positions.
These signals leverage historical NUPL trends to identify potential momentum shifts, aiding traders in timing entries and exits.
Overbought/Oversold Conditions
The indicator flags extreme market states using additional thresholds:
Overbought Threshold (default: 3.0): When the Z-Score exceeds this level, the market may be significantly overvalued, hinting at potential selling pressure. Highlighted with a light magenta background (#ff00bf with 75% transparency).
Oversold Threshold (default: -2.0): When the Z-Score drops below this level, the market may be significantly undervalued, suggesting buying opportunities. Highlighted with a light teal background (#00ffdd with 75% transparency).
These extreme Z-Score levels have historically aligned with major market peaks and troughs, making them useful for medium- to long-term position management.
Customization Options
Traders can tailor the indicator to their preferences:
Cryptocurrency Source: Choose between BTC or ETH.
Moving Average Type: Select from SMA, EMA, DEMA, RMA, WMA, or VWMA.
Moving Average Length: Adjust the period for the NUPL moving average (default: 220).
Z-Score Lookback Period: Set the historical window for Z-Score calculation (default: 200).
Thresholds: Fine-tune values for: Long Threshold (default: 0.26), Short Threshold (default: -0.62), Overbought Threshold (default: 3.0), Oversold Threshold (default: -2.0)
These options enable users to adapt the indicator to various trading strategies and risk profiles.
Alerts
The indicator supports four alert conditions to keep traders informed:
NUPL Long Opportunity: Alerts when a long signal is triggered.
NUPL Short Opportunity: Alerts when a short signal is triggered.
NUPL Overbought Condition: Alerts when the Z-Score exceeds the overbought threshold.
NUPL Oversold Condition: Alerts when the Z-Score falls below the oversold threshold.
These alerts allow traders to monitor key opportunities without constantly watching the chart.

IBD Style Relative Strength RatingWelcome to the IBD Style Relative Strength Rating Indicator!
A powerful tool inspired by Investor's Business Daily (IBD), this indicator helps traders evaluate stock performance relative to a benchmark. It’s perfect for identifying strong or weak stocks compared to the broader market, specifically the S&P 500 (SPY). Whether you're a beginner or an experienced investor, this guide will walk you through its features and key concepts, including the RS Line and RS Rating, and how legendary trader Mark Minervini uses similar tools.
Understanding the RS Line & RS Rating
RS Line (Relative Strength Line)
A visual representation of how a stock’s price performs relative to SPY.
Calculated by dividing the stock’s closing price by SPY’s closing price and multiplying by 100.
Rising RS Line → Stock is outperforming SPY.
Falling RS Line → Stock is underperforming SPY.
Helps identify strength or weakness compared to the market.
RS Rating
A numerical score (1-99) measuring stock performance over 252 trading days (1 year) relative to SPY.
Above 80 → Top 20% of performers.
Above 90 → Top 10% (ideal for growth investors).
Weighted average of stock’s price changes over 63, 126, 189, and 252 days.
Key Features Explained
RS Line Color Mode:
Static (default white) or Dynamic (green when rising, red when falling) for quick trend identification.
Comparative Symbol:
Default: SPY. Can be changed to NASDAQ:NDX, AAPL, or other indices/stocks.
Ensure selected symbols have sufficient historical data.
Plot RS New Highs: Marks new 250-day highs with subtle blue circles
Indicates a stock significantly outperforming SPY (potential buy signal).
Plot RS New Lows: Marks new 250-day lows with red circles
Signals underperformance (possible sell or avoid indicator).
Lookback for Display: Adjustable up to 2000 bars for historical trend analysis.
RS Rating Color Scheme
Green: Upward trend (improving RS Rating).
Orange: Neutral/mixed trend.
Red: Downward trend (declining RS Rating).
Dynamic Color Settings
Rising Line Color: Green (default), customizable.
Falling Line Color: Red (default), adjustable.
Advanced Options
Enable Replay Mode: Uses fixed percentile values for consistent RS Rating calculations in backtesting.
RS Rating Table
Displays current RS Rating and values from previous day, week, and month in the top-right corner (daily charts).
Background color reflects trend: Green (up), Orange (neutral), Red (down).
Past values appear in neutral gray for a quick performance snapshot.
How Mark Minervini Uses This Indicator
Mark Minervini, a legendary trader, emphasizes Relative Strength as a core strategy:
Looks for stocks with:
Rising RS Line.
RS Rating above 80-90 (top performers).
RS New Highs to spot breakout candidates.
Avoids stocks with:
Declining RS Line.
RS Rating below 70.
Important Information for Beginners
RS vs. SPY
The indicator compares stock performance against SPY (S&P 500).
Rising RS Line → Stock is beating SPY.
Falling RS Line → Stock is lagging.
Why Use This Indicator?
Helps find strong relative strength stocks, crucial for bullish trends.
New highs/lows on the RS Line signal significant shifts.
The RS Rating quantifies percentile-based performance.
Customization Options
Adjust colors, lookback periods, and marker sizes to match your trading style.
Default SPY comparison is ideal for U.S. traders but can be customized.
Timeframe Considerations
Optimized for daily charts.
Weekly/monthly charts may have limited data availability.
Tips for Crypto Traders (Measuring Altcoins vs. Bitcoin or Total Market Cap)
If trading cryptocurrencies, this indicator can measure altcoins vs. Bitcoin (BTC) or the total crypto market cap (TOTAL):
Comparative Symbol Setup:
Set Comparative Symbol to BTCUSD to compare an altcoin (e.g., ETHUSD) against Bitcoin.
Rising RS Line → The altcoin is outperforming Bitcoin (bullish signal).
Use TOTAL (crypto market cap index) to assess an altcoin’s strength against the total market.
High RS Rating suggests the altcoin is a market leader.
Adjust Look-back Periods:
Crypto markets are volatile, so reduce Look-back for New Highs/Lows to 50-100 bars (about 2-4 months) for shorter-term trends.
Fine-tune based on your trading strategy.
New Highs and Lows:
Watch for new RS Line highs (blue dots) to identify altcoins breaking out against BTC or TOTAL (momentum trading).
New lows (red dots) may signal weakening altcoins to avoid.
RS Rating Interpretation:
Above 80 against BTC or TOTAL → The altcoin is a strong performer.
This aligns with Minervini’s growth strategy for stocks.
Color Dynamics:
Use Dynamic RS Line Color (green for rising, red for falling) to quickly spot altcoin trends against BTC or TOTAL.
Crypto data may have gaps—test indicator settings on different timeframes (e.g., 1-hour or 4-hour charts).
Tips for Getting Started
Apply the Indicator to a stock chart and set Comparative Symbol to SPY.
Watch the RS Line:
If trending upward with new highs and RS Rating > 80, it's a strong candidate.
Use the RS Rating Table to check for trend consistency.
Adjust Opacity Settings for markers to balance visibility and clarity.
This indicator is now ready for public use as of March 18, 2025. Enjoy trading with enhanced insights, and feel free to share feedback or suggestions for future updates!

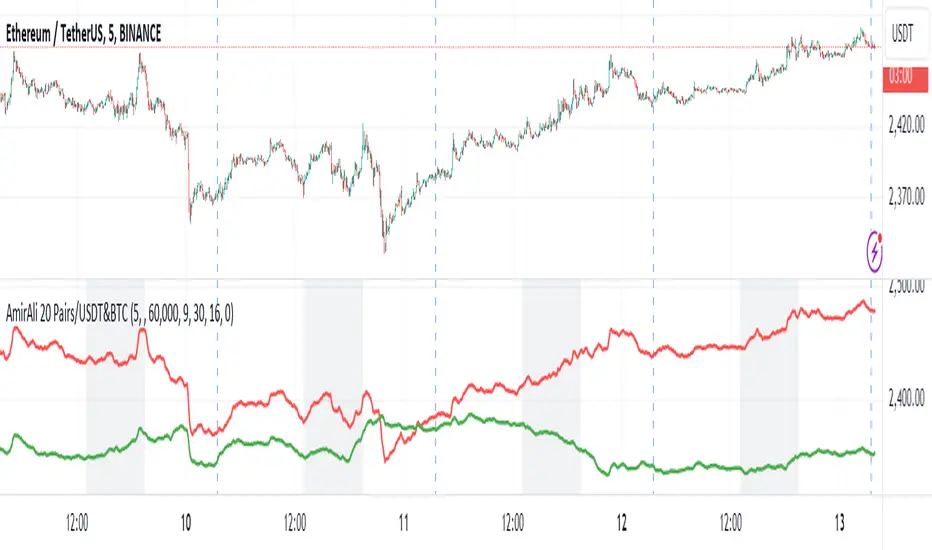
AmirAli 20 Pairs/USDT&BTCThis TradingView indicator, titled "20 Pairs/USDT&BTC," is designed to analyze and display the Exponential Moving Averages (EMAs) of various cryptocurrency pairs against USDT and BTC. Here's a detailed breakdown of its features, functionality, and usage:
Key Features:
Pairs Display: The indicator allows users to select which cryptocurrency pairs they wish to display on the chart. The available options include popular cryptocurrencies such as Ethereum (ETH), Binance Coin (BNB), Solana (SOL), Dogecoin (DOGE), Ripple (XRP), Litecoin (LTC), Polkadot (DOT), Avalanche (AVAX), Uniswap (UNI), Chainlink (LINK), Cardano (ADA), Cosmos (ATOM), Filecoin (FIL), Stellar (XLM), VeChain (VET), Enjin (ENJ), Celo (CELO), Hedera (HBAR), and Sandbox (SAND).
Dynamic Price Retrieval: For each selected pair, the indicator retrieves the closing prices for both USDT and BTC from Binance. This is done using the request.security function, which fetches real-time data.
EMA Calculation: The indicator calculates and plots the EMA for each cryptocurrency pair over a user-defined length, allowing traders to identify trends and potential buy/sell signals based on price movements relative to their EMAs.
User Customization: Users can customize several parameters, including the time frame for data retrieval, EMA length, and the visibility of each pair.
Market Hours Visualization: The indicator highlights the trading hours with a gray background, helping users identify when the market is active.
How to Use the Indicator:
Adding the Indicator: To use the indicator, add it to your TradingView chart by searching for "20 Pairs/USDT&BTC" in the public library or by pasting the provided Pine Script code into a new indicator script.
Select Pairs: Enable or disable specific cryptocurrency pairs in the input options at the top of the script. For example, if you want to analyze ETH and ADA, ensure that the respective boxes are checked.
Adjust Time Frame: Set the time frame for the indicator. You can choose any time frame or leave it blank to use the current chart's time frame.
Set EMA Length: Choose the length for the EMA calculation based on your trading strategy. A shorter EMA (e.g., 5) reacts more quickly to price changes, while a longer EMA (e.g., 20) smooths out price fluctuations.
Observe Trends: Monitor the plotted EMAs for the selected pairs. Crossovers of the price with the EMA can indicate potential buy or sell signals. For instance, if the price crosses above the EMA, it may signal a bullish trend, whereas a crossover below could indicate a bearish trend.
Consider Market Hours: Pay attention to the gray background during U.S. trading hours, as this may indicate higher volatility and trading opportunities.
Conclusion
The "20 Pairs/USDT&BTC" indicator is a powerful tool for cryptocurrency traders looking to analyze multiple pairs simultaneously. By providing a visual representation of EMAs, it aids in identifying trends and potential trading opportunities in a user-friendly manner. Make sure to adapt the settings according to your trading strategy and market conditions for optimal results.
Amir Hasankhah & Ali Beyki
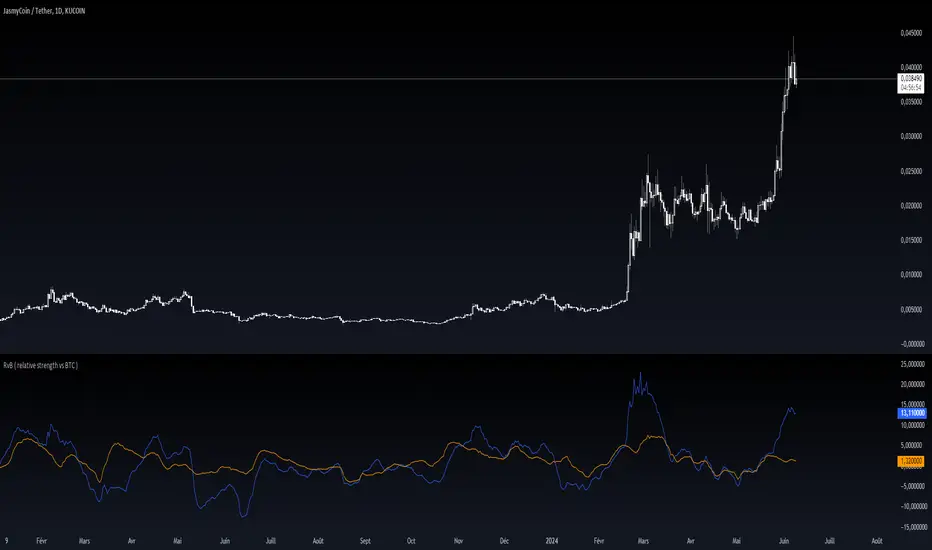
RvB ( relative strength vs BTC ) Overview
The "Coin vs BTC" indicator is designed to compare the performance of a selected cryptocurrency against Bitcoin (BTC) using Exponential Moving Averages (EMAs). By plotting the difference in EMA values as a percentage, this indicator helps traders visualize the relative strength of a cryptocurrency compared to Bitcoin over specified periods.
How It Works
EMA Calculation: The indicator calculates two EMAs (lengths specified by the user) for both the selected cryptocurrency and Bitcoin (BTC).
Length 1: Fast EMA (default: 9)
Length 2: Slow EMA (default: 21)
Score Calculation:
For both the selected coin and Bitcoin, it computes a score representing the percentage difference between the fast and slow EMAs relative to the previous closing price. This is done using the following steps:
Calculate the difference between the fast and slow EMAs.
Compute the percentage of this difference relative to the previous closing price.
Round the percentage to two decimal places for clarity.
Plotting: The scores for both the selected cryptocurrency and Bitcoin are plotted on the same chart:
Coin Score: Displayed in blue.
BTC Score: Displayed in orange.
Potential Uses
Relative Strength Analysis:
This indicator helps traders compare the strength of a cryptocurrency against Bitcoin. A higher score for the selected coin compared to Bitcoin indicates it is performing better relative to its moving averages.
Trend Confirmation:
By observing the EMA differences, traders can confirm trends and potential reversals. Consistently higher scores may indicate a strong upward trend, while lower scores could suggest a weakening trend.
Market Comparison:
This tool is particularly useful for those looking to understand how their selected cryptocurrency is performing in the broader market context, especially in relation to Bitcoin, which is often considered a market benchmark.
NUPL - Net Unrealized Profit-Loss BTC Tops/Bottoms [Logue]Net Unrealized Profit Loss (NUPL) - The NUPL measures the profit state of the bitcoin network to determine if past transfers of BTC are currently in an unrealized profit or loss state.
Values above zero indicate that the network is in overall profit, while values below zero indicate the network is in overall loss. Highly positive NUPL values indicate overvaluation of the BTC network and relatively negative NUPL values indicate an undervaluation of the BTC network.
For tops: The default setting for tops is based on decreasing "strength" of BTC tops. A decreasing linear function (trigger = slope * time + intercept) was fit to past cycle tops for this indicator and is used as the default to signal macro tops. The user can change the slope and intercept of the line by changing the slope and/or intercept factor. The user also has the option to indicate tops based on a horizontal line via a settings selection. This horizontal line default value is 73. This indicator is triggered for a top when the NUPL is above the trigger value.
For bottoms: Bottoms are displayed based on a horizontal line with a default setting of -13. The indicator is triggered for a bottom when the NUPL is below the bottom trigger value.

MicroStrategy MetricsA script showing all the key MSTR metrics. I will update the script every time degen Saylor sells some more office furniture to buy BTC.
All based around valuing MSTR, aside from its BTC holdings. I.e. the true market cap = enterprise value - BTC holdings. Hence, you're left with the value of the software business + any premium/discount decided by investors.
From this we can derive:
- BTC Holdings % of enterprise value
- Correlation to BTC (in this case we use CME futures...may change this)
- Equivalent Share Price (true market cap divided by shares outstanding)
- P/E Ratio (equivalent share price divided by quarterly EPS estimates x 4)
- Price to FCF Ratio (true market cap divided by FCF (ttm))
- Price to Revenue (^ but with total revenue (ttm))

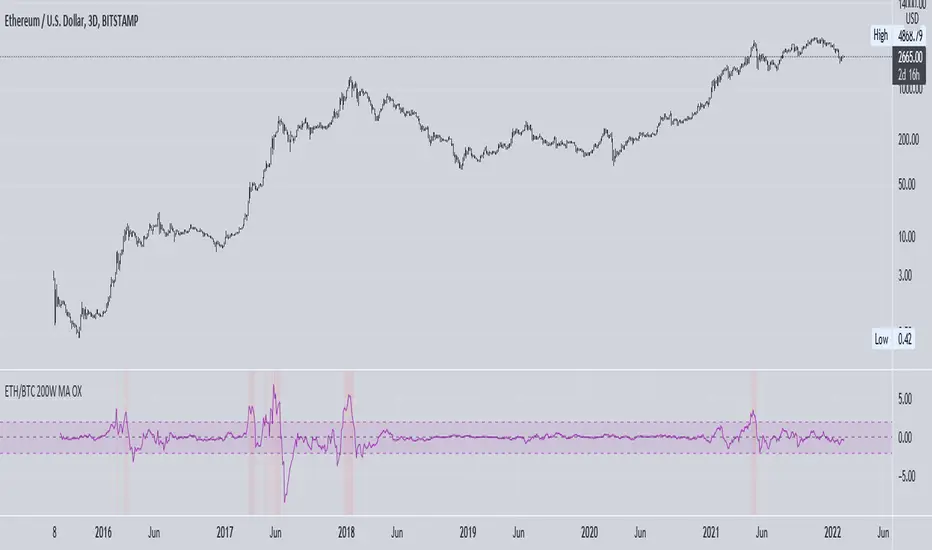
ETH vs BTC 200W SMA OverextensionHistorically, when BTC suffers a correction and ETH continues to rally, this hints at an impending market-wide correction. In Jan 2018, ETH rallies while BTC corrects, signalling the end of the bull cycle. In May 2021, ETH rallies while BTC ranges between $50-$60k, then a major correction occurs. This indicator attempts to monitor this phenomenon in order to help spot potential macro tops in the cryptocurrency market.
The indicator takes the price of the asset and divides it by the 200 week SMA value. This gives an over/undervaluation in percentage terms. When ETH becomes significantly more overvalued relative to BTC, the indicator will warn of a potential top forming (see red shaded areas).
This is for edutainment purposes only. Don't make financial decisions based on this indicator.
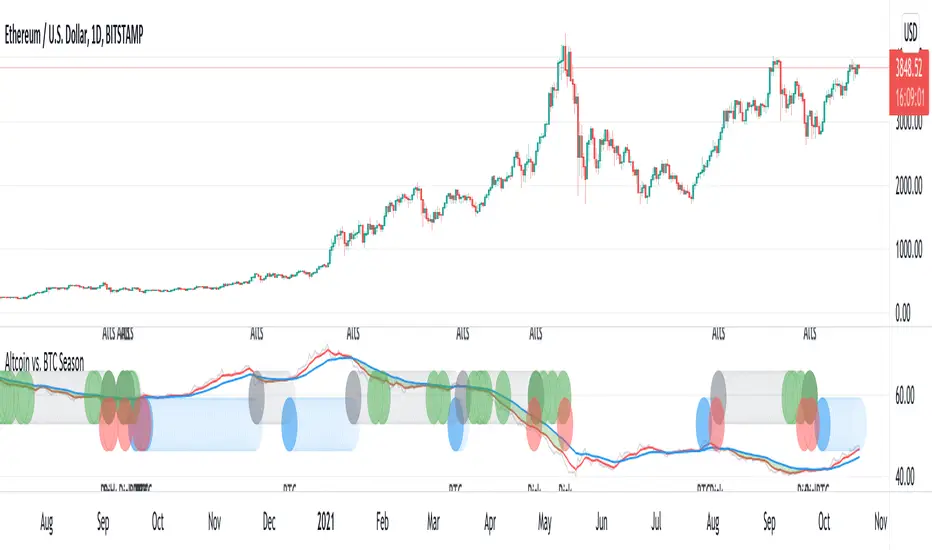
Altcoin vs. BTC SeasonUsing BTC dominance to identify BTC vs. Altcoin season.
Blue: BTC season
Gray: Altcoin season
Green: Altcoin at support - entry with good risk/reward
Red: Potential BTC downside risk
3GBH BTC DOM vs MCBitcoin Market Cap vs Dominance
- data normalized with RSI
Included in this indicator:
- RSI of BTC Market Cap
- RSI of BTC Dominance
- EMA of BTC Market Cap
- EMA of BTC Domiance
-----
Dominance influences the market. Is money flowing into Bitcoin?
-----
EMA's to help with Technical Analysis.
-----
User-friendly.
You can change all the inputs, they are labelled for ease-of-use.
You can toggle On/Off any or all of the options.

Moving Average BandsUse this script to find buy and sell zones for BTC based on momentum of the move relative to the average asset price over a given period. The script plots a series of offset bands above and below the Simple Moving Average. When price crosses another band further from the SMA, the background is rendered brighter. The brighter the background, the stronger the buy and sell signal is, as the expectation is that price wants to return to the SMA. Settings are adjustable to fine tune to various time frames and assets. Good settings for BTC Daily are length 30, layers at 10, 20, 30, and 40.
On 1H BTC/USD I use length 200, layers at 5, 10, 15, 20 to find decent swing trading opportunities.
On BTC/USD 1D chart, combine with Bitcoin Logarithmic Growth Curve from @mabonyi (original by @quantadelic )for confluence of very reliable signals.

Kaya RSI BASED INFLATION INDICATORUse your own risk.
This indicator aims look inflation of your emita according to the BTC and XAU. Also you can use Dxy too. The main idea of behind of this indicator is rsi. But not normal rsi :).
For example. If green(XAU) line upper then xau going to up better than BTC and your emita. If red line (BTC) is upper, thats mean buying BTC can be more profitably. Blue line (named Normal means this is your emita) is upper that mean your emita is can be more profitably than the others. You can think opposite for lower situations.
Be aware this is not mean percent rising or declining. This is just understanding for which of them (relatively) moving how according to the rsi.
Maybe it can using for positons too. But I didnt test it. So be carefull.
Best Regards.

GBTC/BTC MACDGBTC created BTC's leading indicator theory.
GBTC / BTC (market capitalization) MACD is calculated.
It seems to be good to see more than daily.
GBTCはBTCの先行指標説を信じて作成しました。
GBTC/BTC(時価総額)のMACDを計算しています。
日足以上で見るのが良いと思われます。

🔗Blockchain Fundamentals - BTC Network Momentum - Cryptorhythms🔗Blockchain Fundamentals - Bitcoin Network Momentum by Cryptorhythms
Description
Network Momentum is a view created by PositiveCrypto which looks into the value transmitted through the Bitcoin blockchain denominated in BTC value plotted against Bitcoin`s price. It serves as a leading indicator of Bitcoin bull markets. Sufficiently high levels of value throughput is needed drive bull markets.
Network Momentum, if it was corrected for Bitcoin`s expanding token supply, would essentially be Bitcoin Velocity. In other words an inverse chart of NVT Ratio.
Bitcoin Network Momentum is another piece of the puzzle to help our understanding of Bitcoin fundamentals and their impact on price. Bitcoin Network Momentum looks at the relationship between Bitcoin’s price and the BTC value of daily transactions flowing through the blockchain.
It is important to note here that we are using the BTC daily value flowing through the blockchain, not the USD daily value which NVT Signal uses.
What we see when we look at this is that the BTC value of daily transactions acts as a leading indicator of Bitcoin’s major market phases.
Extras
We give you the option of changing the median price lookback length
👍 Enjoying this indicator or find it useful? Please give me a like and follow! I post crypto analysis, price action strategies and free indicators regularly.
💬 Questions? Comments? Want to get access to an entire suite of proven trading indicators? Come visit us on telegram and chat, or just soak up some knowledge. We make timely posts about the market, news, and strategy everyday. Our community isn't open only to subscribers - everyone is welcome to join.
For Trialers & Chat: t.me

Minimal Godmode LSMA (BTC)mgl btc v02
designed for use on BTC pairs/BTC trading ONLY (with the multi exchange option checked)
loading time for the indicator may be a bit long due to the amount of data being requested by the indicator for 6+ BTC pairs
Note: again, please read - designed for use on trading BTCUSD and XBTUSD pairs, ONLY (with the multi exchange option checked)
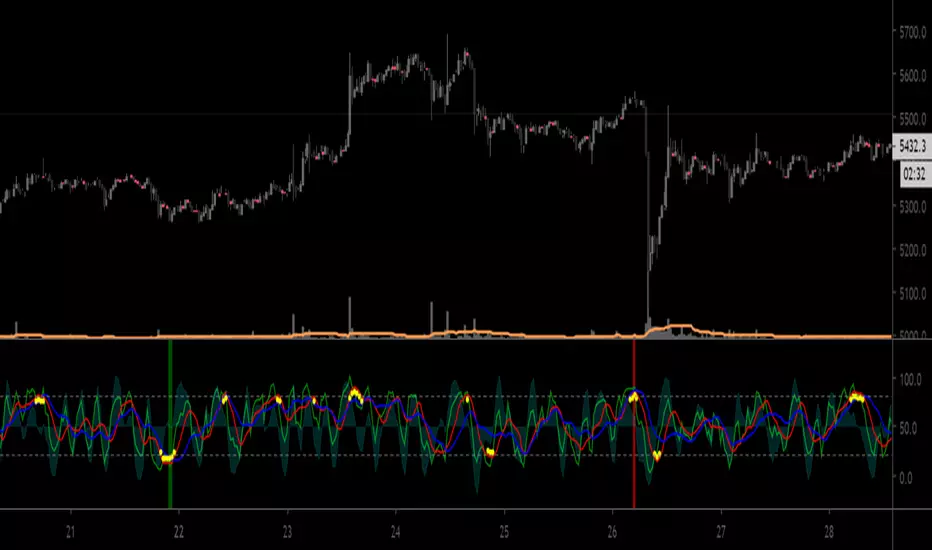
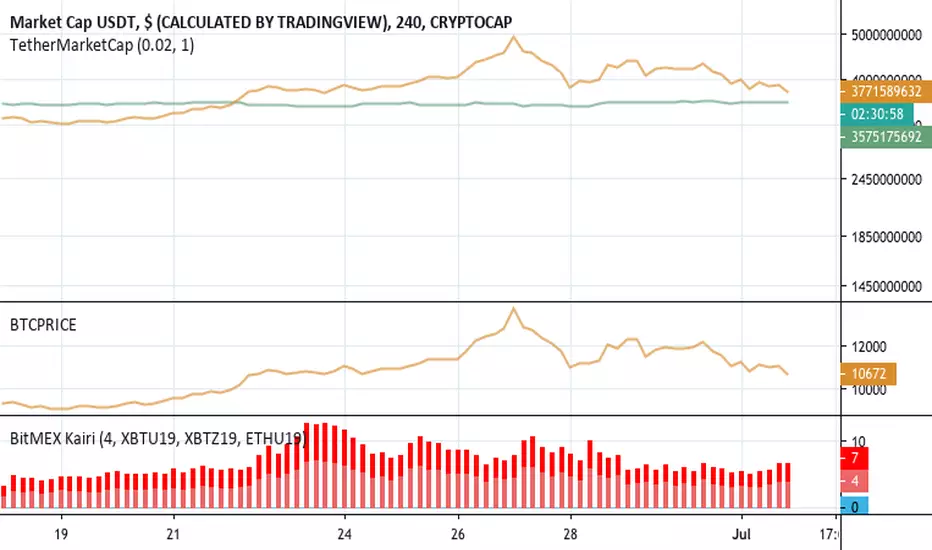
BitMEX KairiBitMEX Kairi
# Abstract
This script shows the divergence between BTC futures price and BTC actuals price of bitFlyer FX and BitMEX in percentage.
Usually, when people bought it or sold it too much on futures , the divergence between actuals and futures are getting expanding.
I believe this is really useful to find when the conversion of the trend happens.
Also supports USDT divergence too. If you wish to enable USDT mode, please check "Show only USDT divergence (Poloniex)" on the settings menu.
Enjoy :)
# Supports:
- BitMEX BTC Futures 3mo (orange)
- BitMEX BTC Futures 6mo (red)
- bitFlyer FX (blue)
- USDTUSD (Poloniex)
# Disclaimer:
This is a free script. Feedbacks are welcome! But I don't have any responsibility when this script has broken or something went wrong.
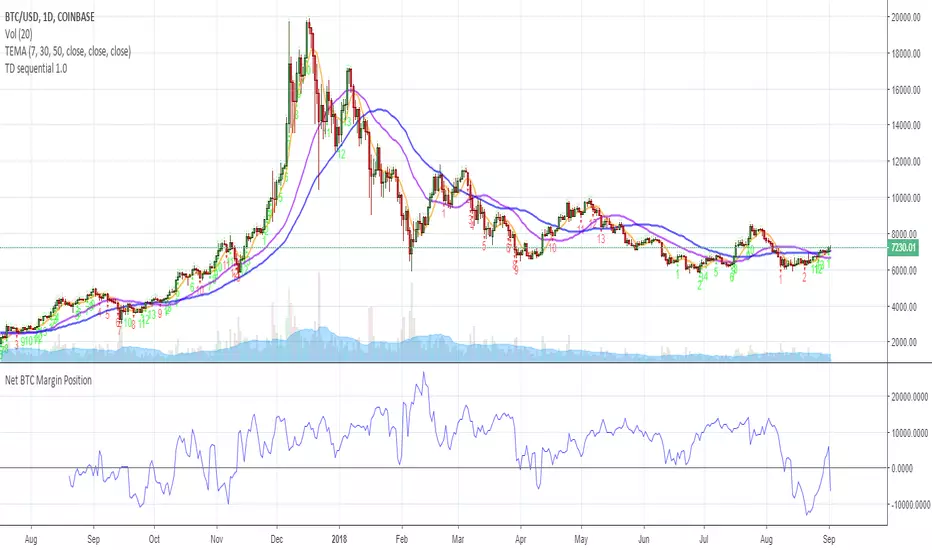
Net BTC Margin PositionTotal BTCUSDLONGS minus the BTCUSDSHORTS in order to give you the total outstanding BTC margin debt.
ie: If there are 50,000 BTC longs, and 40,000 BTC shorts, then 50,000 has been bought, and 40,000 sold, leaving us with 10,000 BTC net remaining to be sold to give us an overall neutral margin position.
That isn't to say that the net margin position must move towards zero, but it is a sensible reference point, and historical net values may provide useful insights into the current circumstances.
(Anyone know what category this script should be in?)
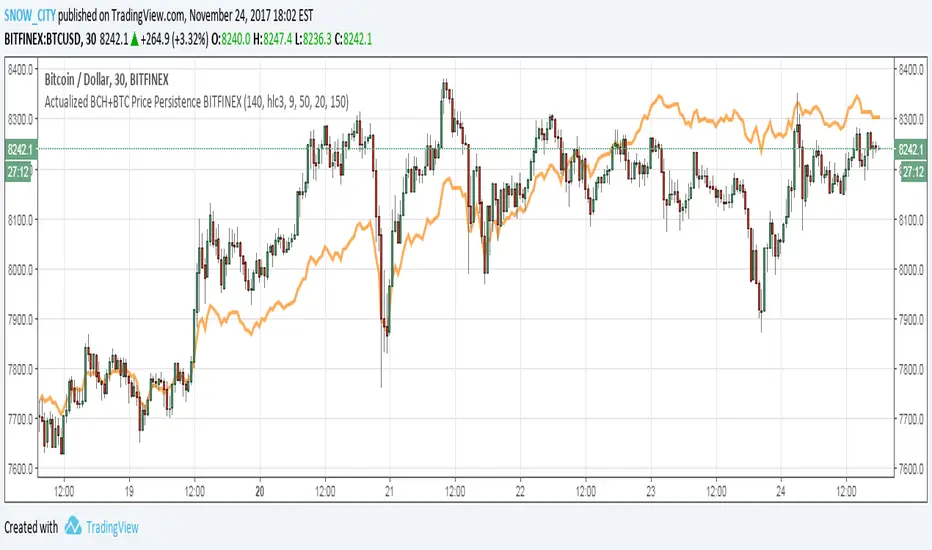
Actualized BCH+BTC Price Persistence BITFINEX
Price Line overlay shows combined BCH+BTC price normalized to the price of BTC, which is the realtime combined price (BCH+BTC) averaged over the SMA of BTC - SMA of BCH.
This indicator is a 2-in-1 overlay + oscillator depending on which plots are enabled.
This version is the overlay script, this is why there are maths that are not used by the plot.
NEED to adjust the SMA Persistence normalization depending on chart resolution.
Use with BCH "Domination Correlation" - the oscillator version of this script.
SNOW_CITY
Smart Money Flow - Exchange & TVL Composite# Smart Money Flow - Exchange & TVL Composite Indicator
## Overview
The **Smart Money Flow (SMF)** indicator combines two powerful on-chain metrics - **Exchange Flows** and **Total Value Locked (TVL)** - to create a composite index that tracks institutional and "smart money" movement in the cryptocurrency market. This indicator helps traders identify accumulation and distribution phases by analyzing where capital is flowing.
## What It Does
This indicator normalizes and combines:
- **Exchange Net Flow** (from IntoTheBlock): Tracks Bitcoin/Ethereum movement to and from exchanges
- **Total Value Locked** (from DefiLlama): Measures capital locked in DeFi protocols
The composite index is displayed on a 0-100 scale with clear zones for overbought/oversold conditions.
## Core Concept
### Exchange Flows
- **Negative Flow (Outflows)** = Bullish Signal
- Coins moving OFF exchanges → Long-term holding/accumulation
- Indicates reduced selling pressure
- **Positive Flow (Inflows)** = Bearish Signal
- Coins moving TO exchanges → Preparation for selling
- Indicates potential distribution phase
### Total Value Locked (TVL)
- **Rising TVL** = Bullish Signal
- Capital flowing into DeFi protocols
- Increased ecosystem confidence
- **Falling TVL** = Bearish Signal
- Capital exiting DeFi protocols
- Decreased ecosystem confidence
### Combined Signals
**🟢 Strong Bullish (70-100):**
- Exchange outflows + Rising TVL
- Smart money accumulating and deploying capital
**🔴 Strong Bearish (0-30):**
- Exchange inflows + Falling TVL
- Smart money preparing to sell and exiting positions
**⚪ Neutral (40-60):**
- Mixed or balanced flows
## Key Features
### ✅ Auto-Detection
- Automatically detects chart symbol (BTC/ETH)
- Uses appropriate exchange flow data for each asset
### ✅ Weighted Composite
- Customizable weights for Exchange Flow and TVL components
- Default: 50/50 balance
### ✅ Normalized Scale
- 0-100 index scale
- Configurable lookback period for normalization (default: 90 days)
### ✅ Signal Zones
- **Overbought**: 70+ (Strong bullish pressure)
- **Oversold**: 30- (Strong bearish pressure)
- **Extreme**: 85+ / 15- (Very strong signals)
### ✅ Clean Interface
- Minimal visual clutter by default
- Only main index line and MA visible
- Optional elements can be enabled:
- Background color zones
- Divergence signals
- Trend change markers
- Info table with detailed metrics
### ✅ Divergence Detection
- Identifies when price diverges from smart money flows
- Potential reversal warning signals
### ✅ Alerts
- Extreme overbought/oversold conditions
- Trend changes (crossing 50 line)
- Bullish/bearish divergences
## How to Use
### 1. Trend Confirmation
- Index above 50 = Bullish trend
- Index below 50 = Bearish trend
- Use with price action for confirmation
### 2. Reversal Signals
- **Extreme readings** (>85 or <15) suggest potential reversal
- Look for divergences between price and indicator
### 3. Accumulation/Distribution
- **70+**: Accumulation phase - smart money buying/holding
- **30-**: Distribution phase - smart money selling
### 4. DeFi Health
- Monitor TVL component for DeFi ecosystem strength
- Combine with exchange flows for complete picture
## Settings
### Data Sources
- **Exchange Flow**: IntoTheBlock real-time data
- **TVL**: DefiLlama aggregated DeFi TVL
- **Manual Mode**: For testing or custom data
### Indicator Settings
- **Smoothing Period (MA)**: Default 14 periods
- **Normalization Lookback**: Default 90 days
- **Exchange Flow Weight**: Adjustable 0-100%
- **Overbought/Oversold Levels**: Customizable thresholds
### Visual Options
- Show/Hide Moving Average
- Show/Hide Zone Lines
- Show/Hide Background Colors
- Show/Hide Divergence Signals
- Show/Hide Trend Markers
- Show/Hide Info Table
## Data Requirements
⚠️ **Important Notes:**
- Uses **daily data** from IntoTheBlock and DefiLlama
- Works on any chart timeframe (data updates daily)
- Auto-switches between BTC and ETH based on chart
- All other crypto charts default to BTC exchange flow data
## Best Practices
1. **Use on Daily+ Timeframes**
- On-chain data is daily, most effective on D/W/M charts
2. **Combine with Price Action**
- Use as confirmation, not standalone signals
3. **Watch for Divergences**
- Price making new highs while indicator falling = warning
4. **Monitor Extreme Zones**
- Sustained readings >85 or <15 indicate strong conviction
5. **Context Matters**
- Consider broader market conditions and fundamentals
## Calculation
1. **Exchange Net Flow** = Inflows - Outflows (inverted for index)
2. **TVL Rate of Change** = % change over smoothing period
3. **Normalize** both metrics to 0-100 scale
4. **Composite Index** = (ExchangeFlow × Weight) + (TVL × Weight)
5. **Smooth** with moving average
## Disclaimer
This indicator uses on-chain data for analysis. While valuable, it should not be used as the sole basis for trading decisions. Always combine with other technical analysis tools, fundamental analysis, and proper risk management.
On-chain data reflects blockchain activity but may lag price action. Use this indicator as part of a comprehensive trading strategy.
---
## Credits
**Data Sources:**
- IntoTheBlock: Exchange flow metrics
- DefiLlama: Total Value Locked data
**Indicator by:** @iCD_creator
**Version:** 1.0
**Pine Script™ Version:** 6
---
## Updates & Support
For questions, suggestions, or bug reports, please comment below or message the author.
**Like this indicator? Leave a 👍 and share your feedback!**

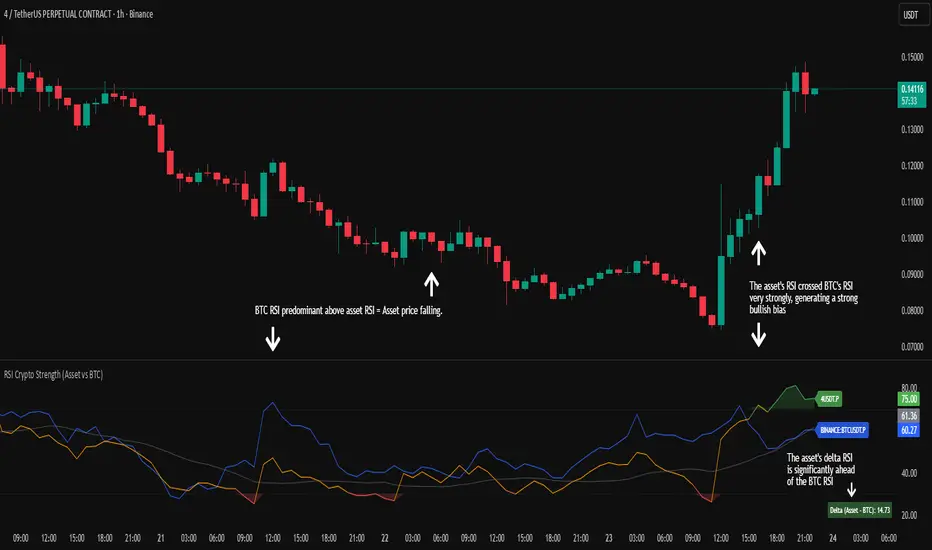
RSI Crypto Strength (Asset vs BTC)The "RSI Crypto Strength" is an advanced analysis tool built on a fundamental pillar of the cryptocurrency market: for an altcoin to achieve exponential bullish performance, it must invariably be and remain stronger than Bitcoin itself.
The primary objective of this indicator is to quantify and reinforce this thesis. It provides a clear and immediate view of the relative strength of any cryptocurrency in direct comparison with the market leader, Bitcoin. This relative strength can be identified on any timeframe. This also reinforces a scenario where a cryptocurrency that is weaker than Bitcoin is prone to sideways movements and downturns.
Key Features
This indicator combines multiple tools into a single solution:
> Dual RSI Plot: Simultaneously visualizes the RSI of the asset on the chart (dynamic) and the RSI of Bitcoin (blue line).
> Strength Delta (Asset vs. BTC): The heart of the indicator. A panel displays the exact difference (Asset RSI - Bitcoin RSI).
- Green: The asset has more RSI strength than Bitcoin.
- Red: The asset has less RSI strength than Bitcoin.
> Dynamic Coloring and Area Fill: The asset's RSI line and the background area automatically change color to highlight critical zones:
- Green (Overbought): RSI above 70.
- Red (Oversold): RSI below 30.
- Orange (Neutral): RSI between 30 and 70.
> Integrated Moving Average: A Moving Average line (gray) is plotted directly on the asset's RSI, serving as a signal line or to smooth momentum. The type (SMA, EMA, WMA, etc.) and period are fully customizable.
> Multi-Timeframe (MTF) Support: You can configure the indicator to display data from a higher timeframe (e.g., "1H") while analyzing a lower timeframe chart (e.g., "5m").
> Customizable Panel and Labels:
- A Delta Panel that can be enabled/disabled and moved to any of the four corners of the indicator.
- Labels at the end of the lines (Asset, BTC, MA) for easy identification, which can also be enabled/disabled.
> Alert-Ready: The indicator exposes the 4 main data sources for creating alerts.
How to Use
> Thesis Validation (Higher Timeframes): This is the primary use. Before looking for entries, use the indicator on timeframes like the H4, Daily, or Weekly. Confirm that the Asset (orange/green line) is consistently above Bitcoin (blue line) and that the Delta is positive. This is your structural strength validation, confirming the asset has potential for an exponential rally.
> Delta Analysis: The "Delta (Asset - BTC)" panel is your immediate strength metric. A positive and rising value indicates the asset is outperforming Bitcoin. A negative and falling value indicates relative weakness.
> Line Crossovers (Timing): On lower timeframes, watch for crossovers between the Asset line and the Bitcoin line. A cross of the Asset line above the Bitcoin line is a clear sign that the asset's momentum is gaining strength.
> Signal Confluence: Look for high-probability scenarios. For example: The Asset's RSI crosses above the Bitcoin RSI while the Delta also crosses above 0.
> Market Extremes: Use the area fill to quickly identify when the asset reaches extreme overbought (>70) or oversold (<30) levels, regardless of what Bitcoin is doing.
Alerts
This indicator is fully prepared for alert creation. When setting up an alert in TradingView, you can select the following data sources from this indicator:
> RSI Asset: Alerts on the RSI value of the asset on the chart.
> RSI Bitcoin: Alerts on the RSI value of Bitcoin.
> Moving Average: Alerts on the value of the Moving Average.
> RSI Delta: Allows creating alerts based on the difference between the two. (e.g., "Alert if RSI Delta crosses above Value 0").
Settings (Inputs)
The indicator offers full customization:
> RSI Length: The calculation period for both RSIs (default 14).
> Indicator Timeframe: Enables Multi-Timeframe functionality.
> Bitcoin Ticker: Allows changing the Bitcoin reference ticker.
> MA Settings: Choose the MA Type (SMA, EMA, WMA, VWMA, etc.) and its period.
> Panels and Labels: Toggles to enable/disable the Delta Panel and Line Labels, plus a selector for the panel's location.
> Colors: All line and highlight colors are fully customizable in the settings.
DISCLAIMER: This script is an analysis tool and does not provide financial advice. All trades carry risk. Use this tool as part of a broader trading strategy and always practice good risk management.
ICT PDA - Gold & BTC (QuickScalp Bias/FVG/OB/OTE + Alerts)What this script does
This indicator implements a complete ICT Price Delivery Algorithm (PDA) workflow tailored for XAUUSD and BTCUSD. It combines HTF bias, OTE zones, Fair Value Gaps, Order Blocks, micro-BOS confirmation, and liquidity references into a single, cohesive tool with early and final alerts. The script is not a mashup for cosmetic plotting; each component feeds the next decision step.
Why this is original/useful
Symbol-aware impulse filter: A dynamic displacement threshold kTune adapts to Gold/BTC volatility (body/ATR vs. per-symbol factor), reducing noise on fast markets without hiding signals.
Scalping preset: “Quick Clean” mode limits drawings to the most recent bars and keeps only the latest FVG/OB zones for a clear chart.
Three display modes: Full, Clean, and Signals-Only to match analysis vs. execution.
Actionable alerts: Early heads-up when price enters OTE in the HTF bias direction, and Final alerts once mitigation + micro-break confirm the setup.
How it works (high-level logic)
HTF Bias: Uses request.security() on a user-selected timeframe (e.g., 240m) and EMA filter. Bias = close above/below HTF EMA.
Dealing Range & OTE: Recent swing high/low (pivot length configurable) define the range; OTE (62–79%) boxes are drawn contextually for up/down ranges.
Displacement: A candle’s body/ATR must exceed kTune and break short-term structure (displacement up/down).
FVG: 3-bar imbalance (bull: low > high ; bear: high < low ). Latest gaps are tracked and extended.
Order Blocks: Last opposite candle prior to a qualifying displacement that breaks recent highs/lows; zones are drawn and extended.
Entry & Alerts:
Long: Bullish bias + price inside buy-OTE + mitigation of a bullish FVG or OB + micro BOS up → “PDA Long (Final)”.
Short: Bearish bias + price inside sell-OTE + mitigation of a bearish FVG or OB + micro BOS down → “PDA Short (Final)”.
Early Alerts: Trigger as soon as price enters OTE in the direction of the active bias.
Inputs & controls (key ones)
Bias (HTF): timeframe minutes, EMA length.
Structure: ATR length, Impulse Threshold (Body/ATR), swing pivot length, OB look-back.
OTE/FVG/OB/LP toggles: show/hide components.
Auto-Tune: per-symbol factors for Gold/BTC + manual tweak.
Display/Performance: View Mode, keep-N latest FVG/OB, limit drawings to last N bars.
Recommended usage (scalping)
Timeframes: Execute on M1–M5 with HTF bias from 120–240m.
Defaults (starting point): ATR=14, Impulse Threshold≈1.6; Gold factor≈1.05, BTC factor≈0.90; Keep FVG/OB=2; last 200–300 bars; View Mode=Clean.
Workflow: Wait for OTE in bias direction → see mitigation (FVG/OB) → confirm with micro BOS → manage risk to nearest liquidity (prev-day H/L or recent swing).
Alerts available
“PDA Early Long/Short”
“PDA Long (Final)” / “PDA Short (Final)”
Attach alerts on “Any alert() function call” or the listed conditions.
Chart & screenshots
Please include symbol and timeframe on screenshots. The on-chart HUD shows the script name and state to help reviewers understand context.
Limitations / notes
This is a discretionary framework. Signals can cluster during news or extreme volatility; use your own risk management. No guarantee of profitability.
Changelog (brief)
v1.2 QuickScalp: added Quick Clean preset, safer array handling, symbol-aware impulse tuning, display modes.
------------------------------
ملخص عربي:
المؤشر يطبق تسلسل PDA عملي للذهب والبتكوين: تحيز من فريم أعلى، مناطق OTE، فجوات FVG، بلوكات أوامر OB، وتأكيد micro-BOS، مع تنبيهات مبكرة ونهائية. تمت إضافة وضع “Quick Clean” لتقليل العناصر على الشارت وحساسية إزاحة تتكيّف مع الأصل. للاستخدام كسكالب: نفّذ على M1–M5 مع تحيز 120–240 دقيقة، وابدأ من الإعدادات المقترحة بالأعلى. هذا إطار سلوكي وليس توصية مالية.
