Multi Channel GRID & DCA LTF [trade_lexx]Multi Channel GRID & DCA LTF
Usage Guide
Part 1: The concept and general possibilities of the "Multi Channel GRID & DCA LTF" strategy
Introduction
Welcome to the guide to "Multi Channel GRID & DCA LTF", a powerful and versatile automated trading strategy for the TradingView platform. This tool was developed for traders who are looking for flexibility, control and a high degree of adaptability to various market conditions.
The strategy is based on a hybrid approach that combines two popular and time-tested techniques.:
1. GRID (grid trading): The classic method of averaging a position is by placing a grid of limit orders.
2. DCA (Dollar Cost averaging): Smart position averaging based on signals from external indicators.
However, "Multi Channel GRID & DCA LTF" goes far beyond the simple combination of these two techniques. The strategy includes a number of unique and innovative features, such as cascading MultiGRID grids for dealing with extreme volatility, Channel Mode range trading mode for profiting from sideways movement, and Low Time Frame analysis (LTF) to achieve surgical accuracy in backtesting. Deep customization options for risk management, capital, take profits, and stop losses allow you to configure a strategy for almost any trading style, asset, and timeframe.
The basic idea: How does it work?
Let's take a detailed look at each of the key concepts embedded in the logic of the strategy.
1. GRID — Automatic placement of buy and sell orders at certain price intervals.
This is a fundamental mode of operation. Its main goal is to systematically improve the average entry price for a position if the market is going against you.
* The principle of operation: After opening the base (first) order (`BO`), the strategy automatically places a series of pending limit orders (here they are called "safety orders" or "SO") at certain price intervals. For a long position, orders are placed below the entry price, and for a short position, orders are placed higher.
* Target: When the price moves against an open position, it consistently hits and executes safety orders. Each such execution adds additional volume to the position at a more favorable price, thereby shifting the overall average entry price (`position_avg_price') closer to the current market price. This means that a much smaller corrective movement will be required to gain ground.
* Flexibility: You have full control over the geometry of the grid: the number of safety orders, the percentage distance between them (`SO Step`), and you can even set a coefficient that will increase this step for each subsequent order (`SO Multiplier`), creating an expanding grid.
2. DCA (Signal Averaging) — Smart Averaging
This mode adds an additional layer of analysis to the averaging process. Instead of just buying/selling at the set price levels, the strategy waits for a confirmation signal.
* Working principle: You can connect any external indicator (for example, RSI, CCI, or even your own complex signal system) to the strategy, which outputs numerical values. As standard, 1 is used for a long signal, and -1 is used for a short signal. The strategy will place the next averaging order only at the moment when it receives the appropriate signal.
* Goal: To average a position not just during a fall (or a rise for a short), but at the moments that your main trading system considers the most favorable for this. This allows you to avoid "catching falling knives" and enter only if there are good reasons.
3. Hybrid Mode (GRID+DCA) is the best of the previous two modes
This mode is designed for maximum filtering and control. It requires two conditions to be fulfilled simultaneously.
* Working principle: The safety order will be executed only if the price has reached the calculated grid level and a confirmation signal has been received from your external indicator. If a confirmation signal is received from an external indicator, the next calculated grid level activates the limit order.
* Goal: To create the most reliable averaging system that protects against premature entries and requires double confirmation (both by price and indicator) before increasing the position size.
4. MultiGRID — Adaptation to extreme volatility
This is one of the most powerful and unique features of a strategy designed to survive and make a profit in the face of strong, protracted trends or "black swans".
* The problem it solves: The usual grid of orders has a limited depth. If the price goes beyond the last safety order, the strategy loses the opportunity to average and becomes vulnerable.
* The principle of operation: The MultiGRID function allows you to create "cascades" — several grids following one another. When all the orders of the first grid are executed, the strategy does not stop. Instead, she can activate the second, third (and so on) a grid of orders. The new grid can be activated by one of two triggers:
1. Offset: The new grid is activated when the price passes another set percentage deviation from the last executed order.
2. Signal: The new grid is activated when a signal is received from an external indicator.
* Goal: To significantly expand the working range of the strategy. This allows it to adapt to strong market movements that would "break" the usual grid, and continue to effectively average a position at a much greater depth of decline or growth.
5. Channel Mode — Trading in the range
This feature turns a standard averaging strategy into a machine for "farming" profits within a price channel that is formed during a sideways market movement.
* The problem it solves: In the standard grid strategy, after partially closing a take profit position, the volume of this part "leaves" the trade until the deal is fully closed. You are missing the opportunity to reuse this capital.
* Operating principle: When Channel Mode is enabled, the following happens. Suppose the price went against you, executed several safety orders, and then turned around and reached one of the partial take profits. At this point, the strategy is:
1. Fixes the profit, as it should be.
2. Instantly places a new limit order to buy (or sell for a short) at exactly the same price level where the last triggered safety order was executed. The volume of this order is equal to the volume of the part that was just closed for take profit.
3. If the price goes down again and executes this "repeat" order, the strategy immediately sets a corresponding take profit for it at the level where the previous profit was taken.
* Goal: To create a continuous buy-sell cycle within the local range (channel). The lower limit of the channel is the price of the last averaging, and the upper limit is the price of a partial take profit. This allows you to repeatedly profit from sideways price fluctuations, without waiting for the full closure of the main, large transaction.
6. LTF (Lower Timeframe Analysis) — Surgical precision of backtesting
This feature is critically important for obtaining reliable results during historical testing (backtesting) of grid strategies.
* The problem it solves: The standard testing mechanism in TradingView has a serious limitation. Working, for example, on a 4-hour chart, he sees only 4 candle points: Open, High, Low and Close. He does not know in what order the price moved within these 4 hours. He could have touched High first and then Low, or vice versa. For grid strategies, this is fatal — the engine can show that a take profit has been executed, although in reality the price first went down, collected the entire grid of orders and only then turned around.
* How it works: When you turn on the LTF mode, the strategy for each candle on your main chart (for example, 4H) requests and analyzes all candles from the lower timeframe you specified (for example, 1-minute). Then it virtually trades the entire price path for these minute candles, executing orders, take profits and stop losses in the sequence in which they would occur in reality. It works in the single take profit mode of the Grid strategy.
* Goal: To provide the most realistic and reliable backtest that reflects the real dynamics of the market. This allows you to avoid false expectations and accurately assess the potential performance of the strategy.
// ------------------------
Part 2: Detailed description of the strategy settings
This section is your main guide to all the switches and options available in the strategy. Understanding each setting is the key to unlocking the full potential of this powerful tool.
1. 🛡️ Risk Management 🛡️
This group contains fundamental parameters that determine the basic logic of risk management and the geometry of grid orders.
* Strategy type: Determines the direction of transactions.
* Long: The strategy will only open long positions (buy).
* Short: The strategy will only open short positions (sell).
* Both: The strategy will work both ways, opening long or short depending on the incoming signal.
* SO Count: Sets the maximum number of Safety (averaging) Orders (SO) that the strategy will place within the same grid. If you have MultiGRID enabled, this number applies to each individual grid.
* SO Step (%): This is the base percentage deviation from the entry price at which the first safety order will be placed. For example, at a value of 0.5, the first SO in a long trade will be placed 0.5% lower than the opening price of the base order.
* SO Multiplier: A coefficient that exponentially increases the step for each subsequent safety order. This allows you to create an expanding grid where averaging orders are placed further and further apart, which is effective with strong and accelerating price movements.
* *The step formula for the nth order*: Step(N) = (SO Step) * (SO Multiplier ^(N-1)).
* If the value is 1, all steps will be the same.
* With a value of 1.6, the step of the second SO will be 1.6 times larger than the first, the step of the third will be 1.6 times larger than the second, and so on.
* 1️⃣ TP/SL: These are simplified settings for quick configuration. They allow you to turn on/off the main take profit and stop loss and set basic percentage values for them. More detailed settings for these parameters can be found in the relevant sections below.
// ------------------------
2. 💰 Money Management 💰
Everything related to position size, leverage, and capital is configured here.
* Volume BO (Base Order): Determines the size of the trade's opening order.
* Volume BO: A fixed amount in the quote currency (for example, in USDT).
* USDT (check mark): Manages the information in the comments to the orders. If enabled, the volume of orders in USDT will be displayed in the comments. This is convenient for visual analysis and for sending the amount of USDT by the placeholder {{strategy.order.comment}} via webhooks when connecting the strategy to the exchange or trading terminals.
* or % of deposit: The amount calculated as a percentage of the available capital of the strategy. The check mark to the right of this field enables this mode. Important: using a percentage activates the effect of compounding (compound interest), as the amount of each new transaction will be automatically recalculated based on the current capital (initial capital + profit/loss). If enabled, the percentage of orders will be displayed in the comments. This is convenient for visual analysis and for sending percentages on the placeholder {{strategy.order.comment}} via webhooks when connecting the strategy to the stock exchange, trading terminals, or creating Copy trading.
* Martingale: The coefficient applied to the volume of orders. It increases the size of each subsequent insurance order compared to the base one.
* Volume formula for the nth SO: Volume SO (N) = (Volume BO) * (Martingale^N).
* With a value of 1.2, the volume of the first SO will be 1.2 times greater than the base, the second — 1.44 times (`1.2 * 1.2`) and so on.
* Leverage: Specify the size of your leverage. This parameter is used exclusively for calculating and displaying the approximate liquidation price. It does not affect the size of positions, but it helps to visually assess the risks.
* Liquidation: Enables or disables the calculation and display of the liquidation line on the chart.
* Margin type: Allows you to select a method for calculating the liquidation price, simulating the logic of exchanges:
* Isolated: The liquidation price is calculated based on the size and leverage of the current open position only.
* Cross: The calculation simulates using the entire available balance to maintain a position. In the strategy, the liquidation price is calculated as the level at which the loss on the current transaction is equal to the current capital.
* Commission (%): Specify the percentage of your exchange's commission per transaction. The correct value of this parameter is crucial for obtaining realistic backtest results.
// ------------------------
3. 🕸️ Grid Management 🕸️
This group is responsible for the logic of safety orders and advanced mechanics such as Channel Mode and MultiGRID.
* SO Type: Defines the logic of placing averaging orders.
* GRID: Classic grid. All safety orders are placed in advance as limit orders.
* DCA: Signal averaging. The strategy is waiting for a signal from an external indicator to place a market averaging order.
* GRID+DCA: Hybrid. The strategy waits for a signal, and if it arrives, places a limit order at the appropriate price level of the grid or executes a market order if the signal has arrived below the limit order level.
* Signal for SO: A data source (indicator) that will be used for signals in DCA and GRID+DCA modes.
* ↔️ Channel Mode: When this option is enabled, the strategy tries to trade in a sideways range. After partially closing a take profit position, it immediately places a limit order for re-entry at the price of the last triggered safety order. This creates a buy-sell cycle within the local channel.
* Best Price Only: This filter adds an additional condition for averaging in DCA and MultiGRID modes (when it operates on a signal). The next averaging order or a new grid will be activated only if the current price is more favorable (lower for long, higher for short) than the price of the previous entry.
* 🧩 MultiGRID ⮕ Enables cascading grid mode.
* Grid Count: The total number of grids that can be activated sequentially.
* Offset: Percentage deviation from the price of the last order of the previous grid. When this margin is reached, the following grid of orders is activated (this mode does not require a signal).
* Or signal: Allows you to use the signal from an external indicator as a trigger to activate the next grid. The checkmark on the right turns on this mode.
// ------------------------
4. 🎯 Entry and Stop 🎯
This group of settings allows you to fine-tune the conditions for starting a new trade and all aspects related to protective stop orders, including the complex mechanics of trailing and managing SL after partial take profits.
* 🎯 Signal: A data source (indicator) that will be used to determine when to enter a trade. The strategy expects a value of 1 for the start of a long trade and -1 for a short trade.
* Min Bars: Sets the minimum number of candles that must pass from the moment of opening the previous trade to the moment of opening the next one. A value of 0 disables this filter. This is a useful tool to prevent overly frequent entries in a "noisy" market.
* Non-stop: If this option is enabled, the strategy ignores the Entry Signal and opens a new trade immediately after closing the previous one (taking into account the Min Bars filter, if it is set). This turns the strategy into a constantly working mechanism that is always on the market.
* 🛑 SL Type: Defines the base price from which the stop loss percentage will be calculated. The stop loss in the first section must be enabled for this block of settings to work.
* From the entry point: SL is always calculated from the opening price of the very first base order. It remains static throughout the entire transaction unless it is moved by other functions.
* From breakeven line: SL is dynamically recalculated and shifted each time a safety order is executed. It always follows the average price of the position, being at a given percentage distance from it.
* From last executed SO: SL is recalculated from the price of the last executed order, whether it is a base or a safety order.
* From last SO: SL is calculated from the price of the most recent possible safety order in the grid. This is usually the most remote and conservative type of SL.
* Trailing SL Type: Defines the algorithm by which the stop loss will move after its activation.
* Standard: Classic trailing. After activation, SL will follow the price at a fixed distance.
* ATR: SL will follow the price at a distance equal to the value of the ATR indicator multiplied by the specified multiplier.
* External Source: SL will follow any selected line of the third-party indicator.
* Period and Multiplier: Common parameters for all types of trailing.
* Source: The source of the line for the trailing SL of the third-party indicator.
* Trailing SL after entry: The mode of activation of the trailing SL after entering the transaction
* SL management after TP (sections 1️⃣, 2️⃣, 3️⃣): These three blocks allow you to create a complex stop loss management logic as profits are recorded.
For each take profit level (TP1, TP2, TP3), you can configure:
* SL BE / SL TP1 / SL TP2: When the corresponding TP is reached, the stop loss will be moved to the breakeven point (for TP1), to the TP1 price level (for TP2) or to the TP2 price level (for TP3).
* Trailing SL: When the corresponding TP is reached, the trailing stop loss is activated according to the settings above.
* By ↔️ Signal: A very powerful option. If it is enabled, the above action (SL transfer or trailing activation) will occur when the opposite trading signal is received from an external indicator. This allows you to protect profits or reduce losses if the market turns sharply, even before reaching the target.
* SL Delay ⮕ Allows you to delay the activation of the stop loss.
* Number of Bars: The Stop loss will be physically placed on the market only after the specified number of candles has passed since entering the trade. This can help to avoid "taking out" the stop with a random short movement (squiz) immediately after opening a position.
* SL Block: Unique defensive mechanics for trading both ways (`Strategy Type: Both`).
* Number of SL: If the strategy receives the specified number of stop losses in a row in one direction (for example, 2 stops long), it temporarily blocks the opportunity to open new trades in that direction.
* Lock Reset mode:
* By direction: The lock is lifted if a profitable trade is closed in the allowed direction or if a stop loss is triggered in the opposite direction.
* First profit: The lock is lifted after closing any profitable transaction, regardless of its direction.
// ------------------------
5. ✅ Take Profit ✅
This group of settings provides comprehensive control over profit taking, from a simple take profit to a complex system of partial closures and trailing.
* ✅ TP Type: Defines the base price for calculating the percentage deviation of the take profit.
* From entry point: TP is calculated from the base order price.
* From breakeven line: TP dynamically follows the average position price.
* From last executed SO: TP is calculated from the price of the last executed order.
* Filters for closing on signal
* Only ➕: If TP is triggered by a signal, the deal will be closed only if it is in the black relative to the average price.
* Or >TP: If TP is triggered by a signal, the trade will be closed only if the closing price is better than (or equal to) the estimated price of this TP.
* TP type of trailing: Yes, take profit has a trailing too! It works differently than the SL trailing.
* Standard / ATR: After the price touches the "virtual" TP level, the trailing is activated. He does not place a stop order, but begins to move away from the price, dynamically moving the limit order to close further and further in the profitable direction, allowing him to collect the maximum from the impulse movement.
* External Source: TP will follow any selected line of the third-party indicator.
* Period and Multiplier: Parameters for calculating the trailing margin TP.
* Source: The source of the line for the trailing TP of the third-party indicator.
* TP level settings (sections 1️⃣, 2️⃣, 3️⃣, 4️⃣): The strategy supports up to four independent take profit levels, which allows for a flexible system of partial commits.
For each level, you can set:
* TP: Enable the level and set its percentage deviation from the base price.
* Size: What percentage of the current position will be closed when this level is reached. For the last active TP, this parameter is ignored, and 100% of the remaining position is closed.
* Trailing TP: Enable the above-described trailing mechanism for this particular level.
* Signal: Enable closing based on the signal from the external indicator for this level.
* Or take: If both the closing on the signal and the limit order are enabled, then whatever comes first will work.
* After SO: Activate this TP level only after the specified number of safety orders has been executed. This allows you to set closer targets for riskier (deeply averaged) positions.
// ------------------------
6. 🔬 GRID and MultiGrid Analysis on Lower TFs (LTF) 🔬
This group activates one of the most important functions for accurate testing of grid strategies.
* Enable LTF Calculation ⮕ The main switch of the analysis mode on the lower timeframes.
* Timeframe selection: A drop-down list where you can select a timeframe for detailed analysis. For example, if your main schedule is 1 hour, you can select 1 minute here. The strategy will emulate the trading of minute candles within each hour candle.
❗️Important: As mentioned in the first part, the use of this mode is critically necessary to obtain realistic backtest results, especially for strategies with a dense grid of orders. Without it, the results may be overly optimistic and not reflect the real dynamics of the market. It should be remembered that TradingView imposes a limit on the number of intra-bars (minor TF bars) that can be requested. This is usually about 100,000 bars.
// ------------------------
7. 🕘 Backtest Date Range 🕘
This group allows you to focus testing on a specific historical period.
* Limit Date Range: Enables date filtering.
* Start time: The date and time when the strategy will start analyzing and opening deals.
* End time: The date and time after which the strategy will stop opening new deals and complete testing.
// ------------------------
8. 🎨 Visualization 🎨
All the options responsible for the appearance and information content of the chart are collected here.
* Show PnL labels: Enables/disables the display of text labels with the result (profit/loss) after closing each trade.
* Statistics Table: Enables/disables the main dashboard with detailed statistics on the results of the backtest.
* Strategy Settings Table: Enables/disables an additional panel that summarizes all the key parameters of the current configuration.
* Monthly Profit Table: Enables/disables a table with a breakdown of percentage returns by month and year.
* Table settings: For each of the three tables, you can individually adjust the Text size and Table Position on the screen to position them as conveniently as possible.
* Decimal places: Defines how many decimal places will be displayed in numeric values in tables and on labels.
// ------------------------
9. ✉️ Webhook Settings ✉️
This group is intended for traders who want to automate trading on strategy signals using third-party services and exchanges (for example, 3Commas, WunderTrading, Cryptorobotics, Cryptohopper, Bitsgap, Binance, ByBit, OKX, Pionex, Bitget or proprietary solutions).
For each key event in the strategy, there is a separate switch and a text field:
* Webhook for Open: Enable and set a message for the webhook that will be sent when the base order is opened.
* Webhook for Averaging: A message sent when executing any insurance order.
* Webhook for Take Profit: A message sent when closing on take profit (including partial ones).
* Webhook for Stop-Loss: A message sent when a stop loss is closed.
You can insert a JSON code or any other message format that your service requires for automation into the text fields. The strategy supports special placeholders (for example, `{{strategy.order.alert_message}}`), which allow you to dynamically insert the necessary data into the message, such as the amount of USDT or the percentage of the deposit for entry, averaging and take profit orders.
Pesquisar nos scripts por "BOS"

LANZ Strategy 2.0 [Backtest]🔷 LANZ Strategy 2.0 — Structural Breakout Logic with Dynamic Swing Protection
LANZ Strategy 2.0 is a precision-focused backtesting system built for intraday traders who rely on structural confirmations before the London session to guide directional bias. This tool uses smart swing detection, risk-defined position sizing, and strict time-based execution to simulate real trading conditions with clarity and control.
🧠 Core Components:
Structural Confirmation (Trend & BoS): Detects trend direction and break of structure (BoS) using a three-swing logic, aligning trade entries with valid structural movement.
Time-Based Execution: Trades are triggered exclusively at 02:00 a.m. New York time, ensuring disciplined and repeatable intraday testing.
Swing-Based SL Models: Traders can select between three stop-loss protection types:
First Swing: Most recent structural level
Second Swing: Prior level
Full Coverage: All recent swing levels + configurable pip buffer
Dynamic TP Calculation: Take-Profit is projected as a risk-based multiple (RR), fully adjustable via input.
Capital-Based Risk Management: Risk is defined as a percentage of a fixed account size (e.g., $100 per trade from $10,000), and lot size is automatically calculated based on SL distance.
Fallback Entry Logic: If structural breakout is present but trend is not confirmed, a secondary entry is triggered.
End-of-Session Management: Any open trades are automatically closed at 11:45 a.m. NY time, with optional manual labeling or review.
📊 Visual Features (Optional in Indicator Version):
(Note: Visuals apply to the indicator version of LANZ 2.0, not this backtest script)
Swing level labels (1st, 2nd) and dynamic SL/TP lines.
Real-time session coloring for clarity: Pre-London, Entry Window, and NY Close.
Outcome labels: +RR, -RR, or net % at close.
Auto-cleanup of previous drawings for a clean chart per session.
⚙️ How It Works:
Detects last trend and BoS using swing logic before 02:00 a.m. NY.
At 02:00 a.m., evaluates directional bias and executes BUY or SELL if confirmed.
Applies selected SL logic (1st, 2nd, or full swing protection).
Sets TP based on the RR multiplier.
Closes the trade either on SL, TP, or at 11:45 a.m. NY manually.
🔔 Alerts:
Time-of-day alert at 02:00 a.m. NY to monitor execution.
Can be extended to cover SL/TP triggers or new BoS events.
📝 Notes:
Designed for backtesting precision and discretionary decision-making.
Ideal for Forex pairs, indices, or assets active during the London session.
Fully customizable: session timing, swing logic, SL buffer, and RR.
👤 Credits:
Strategy built by @rau_u_lanz using Pine Script v6, combining structural logic, capital-based risk control, and London-session timing in a backtest-ready framework for traders who demand accuracy and structure.

Zendog V3 backtest DCA bot 3commasMAJOR UPDATE:
- Update to Pinescript v5
- MAJOR refactor for the logic of how orders are placed. BO order is placed when the condition is first encountered and we are not in a deal.
The extra SO orders (if based on price movement) are all placed on the next candle after BO order, instead of each being placed one after another.
Take profit (if percentage) and Stop loss are placed on the first candle after BO order because if BO and TP are on the same candle TV does not execute properly.
These changes should improve strategy accuracy when multiple prices are hit by the same candle.
- NEW FEATURE: Support to Stop deal using an external indicator (i.e. stop long deal when RSI > 80)
- NEW FEATURE: Support to trigger Safety orders using an external indicator (i.e. trigger each additional SO when RSI < 10, regardless of price movement)
The price movement logic may be implemented in the indicator that plots start / end signals. The SO size is calculated using the configuration of steps.
- NEW FEATURE: Safety order command for 3commas bot. This is implemented using Add funds in the quote currency (for pair BTCUSDT the quote currency is USDT)
The SO size is calculated using the configuration of steps, for exact order size (and price) use the built-in Steps table.
- NEW FEATURE: Addition of extra columns to the steps table: Required price for TP, Required % change for TP, Required % change for BEP (Breakeven point)
- Update to steps table to remove prices when Safety orders are not based on % price change
- The code is opensource. I will not be able to sustain merges for the script, but feel free to use and develop your own version and ping me on discord to review them
and maybe include in the original script

Flux Charts - PAT Automation💎 GENERAL OVERVIEW
The PAT Automation is a powerful and versatile tool designed to help traders rigorously test their trading strategies against historical market data. With an array of advanced settings, traders can fine-tune their strategies, assess performance, and identify key improvements before deploying in live trading environments. This backtester offers a wide range of configurable settings, explained within this write-up.
Features of the PAT Automation:
Step By Step : Configure your strategy step by step, which will allow you to have OR & AND logic in your strategies.
Highly Configurable : Offers multiple parameters for fine-tuning trade entry and exit conditions.
Multi-Timeframe Analysis : Allows traders to analyze multiple timeframes simultaneously for enhanced accuracy.
Provides advanced stop-loss, take-profit, and break-even settings.
Incorporates volume-based conditions, liquidity grabs , order blocks , market structures and fair value gaps for refined strategy execution.
🚩 UNIQUENESS
The PAT Automation stands out from conventional backtesting tools due to its unparalleled flexibility, precision, and advanced trading logic integration. Key factors that make it unique include:
✅ Comprehensive Strategy Customization – Unlike traditional backtesters that offer basic entry and exit conditions, PAT Automation provides a highly detailed parameter set, allowing traders to fine-tune their strategies with precision.
✅ Multi-Timeframe Price Action Features – This is the first-ever tool that allows traders to backtest price action with multi-timeframe features such as Fair Value Gaps (FVGs), Inversion Fair Value Gaps (IFVGs), Order Blocks & Breaker Blocks.
✅ Customizable Take-Profit Conditions – Offers various methods to set take-profit exits, including using core features from price action, and fixed exits like ATR, % change or price change, enabling traders to tailor their exit strategies to specific market behaviors.
✅ Customizable Stop-Loss Conditions – Provides several ways to set up stop losses, including using concepts from price action and trailing stops or fixed exits like ATR, % change or price change, allowing for dynamic risk management tailored to individual strategies.
✅ Integration of External Indicators – Allows the inclusion of other indicators or data sources from TradingView for creating strategy conditions, enabling traders to enhance their strategies with additional insights and data points.
By integrating these advanced features, PAT Automation ensures that traders can rigorously test and optimize their strategies with great accuracy and efficiency.
📌 HOW DOES IT WORK?
The first setting you will want to set it the pyramiding setting. This setting controls the number of simultaneous trades in the same direction allowed in the strategy. For example, if you set it to 1, only one trade can be active in any time, and the second trade will not be entered unless the first one is exited. If it is set to 2, the script will handle both of them at the same time. Note that you should enter the same value to this pyramiding setting, and the pyramiding setting in the "Properties" tab of the script for this to work.
For deep backtesting, you can set "Max Distance To Last Bar" to "Unlimited". If you encounter any memory issues, try decreasing this setting to a lower value.
You can enable and set a backtesting window that will limit the entries to between the start date & end date.
Then, you can enter your desired settings to Price Action features like FVGs, IFVGs, Order Blocks, Breaker Blocks, Liquidity Grabs, Market Structures, EQH & EQL and Volume Imbalances. You can also enable and set up to 3 timeframes, which you can use later on when customizing your strategies enter / exit conditions.
Entry Conditions
From the "Long Conditions" or the "Short Conditions" groups, you can set your position entry conditions. For settings like "initial capital" or "order size", you can open the "Properties" tab, where these are handled.
The PAT Automation can use the following conditions for entry conditions :
1. Order Block (OB)
Detection: Triggered when an Order Block forms or is detected
Retest: Triggered when price retests an Order Block. A retest is confirmed when a candle enters an Order Block and closes outside of it.
Retracement: Triggered when price touches an Order Block
Break: Triggered when an Order Block is invalidated by candle close or wick, depending on the user's input.
2. Breaker Block (BB)
Detection: Triggered when a Breaker Block forms or is detected
Retest: Triggered when price retests a Breaker Block. A retest is confirmed when a candle enters a Breaker Block and closes outside of it.
Retracement: Triggered when price touches a Breaker Block
Break: Triggered when a Breaker Block is invalidated by candle close or wick, depending on the user's input.
3. Fair Value Gap (FVG)
Detection: Triggered when an FVG forms or is detected
Retest: Triggered when price retests an FVG. A retest is confirmed when a candle enters an FVG and closes outside of it.
Retracement: Triggered when price touches an FVG
Break: Triggered when an FVG is invalidated by candle close or wick, depending on the user's input.
4. Inversion Fair Value Gap (IFVG)
Detection: Triggered when an IFVG forms or is detected
Retest: Triggered when price retests an IFVG. A retest is confirmed when a candle enters an IFVG and closes outside of it.
Retracement: Triggered when price touches an IFVG
Break: Triggered when an IFVG is invalidated by candle close or wick, depending on the user's input.
5. Break of Structure (BOS)
Detection: Triggered when a BOS forms or is detected
6. Change of Character (CHoCH)
Detection: Triggered when a CHoCH forms or is detected
7. Change of Character Plus (CHoCH+)
Detection: Triggered when a CHoCH+ forms or is detected
8. Volume Imbalance (VI)
Detection: Triggered when a Volume Imbalance forms or is detected
9. Equal High (EQH)
Detection: Triggered when an EQH is detected
10. Equal Low (EQL)
Detection: Triggered when an EQL is detected
11. Buyside Liquidity Grab
Detection: Triggered when a liquidity grab occurs at Buyside Liquidity (BSL).
12. Sellside Liquidity Grab
Detection: Triggered when a liquidity grab occurs at Sellside Liquidity (SSL).
🕒 TIMEFRAME CONDITIONS
The PAT Automation supports Multi-Timeframe (MTF) features, just like the Price Action Toolkit. When setting an entry condition, you can also choose the timeframe.
To set up MTF conditions, navigate to the 'Timeframes' section in the settings, select your desired timeframes, and enable them. You can choose up to three timeframes.
Once you've selected your timeframes, you can use them in your strategy. When setting long and short entry / exit conditions, you can choose from Timeframe 1, Timeframe 2, or Timeframe 3.
External Conditions
Users can use external indicators on the chart to set entry conditions.
The second dropdown in the external condition settings allows you to choose a conditional operator to compare external outputs. Available options include:
Less Than or Equal To: <=
Less Than: <
Equal To: =
Greater Than: >
Greater Than or Equal To: >=
The position entry conditions work like this ;
Each side has 5 Price Action conditions and 1 Source condition. Each condition can be enabled or disabled using the checkbox on the left side.
For Price Action Conditions, you can set a direction: "Any", "Bullish" or "Bearish".
Then a Price Action Feature, like "FVG" or "Order Block".
The last part of our constructed condition is the alert type, which you can select between "Detection", "Retest", "Retracement" or "Break".
Now you should have a constructed condition, which should look like "Bullish Order Block Retest".
You can select which timeframe should this condition work on from Timeframe 1, 2 or 3. If you select "Any Timeframe", the condition will work for all timeframes.
Lastly select the step of this condition from 1 to 6.
The Source Condition
The last condition on each side is a source condition that is different from the others. Using this condition, you can create your own logic using other indicators' outputs on your chart. For example, suppose that you have an EMA indicator in your chart. You can have the source condition to something like "EMA > high".
The Step System
Each condition has a step number, and conditions are in topological order based on them.
The conditions are executed step by step. This means the condition with step 2 cannot be executed before the condition with step 1 is executed.
Conditions with the same step numbers have "OR" logic. This means that if you have 2 conditions with step 3, the condition with step 4 can trigger after only one of the step 3 conditions is executed.
➕ OTHER ENTRY FEATURES
The PAT Automation allows traders to choose when to execute trades and when not to execute trades.
1. Only Take Trades
This setting lets users specify the time period when their strategy can open or execute trades.
2. Don't Take Trades
This setting lets users specify time periods when their strategy can't open or execute trades.
↩️ EXIT CONDITIONS
1. Exit on Opposite Signal
When enabled, a long position will close when short entry conditions are met, and a short position will close when long entry conditions are met.
2. Exit on Session End
When enabled, positions will be closed at the end of the trading session.
📈 TAKE PROFIT CONDITIONS
There are several methods available for setting take profit exits and conditions.
1. Entry Condition TP
Users can use entry conditions as triggers for take-profit exits. This setting can be found under the long and short exit conditions.
2. Fixed TP
Users can set a fixed TP for exits. This setting can be found under the long and short exit conditions. Users can choose between the following:
Price: This method triggers a TP exit when price reaches a specified level. For example, if you set the Price TP to 10 and buy NASDAQ:TSLA at $190, the trade will automatically exit when the price reaches $200 ($190 + $10).
Ticks: This method triggers a TP exit when price moves a specified number of ticks.
Percentage (%): This method triggers a TP exit when price moves a specified percentage.
ATR: This method triggers a TP exit based on a specified multiple of the Average True Range (ATR).
📉 STOP LOSS CONDITIONS
There are several methods available for setting stop-loss exits and conditions.
1. Entry Condition SL
Users can use entry conditions as triggers for stop-loss exits. This setting can be found under the long and short exit conditions.
2. Fixed SL
Users can set a fixed SL for exits. This setting can be found under the long and short exit conditions. Users can choose between the following:
Price: This method triggers a SL exit when price reaches a specified level. For example, if you set the Price SL to 10 and buy NASDAQ:TSLA at $200, the trade will automatically exit when the price reaches $190 ($200 - $10).
Ticks: This method triggers a SL exit when price moves a specified number of ticks.
Percentage (%): This method triggers a SL exit when price moves a specified percentage.
ATR: This method triggers a SL exit based on a specified multiple of the Average True Range (ATR).
3. Trailing Stop
An explanation & example for the trailing stop feature is present on the write-up within the next section.
Exit conditions have the same logic of constructing conditions like the entry ones. You can construct a Take-Profit Condition & a Stop-Loss Condition. Note that the Take-Profit condition will only work if the position is in profit, regardless of if it's triggered or not. The same applies for the Stop-Loss condition, meaning that it will only work if the position is in loss.
You can also set a Fixed TP & Fixed SL based on the price movement after the position is entered. You have options like "Price", "Ticks", "%", or "Average True Range". For example, you can set a Fixed TP like "5%", and the position will be entered once it moves 5% up in a long position.
Trailing Stop
For the Fixed SL, you also have a "Trailing" stop option, which you can set it's activation level as well. The Trailing stop activation level and it's value are expressed in ticks. Check this scenerio for an example :
We have a ticker with a tick value of $1. Our Trailing Stop is set to 10 ticks and activation level is set to 30 ticks.
We buy 1 contract when the price is $100.
When the price becomes $110, we are in $10 (10 ticks) profit and the trailing stop is now activated.
The current price our stop's on is $110 - $30 (30 ticks), which is the level of $80.
The trailing stop will only move if the price moves up the highest high the price has been after we entered the position.
Let's suppose that price moves up $40 right after our trailing stop is activated. The price will now be $150, and our trailing stop will sit on $150 - $30 (30 ticks) = $120.
If the price is down the $120 level, our stop loss will be triggered.
There is also a "Hard SL" option designed for a backup stop-loss when trailing stops are enabled. You can enable & set this option and if the price goes down before our trailing stop even activates, the position will be exited.
You can also move stop-loss to the break-even (entry price of the position) after a certain profit is achieved using the last setting of the exit conditions. Note that for this to work, you will need to have a Fixed SL set-up.
➕ OTHER EXIT FEATURES
1. Move Stop Loss to Breakeven
This setting allows the strategy to automatically move the SL to Breakeven (BE) when the position is in profit by a certain amount. Users can choose between the following:
Price: This method moves the SL to BE when price reaches a specified level.
Ticks: This method moves the SL to BE when price moves a specified number of ticks.
Percentage (%): This method moves the SL to BE when price moves a specified percentage.
ATR: This method moves the SL to BE when price moves a specified multiple of the Average True Range (ATR).
Example Entry Scenario
To give an example , check this scenario; out conditions are :
LONG CONDITIONS
Bullish Order Block Detection, Step 1
Bullish CHoCH Detection, Step 2
Bullish Volume Imbalance Detection, Step 2
Bullish IFVG Retest, Step 3
First, the strategy needs to detect a Bullish Order Block in order to start working.
After it's detected, now it's looking for either a CHoCH, or a Volume Imbalance to proceed to the next step, the reason for this is that they both have the same step number.
After one of them is detected, the strategy will consistently check all IFVGs for a retest. If the retest occurs, a long position will be entered.
⏰ ALERTS
This indicator uses TradingView's strategy alert system. All entries and exits will be sent as an alert if configured. It's possible to further customize these alerts to your liking. For more information check TradingView's strategy alert customization page: www.tradingview.com
⚙️ SETTINGS
1. Backtesting Settings
Pyramiding: Controls the number of simultaneous trades allowed in the strategy. This setting must have the same value that is entered on the script's properties tab on the settings pane.
Max Distance to Last Bar: Determines the depth of historical data used to prevent memory overload.
Enable Custom Backtesting Period: Restricts backtesting to a specific date range.
Start & End Time Configuration: Define precise start and end dates for historical analysis.
2. Fair Value Gaps Settings
Zone Invalidation: Select between "Wick" and "Close" invalidation.
Filtering: Choose between "Average Range" and "Volume Threshold".
FVG Sensitivity: Ranges from Extreme to Low to detect FVGs with varying strictness.
Allow Gaps: Enables analysis on tickers that have different open-close price gaps.
3. Inversion Fair Value Gaps Settings
Zone Invalidation: Choose between "Wick" and "Close".
4. Order Block Settings
Swing Length: Adjusts the minimum number of bars required for OB formation.
Zone Invalidation Method: Select between "Wick" and "Close".
5. Breaker Block Settings
Zone Invalidation: Set invalidation method as "Wick" or "Close".
6. Liquidity Grabs Settings
Pivot Length: Adjusts the number of bars used to detect liquidity grabs.
Wick-Body Ratio: Defines the proportion of wick-to-body size for liquidity grab detection.
7. Multi-Timeframe Analysis
Enable Up to Three Timeframes: Select and analyze trades across multiple timeframes.
8. Market Structures
Swing Length: Defines the number of bars required for structure shifts.
Includes BOS, CHoCH, CHoCH+ Detection.
9. Equal Highs & Lows
ATR Multiplier: Defines the sensitivity of equal highs/lows detection.
10. Volume Imbalances
Gap Size Sensitivity: Ranges from "Ultra" to "Low".
Disable Overnight Gaps: Filters out volume imbalances occurring due to overnight gaps.
11. Entry Conditions for Long & Short Trades
Multiple Conditions (1-6): Configure up to six independent conditions per trade direction.
Condition Types: Options include Detection, Retest, Retracement, and Break.
Timeframe Specification: Choose between "Any Timeframe", "Timeframe 1", "Timeframe 2", or "Timeframe 3".
Trade Execution Filters: Restrict trades within specific trading sessions.
12. Exit Conditions for Long & Short Trades
Exit on Opposite Signal: Automatically exit trades upon opposite trade conditions.
Exit on Session End: Closes all positions at the end of the trading session.
Multiple Take-Profit (TP) and Stop-Loss (SL) Configurations:
TP/SL based on % move, ATR, Ticks, or Fixed Price.
Hard SL option for additional risk control.
Move SL to BE (Break Even) after a certain profit threshold.

Miyagi BacktesterMiyagi: The attempt at mastering something for the best results.
Miyagi indicators combine multiple trigger conditions and place them in one toolbox for traders to easily use, produce alerts, backtest, reduce risk and increase profitability.
The Miyagi Backtester is a standalone backtester which is to be applied to the chart after the Miyagi indicator to be backtested.
The backtester can only backtest one script at a time, and is meant to backtest ONCE PER BAR CLOSE entries.
It is currently not possible to backtest ONCE PER BAR entries.
The backtester will allow users to all Miyagi Indicators using DCA strategies to show returns over a selectable time period.
The backtester allows leverage, and as such users should be aware of the Maximum Amount for Bot Usage and Leverage Required Calculations.
The DCA Selector switch will allow users to backtest with, or without DCA.
Static DCA is used within the backtester and allows users to see DCA Statistics on closed trades.
How to use the Miyagi Backtester
Step 1: Apply the Miyagi Indicator of Choice to backtest (4in1/10in1/Strend).
DATE AND TIME RANGE:
-Date and time range to backtest.
TRADE:
-Entry source to backtest. Please select the "Outbound Entry Signal Sender"
-Trade Direction to backtest. This can be helpful to backtest according to your strategy (long or short).
-Take Profit % to backtest. This is the percent take profit to backtest. Slippage can be accounted for on the "Properties" tab.
-Stoploss % to backtest. This is the percent stoploss to backtest.
DCA:
DCA Checkbox: Enable the DCA Checkbox to backtest with DCA. Disable it to backtest without DCA.
Leverage: Input the Leverage you will trade with.
Base Order Size (% Equity): This is the Base order (BO) size to backtest in % of equity.
Safety Order Size (% Equity): This is the Safety order (SO) size to backtest in % of equity.
Number of DCA Orders: This is the maximum amount of DCA orders to place, or total DCA orders.
Price Deviation (% from initial order): This is the percent at which the first safety is placed.
Safety Order Step Scale: This is the scale at which is applied to the deviation for the step calculation to determine next SO placement.
Safety Order Volume Scale: This is the scale at which is applied to the safety orders for the volume calculation to determine SO Volume.
Real world DCA Example:
The process is as follows.
Base Order: This is your initial order size, $100 used for Base Order
Safety Order: This is your first safety order size, which is placed at the deviation. $100 Safety Order, it is good to keep the same size as your BO for your scaling to be effective.
Price deviation: This is the deviation at which your first Safety order is placed. 0.3-0.75% used by most of our members.
Safety Order Volume Scale: This is the scale at which is applied to the safety orders for the volume calculation. Scale of 2 used, which means that SO2 = (SO1) * 2, or $200. This scaling is typical for all following orders and as such SO3 = (SO2) *2, or $400.
Safety Order Step Scale: This is the scale at which is applied to the deviation for the step calculation. This is similar to the volume scale however the last order percentage is added.
Scale of 2 used, which means that SO2 % = ((Deviation) * 2) + (SO1%). (0.5% *2) + (0.5) = 1.5%.
This scaling is typical for all following orders except that the prior deviation is used and as such SO3 = ((Prior%) * 2) + (Deviation). (1.5% * 2) +(0.5%) or 3.5%.
Total SO Number: The calculations will continue going until the last SO. It is helpful to understand the amount of SO’s and scaling determines how efficient your DCA is.
Backtester Outputs include:
Net Profit to display net profit
Daily Net Profit to estimate
Percent Profitable which shows ratio of winning trades to losing trades.
Total Trades
Winning Trades
Losing Trades (only applicable if stoploss is used)
Buy & Hold Return (of the backtested asset) to compare if the strategy used beats buy & hold return.
Avg Trade Time is very helpful to see average trade time.
Max Trade Time is very helpful to see the maximum trade time.
Total Backtested Time will return total backtested time.
Initial Capital which is taken from the Properties tab.
Max amount for Bot Usage which can be helpful to see bot usage.
Leverage Required will show you the leverage required to sustain the DCA configuration.
Total SO Deviation will allow users to see the drop coverage their DCA provides.
Max Spent which is a % of total account spent on one trade.
Max Drawdown which displays the maximum drawdown of any trade.
Max % distance from entry shows the maximum distance price went away from entry prior to the trade closing.
Max SO Used which shows the maximum number of SO's used on a single trade
Avg SO Used which shows the average number of SO's used in all closed trades.
Deals closing with BO Only calculation will show how many trades are closed without DCA.
Deals closing with 1-7 SOs calculation will show how many trades are closed with DCA, and allow for fine-tuning.
Happy Trading!
This script will be effective to backtest and produce the best settings for each timeframe and pair across all STP Scripts.
This will take a lot of the manual work out of backtesting for our users while improving profit potential.
Happy Trading!

Best Entry Swing MASTER v3 PUBLIC (S.S)Strategy Description (English)
Best Entry Swing MASTER v3 – Quality Mode
The Best Entry Swing MASTER v3 is a structured swing trading and trend-following strategy designed to identify high-probability long and short entries during directional markets.
It combines three core setup types commonly used by momentum and breakout traders:
Breakout (BO)
Pullback Reversal (PB)
Volatility Contraction Pattern (VCP)
The strategy applies multiple layers of confirmation, including multi-EMA trend structure, volatility contraction, volume filters, and an optional market regime filter.
It is suitable for swing trading on higher timeframes (4H, Daily), as well as medium-term trend continuation setups.
Core Concepts
1. Trend Structure
A trend is considered valid when:
Uptrend: Price > EMA20 > EMA50 > EMA100
Downtrend: Price < EMA20 < EMA50 < EMA100
In addition, a simple but effective trend-strength metric is calculated using the percentage spread between EMA20 and EMA100.
This helps avoid signals during sideways or low-volatility environments.
2. Market Regime Filter
The market environment is determined using a higher timeframe benchmark (default: SPY on Daily).
Only long trades are allowed in bullish market conditions
Only short trades in bearish conditions
This significantly reduces false signals in counter-trend conditions.
Entry Logic
Breakout (BO)
A long breakout triggers when:
Price closes above the highest high of the lookback period
Volume exceeds its 20-period average
Trend and market regime confirm
(Optional A+ mode): true volatility contraction is required
Similar logic applies for short breakdowns.
Pullback (PB)
A pullback entry triggers after:
At least two corrective candles
A strong reversal candle (close above previous high for long)
Volume confirmation
Price interacts with EMA20
This structure models classical trend-reentry conditions.
Volatility Contraction Pattern (VCP)
A VCP entry triggers when:
True range contracts over multiple bars
Price holds near the breakout zone
Volume contracts
Trend and market regime are aligned
This setup aims to capture explosive continuation moves.
Quality Modes
The strategy offers two modes:
Balanced Mode
Moderate signal frequency
Broader trend-strength allowance
Suitable for more active traders
A+ Only Mode
Strict confirmation requirements
Only high-quality setups with multiple confluences
Designed to avoid low-probability trades entirely
Risk Management
Risk is managed using an ATR-based stop and target:
Long SL = Close − ATR × 1.5
Long TP = Close + ATR × 3
(Equivalent logic for short positions)
This provides a balanced reward-to-risk profile and avoids overly tight stops.
Early Entry Signals (Optional)
The script offers optional “Early Entry” markers that highlight when a setup is forming but not yet confirmed.
These are not entry signals and are disabled by default for public use.
Intended Use
This strategy is designed for:
Swing trading
Momentum continuation
Trend-following
Multi-day to multi-week trades
It performs best on:
4H
Daily
High-liquidity equities, indices, and futures
Disclaimer
This script is intended for educational and research purposes.
Past performance does not guarantee future results.
Always backtest thoroughly and use appropriate risk management.

A+ Setup Strategy Trendline Features Added:
1. Automatic Trendline Detection
Support Trendline (green) - Connects swing lows
Resistance Trendline (red) - Connects swing highs
Uses pivot points to identify key swing levels
Validates trendlines by counting touches (minimum 3 touches required)
2. Trendline Settings
Show Trendlines - Toggle on/off
Lookback Period - How far back to look for pivots (default: 50 bars)
Min Touches - How many touches needed for valid trendline (default: 3)
3. Trendline Break Detection
Bullish Break - Price breaks above support trendline (marked with small green circle)
Bearish Break - Price breaks below resistance trendline (marked with small red circle)
Generates signals when breaks occur
4. Enhanced A+ Setups
Now includes ULTRA setups - the absolute best trades:
ULTRA BUY Setup (Aqua label):
Bullish FVG + BOS + Volume Spike + Uptrend
PLUS: Support trendline break OR near key support
PLUS: Trendline breakout confirmation
ULTRA SELL Setup (Fuchsia label):
Bearish FVG + BOS + Volume Spike + Downtrend
PLUS: Resistance trendline break OR near key resistance
PLUS: Trendline breakdown confirmation
5. Confluence Integration
The strategy now considers price near trendlines as additional confluence, similar to how it uses daily S/R levels.
6. Additional Alerts
Support Trendline Break
Resistance Trendline Break
ULTRA BUY/SELL Setup alerts
This gives you multiple tiers of signal quality:
Standard A+ Setup - All conditions met
ULTRA A+ Setup - All conditions + trendline break (highest probability)
The trendlines will help you identify major trend reversals and breakouts for even better entry timing!

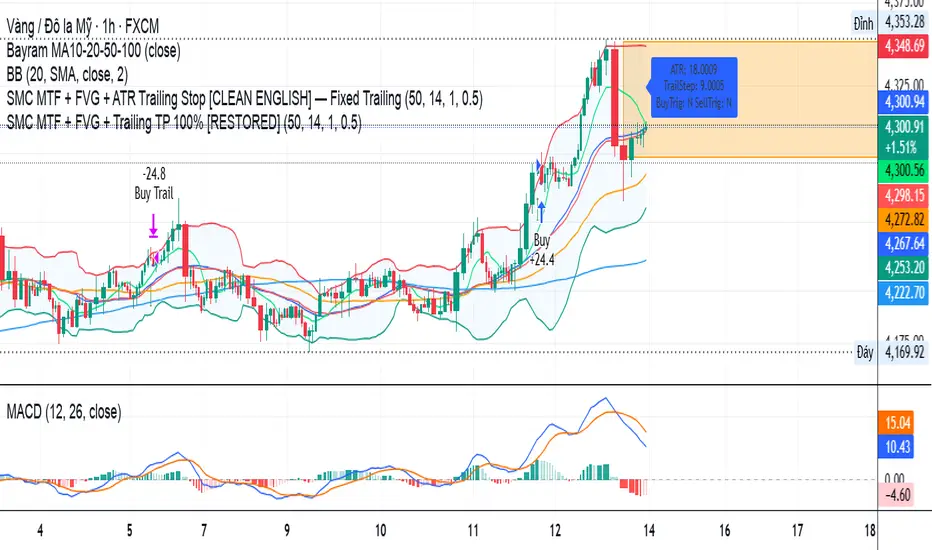
SMC MTF + FVG + Trailing TP 100% [FIXED]Component Description
Entry Timeframe: H1
Trend Filter: D1 (EMA50 vs EMA200)
Trend Filter Only enter BUY orders if EMA50 > EMA200 on D1 (uptrend)
Only enter SELL orders if EMA50 < EMA200 (downtrend)
Break of Structure (BOS) Identify the previous swing high/low breakout point
Order Block (OB) The candle area before BOS is marked with an orange box
Fair Value Gap (FVG) Check for the presence of a price gap to confirm Entry
Trailing TP Trigger trailing after reaching the desired R (in pips or ATR)
Mario vr SIT MC Utilizar en el gráfico
4
1
55
🧠 Market Structure Pro System – MVR
Market Structure Pro System – MVR is an advanced trading strategy designed to detect key reversal and trend-break zones with high precision.
It combines multiple professional tools within a single algorithm — integrating market structure, dynamic channels, volatility filters, and trend confirmations — making it ideal for scalping and swing trading across different markets (Forex, indices, cryptocurrencies, or stocks).
⚙️ How it works
The algorithm performs a complete structural analysis of the market through several technical layers:
🔹 1. Price Structure (BOS, Supply & Demand)
The system automatically detects:
Order Blocks
Supply and Demand Zones
Break of Structure (BOS) to identify market structure shifts
This allows traders to recognize where price is likely to react or break a trend, anticipating major market movements.
🔹 2. Keltner Channels and Linear Regression
The strategy uses multiple Keltner Channels with different settings to measure volatility expansion and contraction.
In combination, a dynamic linear regression line shows the overall market direction, helping confirm whether price is trending or ranging.
🔹 3. Volatility and Trend Filters
It integrates several complementary systems:
ATR (Average True Range): measures the strength and volatility of price movement.
PSAR (Parabolic SAR): identifies potential trend reversals.
Supertrend: acts as the main trend filter and confirmation tool.
These filters work together to avoid false signals in ranging or low-volatility conditions.
🔹 4. Swing Highs / Lows and Dynamic Lines
The indicator also marks swing high and low points, helping visualize dynamic support and resistance levels and potential price reversal areas.
📈 Signal Interpretation
BUY signals:
Occur when price breaks a demand zone or bearish structure, while trend filters (Supertrend / PSAR) confirm bullish direction.
SELL signals:
Trigger when price breaks a supply zone or bullish structure, with bearish confirmation from the trend filters.
These conditions can be further validated by visual confirmations from the Keltner Channel or a color change in the linear regression.
Script protegido
Este script se publica como código cerrado. Sin embargo, puede utilizarlo libremente y sin limitaciones: obtenga más información aquí.
mariovr_usd
Exención de responsabilidad
La información y las publicaciones que ofrecemos, no implican ni constituyen un asesoramiento financiero, ni de inversión, trading o cualquier otro tipo de consejo o recomendación emitida o respaldada por TradingView. Puede obtener información adicional en las Condiciones de uso.
1 comentario

Enhanced OB Retest Strategy v7.0The OB Retest Strategy is a full Order Block retest trading system that detects, plots, and trades OB zones across multiple timeframes. It uses structure breaks, retrace depth, and ATR filters to identify strong reversal or continuation setups.
⸻
⚙️ Core Features
• Multi-timeframe OB detection using break-of-structure (BOS) logic
• Automatic zone creation for bullish and bearish order blocks
• Smart merging of overlapping OB zones
• Dynamic flip-zone logic that turns invalidated OBs into new zones
• Wick zone detection for high-precision entries
• ATR-based trailing stop and optional breakeven
• Adjustable retrace depth, breakout %, and ATR filters
• Built-in performance table showing PnL, win rate, and total trades
• Fully backtestable with date range and commission control
⸻
🧠 Logic Summary
1. Detects a BOS on the higher timeframe.
2. Identifies the last opposing candle as the valid OB.
3. Validates the OB based on ATR size and breakout strength.
4. Waits for price to retest the zone to a set depth.
5. Executes trades and manages exits using trailing stop or breakeven.
6. Flips invalidated zones automatically.
⸻
💡 Usage Tips
• Best used on 1H to 4H charts for swing setups.
• Tune ATR and breakout thresholds for your market’s volatility.
• Combine with higher-timeframe bias or liquidity levels for better accuracy.
⸻
⚠️ Notes
• For educational and testing purposes only.
• Backtested results do not predict future performance.
• Always test before live use.

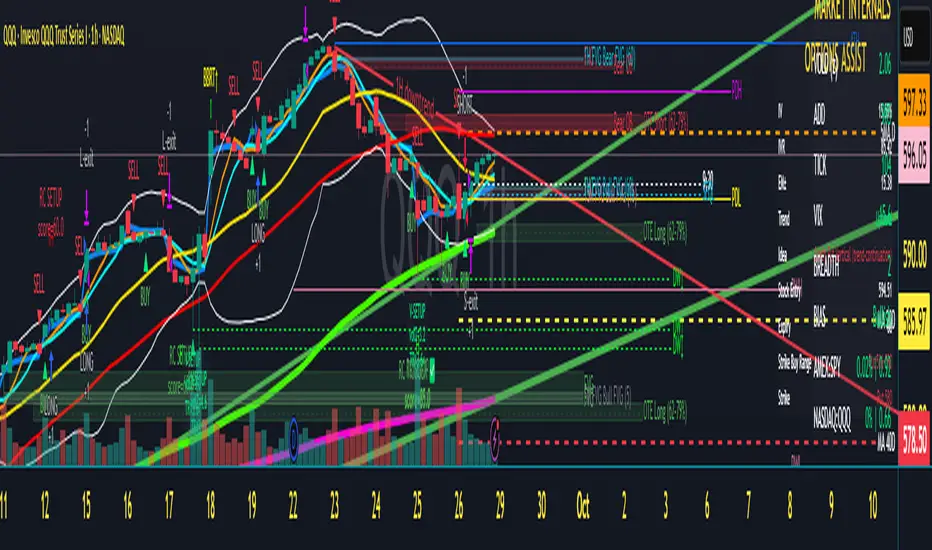
Scalper's Dream by Chino,CHINO’S ICT MES/MNQ Strategy — FVG/BOS/OTE/PD + VWAP + SMA + BB Squeeze/Failure
Summary
Intraday ICT-inspired toolkit tuned for MES/MNQ (also effective on equities/ETFs and crypto). It blends Fair Value Gaps (FVG) — including multi-timeframe FVG (MTF FVG) with first-touch and min-gap filters — Break of Structure (BOS), Optimal Trade Entry (OTE), and Prior-Day levels with VWAP, SMA gates, 9:30 Open, Session Equilibrium (EQ), custom ORB, and Key Rejection Levels (KRL). It also includes Accumulation/Distribution phase reads and Manipulation cues (e.g., liquidity sweeps/stop-runs) to contextualize trend transitions. On top, it adds Bollinger Band squeeze breakouts & failure reversals, V/A shape reversal detectors, Volume-boosted buy/sell signals with Reversal Candle Assist, Asia/London/New York sessions, an Options Assist HUD, and a Market Internals HUD.
Disclaimer: This tool is for education and research purposes only and is not financial advice. Test thoroughly in replay/paper before live trading.
SMPivot Gaussian Trend Strategy [Js.K]This open-source strategy combines a Gaussian-weighted moving average with “Smart Money” swing-pivot breaks (BoS = Break-of-Structure) to capture trend continuations and early reversals. It is intended for educational and research purposes only and must not be interpreted as financial advice.
How the logic works
-------------------
1. Gaussian Moving Average (GMA)
• A custom Gaussian kernel (length = 30 by default) smooths price while preserving turning points.
• A second pass (“Smoothed GMA”) further filters noise; only its direction is used for bias.
2. Swing-Pivot detection
• High/Low pivots are found with a symmetric look-back/forward window (Pivot Length = 20).
• The most recent confirmed pivot creates a dynamic structure level (UpdatedHigh / UpdatedLow).
3. Entry rules
Long
• Price closes above the most recent pivot high **and** above Smoothed GMA.
Short
• Price closes below the most recent pivot low **and** below Smoothed GMA.
4. Exit rules
• Fixed stop-loss and take-profit in percent of current price (user-defined).
• Separate parameters and on/off switches for longs and shorts.
5. Visuals
• GMA (dots) and Smoothed GMA (line).
• Structure break lines plus “BoS PH/PL” labels at the midpoint between pivot and break.
Inputs
------
Gaussian
• Gaussian Length (default 30) – smoothing window.
• Gaussian Scatterplot – toggle GMA dots.
Smart-Money Pivot
• Pivot Length (default 20).
• Bull / Bear colors.
Risk settings
• Long / Short enable.
• Individual SL % and TP % (default 1 % SL, 30 % TP).
• Strategy uses percent-of-equity sizing; initial capital defaults to 10 000 USD.
Adjust these to reflect your own account size, realistic commission and slippage.
Best practice & compliance notes
--------------------------------
• Test on a data sample that yields ≥ 100 trades to obtain statistically relevant results.
• Keep risk per trade below 5–10 % of equity; the default values comply with this guideline.
• Explain any custom settings you publish that differ from the defaults.
• Do **not** remove the code header or licence notice (MPL-2.0).
• Include realistic commission and slippage in your back-test before publishing.
• The script does **not** repaint; orders are processed on bar close.
Usage
-----
1. Add the script to any symbol / timeframe; intraday and swing timeframes both work—adjust lengths accordingly.
2. Configure SL/TP and position size to match your personal risk management.
3. Run “List of trades” and the performance summary to evaluate expectancy; forward-test before live use.
Disclaimer
----------
Trading involves substantial risk. Past performance based on back-testing is not necessarily indicative of future results. The author is **not** responsible for any financial losses arising from the use of this script.

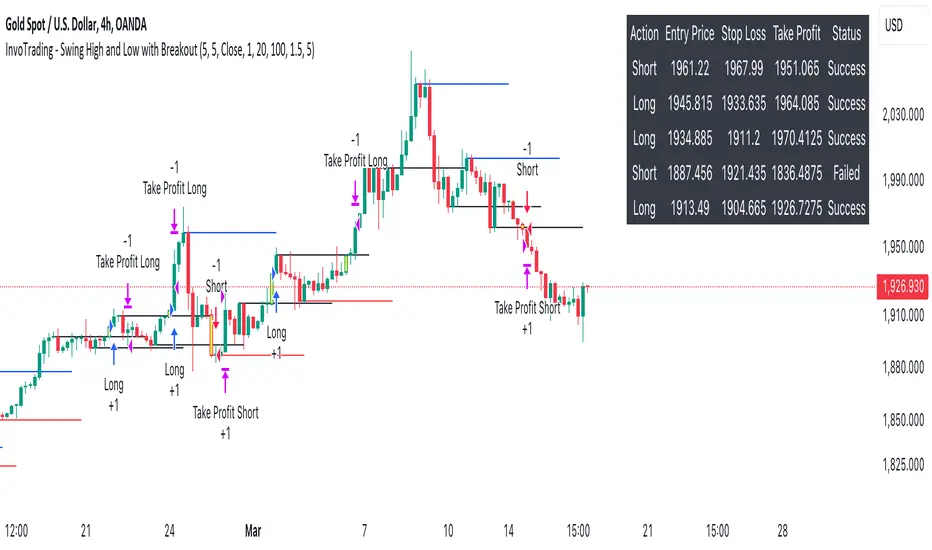
InvoTrading - Swing High and Low with BreakoutInvoTrading - Swing High and Low with Breakout Strategy
This strategy is designed to identify trading opportunities based on swing highs and lows, combined with breakout confirmations. It utilizes pivot points to detect potential reversal levels and initiates trades when the price breaks out of these levels under specific conditions.
Key Features:
- Pivot Points: The strategy calculates pivot highs and lows using customizable left and right bars. These pivots represent potential swing points in the market.
- Breakout Detection: It monitors for breakouts above pivot highs (Bullish Break of Structure - BOS) and below pivot lows (Bearish Break of Structure).
- Strong Swings (Optional): You can enable "Strong Swing" detection, which considers only those pivots where the price attempted but failed to break the pivot level, indicating stronger support or resistance.
- Trade Management: The strategy sets entry points, stop losses, and take profits based on a customizable risk-reward ratio.
- Trade Table: An optional table displays recent trades, including their status (Pending, Success, or Failed).
- Visual Aids: Customizable colors and line settings help visualize pivot points, strong swings, and breakout candles on the chart.
---
Settings:
1. Pivot Settings:
- Left Bars: Number of bars to the left of the pivot point (default: 5).
- Right Bars: Number of bars to the right of the pivot point (default: 5).
- Pivot Based On: Choose between "High/Low" or "Close" prices for pivot calculations.
2. Color Settings:
- Pivot High Color: Color for Pivot High markers (default: Blue).
- Pivot Low Color: Color for Pivot Low markers (default: Red).
- Strong Swing High Color: Color for Strong Swing High markers (default: Black).
- Strong Swing Low Color: Color for Strong Swing Low markers (default: Black).
- Breakout Candle Color (BOS): Color for the breakout candle (default: Yellow).
3. Line Settings:
- Line Width: Width of the pivot lines (default: 1).
- Line Length (Bars): Length of the pivot lines in bars (default: 20).
- Maximum Number of Lines to Keep: Limits the number of pivot lines displayed to avoid clutter (default: 100).
4. Trade Settings:
- Enable Buy and Sell Signals: Activates trade entries and exits on the chart (default: False).
- Show Trades Table: Displays a table summarizing recent trades (default: False).
- Risk-Reward Ratio: Sets the desired risk-reward ratio for trades (default: 1.5).
- Number of Trades to Display: Maximum number of recent trades shown in the table (default: 5).
- Enable Strong Trade: Only triggers trades when a "Strong Swing" is detected (default: False).
---
How It Works:
- Pivot Detection: The script identifies pivot highs and lows based on the specified number of left and right bars.
- Strong Swings: If enabled, the strategy marks a pivot as a strong swing if the price attempts to break it but closes back within the pivot level.
- Breakout Confirmation:
- Long Entry: Occurs when the price closes above a pivot high, signaling a bullish breakout. If "Strong Trade" is enabled, it must be a strong swing high.
- Short Entry: Occurs when the price closes below a pivot low, signaling a bearish breakout. If "Strong Trade" is enabled, it must be a strong swing low.
- Trade Execution: Upon a valid breakout, the strategy places a trade with a stop loss set at the previous candle's low (for longs) or high (for shorts). The take profit is calculated based on the specified risk-reward ratio.
- Trade Monitoring: The strategy updates the status of each trade (Pending, Success, Failed) based on whether the take profit or stop loss is hit.
- Visualization: Breakout candles are highlighted, and pivot lines are drawn with customizable colors and widths. Strong swings are marked distinctly.
---
Usage Tips:
- Backtesting: Before using this strategy live, backtest it on different time frames and instruments to assess its performance.
- Customization: Adjust the pivot settings and risk-reward ratio to match your trading style and the volatility of the instrument you're trading.
- Risk Management: Always use proper risk management techniques, even though the strategy calculates stop losses and take profits.
Strategy: Range BreakoutWhat?
In the price action, levels have a significant role to play. Based on the price moving above/below the levels - the underlying instrument shows some price-action in the direction of breakout/breakdown.
There are plenty of ways level can be determined. Levels are the decision point to take a trade or not. But if we make the level derivation complex, then the execution may get hamper.
This strategy script, developed in PineScript v5, is our attempt at solving this problem at the core by providing this simple, yet elegant solution to this problem.
It's essentially an attempt to Trade Simple by drawing logical (horizontal) lines in the chart and take actions, after multiple associated parameters confirmation, on the breakout / breakdown of the levels.
How?
Let us explain how we are drawing the levels.
We are depending on some of the parameters as described below:
Open Range : During intraday movement, often if prices move beyond a particular level, it exibits more movement in the same swing in same direction. We found out, through our back testing for Indian Indices like NSE:NIFTY , NSE:BANKNIFTY or NSE:CNXFINANCE the first 15m (i.e 09:15 AM to 09:30 AM, IST) is one of such range. For Indian stocks, it is 9:15 to 9:45. And for MCX MCX:CRUDEOIL1! it's 5:00 pm to 6:00 pm. There are our first levels.
PDHCL : Previous Day High, Close, Low. This is our next level
VWAP : The rolling VWAP (volume weighted average price)
In the breakout/breakdown of the Open Range and Previous Day High/Low, we are taking the trade decisions as follows using CEST principle:
C onditions :
If current bar's (say you are in 5m timeframe) closing is broken out the Open Range High or Previous Day High, taken a Buy/Long decision (let's say buying a Call Option CE or selling a Put Option PE or buying the future or cash).
If current bar's (say you are in 5m timeframe) closing is broken down the Open Range Low or Previous Day Low, taken a Sell/Short decision (let's say buying a Put Option CE or selling a Call Option PE or selling the future or cash).
Additionally, and optionally (default ON, one can turn off): we are checking various other associated multiple confirmations as follows:
1. Momentum : Checking 14-period RSI value is more than 50 or less than 50 (all parameters like period, OB, OS ranges are configurable through settings)
2. Current bar's volume is more than the last 20 bars volume average. How much more - that multiplier is also configurable. (default is 1)
3. The breakout candle is bullish (green) or bearish (red).
E ntry :
All of these happens only on the closing of the candle . Means: Non Repainting! .
Clearly in the chart we are showing as green up arrow BO (breakout for buy) and red down arrow BD (breakdown for sell) to take your decision process smooth.
So, on the closing of the decision BO/BD candle we are entering the trade (with a thumping heart and nail biting ...)
S top Loss :
We are relying on the time tasted (last 40 years) mechanism of Average True Range (ATR) of default 14 period. This default period is also configurable.
So for Long trades: the 14 period ATR low band is the SL.
For Short trades: the 14 period ATR high band is the SL.
T arget :
We are depending on the thump rule of 1:2 Risk Reward. It's simple and effective. No fancy thing. We are closing the trade on double the favorable price movement compared to the SL placed. Of course, this RR ratio is confiurable from the settings, as usual.
What's Unqiue in it?
The utter simplicity of this trading mechanism. No fancy things like complex chart pattern, OI data, multiple candlestick patterns, Order flow analysis etc.
Simple level determination,
Marking clearly in the chart.
Making each parameter configurable in Settings and showing tooltip adjacent to the parameter to make you understand it better for your customization,
Wait for the candle close, thus eliminating the chances of repainting menace (as much as possible)
Additional momentum and volume check to trade entry confirmation.
Works with normal candlestick (nothing special ones like HA ...)
Showing everything as a Summary Table (which, again can be turned off optionally) overlaying at the bottom-right corner of the chart,
Optionally the Summary Table can be configured to alert you back (say you get it notified in your email or SMS).
That way, a single, simple, effective trade setup will ease your journey as smooth sail as possible.
Mentions
There are plenty of friends from whom time to time we borrowed some of the ideas while working closely together over last one year.
From tradingview community, we took the spirit of @zzzcrypto123 awesome work done long back (in 2020) as the indicator "ORB - Opening Range Breakout". (We tried to reach him for his explicit consent, unable to catch hold of him).
Some other publicly available materials we have consulted to get the additional checks (like RSI, volume).
Lat word
Use it please and thank you for your constant patronage in following us in this awesome platform. Let's keep growing together.
Disclaimer :
This piece of software does not come up with any warrantee or any rights of not changing it over the future course of time.
We are not responsible for any trading/investment decision you are taking out of the outcome of this indicator.

Forex Midpoint Stratejisi For Nasdaq English Knowledge:
Midpoint Strategy;
The general calculation method is a strategy that helps determine direction by the intersection of a MA line and the value obtained by dividing the lowest and highest price in the specified length range.
Başlangıç Periyodu: The data length of the Midpoint Line.
Kaydırma Seviyesi: The number of steps forward or backward of the Midpoint Line.
Yüzde Seviyesi: the amount of vertical scrolling.
Uzunluk: The length of the MA line
represents.
This strategy is prepared for the Nasdaq 5-minute period. It needs to be optimized for use on other instruments.
There are take profit and stop loss levels within the codes. Friends who want to use it can remove the invisibility from the relevant sections. Also, I removed the midpoint and the MA line so that it does not crowd the image, you can add it if you want.
Thank you.
Turkish Knowledge:
Midpoint Stratejisi;
Genel hesaplama yöntemi, belirlenen uzunluk aralığındaki en düşük ve en yüksek fiyatın ikiye bölümü ile elde edilen değer ve bir ortalama çizgisinin kesişimleriyle yön belirlemeye yardımcı bir stratejidir.
Başlangıç Period: Midpoint Çizgisinin veri uzunluğunu.
Kaydırma Seviyesi: Midpoint Çizgisinin ileri veya geri adım sayısını.
Yüzde Seviyesi: dikey kaydırma miktarını.
Uzunluk: Ortalama çizgisinin uzunluğunu
temsil etmektedir.
Bu strateji Nasdaq 5 dakikalık periot için hazırlanmıştır. Diğer enstrümanlarda kullanılması için optimize edilmesi gerekir.
Kodların içinde Kar alma , zarar durdurma seviyeleri mevcuttur. Kullanmak isteyen arkadaşlar ilgili bölümlerden görünmezliği kaldırabilirler. ayrıca midpoint ve ortalama çizgisinide görüntü kalabalığı yapmaması için ben kaldırdım isterseniz siz ekleyebilirsiniz.
Teşekkürler.

VXD SupercycleVXD is a brand new indicator and still developing. to minimize stop losses and overcome sideways market conditions, Higher Timeframe are recommended
Trend lines
-using Rolling VWAP as trend line to determined if Volume related to a certain price.
-you can switch RVWAP to EMA in the setting
ATR
-trailing 12*ATR and 2.4 Mutiplier
Pivot point and Rejected Block
Pivot show last High and low of a price in past bars
Rejected Block show when that High or Low price are important level to determined if it's Hidden Divergence or Divergence
Symbols on chart show Premium and Discount Prices
X-Cross - show potential reversal trend with weak volume .
O-circle - show potential reversal trend with strong volume .
Setting
Momentum: RSI = 25 , RSI MA = 14
Trend: Rolling VWAP and ATR and Subhag
Trailing STOP: ATR 12 x 2.4
Highlight Bars color when volume is above SMA 6
SMA200 act as TP Line
Risk:Reward Calculation
if Buy your Stoploss will be previous Pivot low
if Sell your Stoploss will be previous Pivot high and will be calculated form there, then show TP in Orange color line
VXD เป็นระบบเทรดที่ผมทดลองเอาหลาย ๆ ไอเดีย ทั้งจาก Youtube facebook และกลุ่มคนต่าง ๆ มารวบรวมไว้ แล้วตกผลึกขึ้นมาเป็นระบบนี้ ใน Timeframe ใหญ่ ๆ สามารถลากได้ทั้ง Cycle กันเลย
Trend lines
-ใช้ Rolling VWAP ของแอพ Tradingview (สามารถตั้งแค่าเป็น EMA ได้)
ATR
-ใช้ค่า ATR 12 Mutiplier 2.4
Pivot point and Rejected Block
Pivot โชว์เส้น High low และมีผลกับออเดอร์ หากแท่งเทียนปิดทะลุเส้นนี้
Rejected Block วาดแนวรับ-ต้าน อัตโนมัติ ใช้ประกอบ RSI ว่ามี Divergence หรือไม่
สัญลักษณ์ต่าง ๆ
X-Cross - แท่งกลืนกิน วอลุ่มน้อย
O-circle - แท่งกลืนกิน มีวอลุ่ม
Setting
Momentum: RSI = 25 , RSI MA = 14
Trend: Rolling VWAP and ATR and Subhag
Trailing STOP: ATR 12 x 2.4
Highlight Bars color when volume is above SMA 6
SMA200 act as TP Line
Risk:Reward Calculation
หาก Buy จุด SL จะอยู่ที่ Pivot low
หาก Sell จุด SL จะอยู่ที่ Pivot high และระบบจะคำนวณจากตรงนั้น จากนั้นแสดงเป็นเส้น TP สีส้ม
This Strategy Combined the following indicators and conditioning by me
ATR , RSI , EMA , SMA
Rolling VWAP - /script/ZU2UUu9T-Rolling-VWAP/
Regression Lines - Subhag form Subhag Ghosh /script/LHHBVpQu-Subhag-Ghosh-Algo-Version-for-banknifty/
Rejection Block , Pivots , High Volume Bars and PPDD form Super OrderBlock / FVG / BoS Tools by makuchaku & eFe /script/aZACDmTC-Super-OrderBlock-FVG-BoS-Tools-by-makuchaku-eFe/
ขอให้รวยครับ.

USOIL BOS Retest Strategy 2.0 This is generating 4.73% return nothing wow but will form the base of my trading engine

Recovery Adaptive Strategy [Starbots]🔁 Recovery Adaptive Strategy
Recovery Adaptive Strategy is an advanced, single-position trading strategy designed for professional traders who require adaptive exposure control, dynamic profit targeting, and rule-based recovery mechanics in high-volatility market environments.
The strategy applies a structured loss-streak framework where position sizing and take-profit objectives evolve systematically based on prior trade outcomes, while maintaining strict one-position execution at all times.
🧠 Strategic Framework
This strategy is built around a controlled adaptive execution model:
Only one position is active at any time
Each closed trade directly influences the parameters of the next entry
After a losing trade:
Position size scales according to a defined factor
Take-profit expands proportionally using a configurable multiplier
After a winning trade:
All parameters reset to their base configuration
Scaling progression is capped via a configurable maximum step limit
The methodology is designed to efficiently capitalize on expansion phases, volatility impulses, and directional inefficiencies, making it particularly suitable for high-volatility instruments and regimes.
⚙️ Adaptive Position Management
Position Sizing Modes
Percentage of Equity
Fixed Base Currency Amount (USDT / USD / EUR, etc.)
Each subsequent step applies a configurable size multiplier, enabling precise control over exposure progression across loss streaks.
🎯Dynamic Take-Profit Scaling
Take-profit levels increase automatically with each scaling step
A dedicated TP multiplier allows fine-tuning of profit expansion behavior
All targets are recalculated and updated dynamically while positions are open
Execution Control
Single-position logic (no grid, no concurrent hedging)
Optional forced exit and full reset upon reaching the maximum scaling step
Bar-confirmed execution to avoid signal repainting
📈 Signal Generation & Market Filters
The strategy supports multiple professional-grade entry models, selectable via settings:
MACD (12,26,9)
DMI (14)
RSI (70 / 30)
Stochastic (14,3,3)
Bollinger Bands + RSI
Market Structure (BOS / CHoCH)
Additional execution layers include:
Higher-timeframe signal evaluation
Volatility-based trade filtering
EMA trend alignment
Flat-market detection (optional)
The strategy is optimized for active, volatile markets, where price expansion and follow-through are frequent.
📊 Institutional-Style Analytics & Visualization
Integrated analytics provide full transparency into strategy behavior:
Adaptive Scaling Table
Position size per step
Take-profit expansion per step
Loss-streak hit distribution
On-Chart Execution Labels
Equity Usage Overview
Monthly & Yearly Performance Calendar
Backtest vs. Leverage Projection Dashboard
All dashboards and visual components are optional and configurable.
🧩 Intended Use
This strategy is designed for:
Advanced discretionary traders
Systematic traders
Quantitative research and optimization
High-volatility instruments and environments
It emphasizes structure, adaptability, and execution discipline, rather than static position sizing or fixed targets.

VWAP Pullback + BOS + OBV v2 (Crypto Futures 15m)This strategy combines VWAP pullbacks, break-of-structure entries, and OBV confirmation to catch high-quality trend continuation moves on crypto futures. It waits for price to trend above or below the 200 EMA, then pulls back into the VWAP band, signaling a potential reload zone. A trade only triggers when price breaks recent structure in the direction of the trend and OBV shows supportive volume flow. An ATR volatility filter blocks entries during choppy, low-energy periods, and all trades use an ATR stop-loss with fixed reward-to-risk targeting. The result is a cleaner, more disciplined trend-following system designed for 15m–30m BTC/ETH scalping.

Trend Signal MomentumOVERVIEW
Signal Trend Momentum is a hybrid strategy that combines multiple confirmations and filters to obtain better potential trading signals. Each confirmation and filter in Signal Trend Momentum aims to avoid possible false and trap signals.
HYBRID CONCEPTS
Smart Money Concept – This indicator forms market structure and Bullish & Bearish Order Block areas to make it easier to identify market trends and strong areas where price reversals often occur. Its purpose is to simplify recognizing market direction and serve as the first confirmation.
MSS + BOS (Market Structure Shift + Break of Structure) – This indicator serves as additional confirmation for the Smart Money Concept. With the presence of two types of market structure, the market trend direction becomes clearer and more convincing.
RSI Momentum Signal – This indicator becomes the third confirmation. When the Market Trend is clear and convincing, supported by the formation of Bearish and Bullish Order Blocks, the role of the Momentum Signal here becomes crucial as it provides trend momentum based on overbought and oversold areas.
Momentum Position – This indicator becomes the next confirmation based on buyer and seller VOLUME in the market. If buyer volume is higher, the momentum position will be depicted on the chart with an upward arrow, and conversely, if seller volume is higher, it will be depicted with a downward arrow.
SnR (Support and Resistance) – This final indicator is Support and Resistance, which will serve as the last and more convincing confirmation. Support and Resistance will strengthen the Order Block areas formed by the Smart Money Concept indicator. A Bullish Order Block + Support creates a higher possibility for an upward trend in the market, conversely, a Bearish Order Block + Resistance creates a higher possibility for a downward trend in the market.
The combination of these several indicators will provide a strong market direction + persistent buyer and seller areas, as well as depict momentum based on volume + RSI which serve as additional confirmations.
These additional confirmations will produce stronger signals and help avoid false and trap signals in the market.
HOW TO USE
A SHORT SIGNAL will be strong if there is a Downtrend Market Structure + Bearish Order Block + Resistance + Oversold RSI Momentum + Strong Seller Volume Momentum.
A LONG SIGNAL will be strong if there is an Uptrend Market Structure + Bullish Order Block + Support + Overbought RSI Momentum + Strong Buyer Volume Momentum.
CONCLUSION
Signal Trend Momentum is a combination of several powerful indicators designed to produce stronger, clearer, and easier-to-read signals.
This strategy is highly suitable for traders seeking more convincing trade signals based on multiple confirmations from the combined indicators, thereby creating a strong signal with a higher probability.

GOLDM Dow Theory – 1H Trend + 5m Pullback1. Strategy Overview
Instrument: MCX GOLDM
Chart timeframe: 5 minutes
Side: Long-only
Position size: Fixed 3 lots
Core idea:
Trade only in 1H uptrend, enter after a 5m pullback and breakout, with basic volume/volatility filters and ATR-based SL/TP.
2. High-Level Logic Flow (Per Bar)
On every 5-minute bar, the script does this:
Update session/time, volume, and ATR filters
Read 1H trend from higher timeframe
Update 5m pullback state (whether a valid dip happened)
Check if there is a valid breakout back in the direction of the 1H trend
If all filters + conditions align → enter Long (3 lots)
While in a trade:
Manage SL/TP using ATR
Close trade if 1H trend flips down or price closes below 5m EMA
Everything else (plots, alerts) is just for visibility and convenience.
3. Inputs & Configuration
Main inputs:
pullbackLookback – how many 5m bars to look back to detect a pullback
breakoutLookback – how many bars to consider for recent swing high
emaLenTrendFast / emaLenTrendSlow – 1H EMAs (50/200) for trend
emaLenPullback – 5m EMA used for pullback logic (default 20)
tradeSession – default "0900-2315" (you can change)
volLookback, volMult – volume filter
atrLen, atrSmaLen – ATR filter
slATRmult (1.4), tpATRmult (3.0) – ATR multiples → ~1.4 : 3 RR
4. Session / Time Filter
tradeSession = "0900-2315"
inSession = not useSessionFilter or not na(time(timeframe.period, tradeSession))
Only allows entries when the current bar’s time is inside 09:00–23:15.
If useSessionFilter is false, this filter is ignored.
No trade opens outside this window, but existing trades can still exit.
5. Volume & Volatility Filters
Volume Filter
avgVol = ta.sma(volume, volLookback)
highVolume = not useVolumeFilter or (volume > avgVol * volMult)
If enabled, current bar’s volume must be greater than average volume × multiplier.
Purpose: avoid thin, illiquid periods.
ATR Filter
atr5 = ta.atr(atrLen)
atrSma = ta.sma(atr5, atrSmaLen)
goodATR = not useATRFilter or (atr5 > atrSma)
If enabled, current ATR must be above its own moving average.
Purpose: avoid flat / extremely low-volatility periods.
Only if both highVolume and goodATR are true, the system considers entering.
6. Higher Timeframe Trend (1H)
emaFast1h = request.security(syminfo.tickerid, "60", ta.ema(close, emaLenTrendFast), ...)
emaSlow1h = request.security(syminfo.tickerid, "60", ta.ema(close, emaLenTrendSlow), ...)
trendUp = emaFast1h > emaSlow1h
trendDown = emaFast1h < emaSlow1h
On the 1-hour timeframe:
If EMA Fast (50) > EMA Slow (200) → trendUp = true
If EMA Fast (50) < EMA Slow (200) → trendDown = true
This is the core trend filter:
We only look for longs when trendUp is true.
7. 5-Minute Structure Logic (Dow-style)
7.1 Pullback Detection
emaPull = ta.ema(close, emaLenPullback)
pulledBackLong = ta.lowest(close, pullbackLookback) < emaPull
A pullback is defined as:
In the last pullbackLookback bars, price closed below the 5m EMA (emaPull) at least once.
This indicates a dip against the 1H uptrend.
A state flag tracks this:
var bool hadLongPullback = false
hadLongPullback := trendUp and pulledBackLong ? true : (not trendUp ? false : hadLongPullback)
When:
trendUp AND pulledBackLong → hadLongPullback = true.
If the trend stops being up (trendUp = false), flag resets to false.
So the system remembers:
“There has been a proper dip while the 1H uptrend is active.”
7.2 Breakout Confirmation
recentHigh = ta.highest(high, pullbackLookback)
breakoutUp = close > recentHigh
After a pullback, we wait for price to close above the highest high of recent bars (excluding the current one).
This mimics:
“Higher high after a higher low” → breakout in Dow Theory terms.
8. Final Long Entry Logic
The base entry condition:
baseLongEntry =
trendUp and
hadLongPullback and
breakoutUp and
close > emaPull
Translated:
1H trend is up (trendUp).
A valid pullback happened recently (hadLongPullback).
Current candle broke above the recent swing high (breakoutUp).
Price is now back above the 5m EMA (pullback is resolving, not deepening).
Then filters are applied:
longEntryCond =
baseLongEntry and
inSession and
highVolume and
goodATR and
not isLong
So a long entry only occurs if:
Core structure conditions (baseLongEntry) are true
Time is within session
Volume is high enough
ATR is healthy
You are not already in a long
When longEntryCond is true:
if longEntryCond
strategy.entry("Long", strategy.long, comment = "Dow Long: Trend+PB+BO")
hadLongPullback := false
Enters 3 lots long (as per default_qty_type + default_qty_value).
Resets hadLongPullback so we don’t re-use the same pullback.
9. Exit Logic
There are two exit layers:
9.1 Logical Exit (Trend or Structure Change)
exitLongTrendFlip = trendDown
exitLongEMA = ta.crossunder(close, emaPull)
longExitCond = isLong and (exitLongTrendFlip or exitLongEMA)
If in a long:
Exit when trend flips down (1H EMA50 < EMA200), OR
Price crosses below 5m EMA (pullback may be turning into reversal).
Then:
if longExitCond
strategy.close("Long", comment = "Exit Long: Trend flip / EMA break")
This closes the position at market (on bar close).
9.2 ATR-based Stop Loss & Take Profit
if useSLTP and isLong
longStop = strategy.position_avg_price - atr5 * slATRmult
longLimit = strategy.position_avg_price + atr5 * tpATRmult
strategy.exit("Long SLTP", "Long", stop = longStop, limit = longLimit)
SL = entry price – 1.4 × ATR(14, 5m)
TP = entry price + 3.0 × ATR(14, 5m)
This gives roughly 1.4 : 3 RR.
If SL or TP is hit, strategy.exit will close the trade.
So exits can come from:
Hitting Stop Loss
Hitting Take Profit
OR logic-based exit (trend flip / EMA break)
10. Alerts
Two alertconditions:
alertcondition(longEntryCond, title="Long Entry Signal",
message="GOLDM LONG: 1H Uptrend + 5m Pullback Breakout + Filters OK")
alertcondition(longExitCond, title="Long Exit Signal",
message="GOLDM LONG EXIT: Trend flip or EMA break")
You can set TradingView alerts based on:
“Long Entry Signal” → tells you when all entry conditions align.
“Long Exit Signal” → tells you when the logic-based exit triggers.
(ATR SL/TP exits won’t auto-alert unless you separately set price alerts or add extra conditions.)
11. Mental Model Summary (How YOU should think about it)
For every trade, the system is basically doing this:
Is GOLDM in an uptrend on 1H?
→ If no: do nothing
Did we get a clear dip below 5m EMA in that uptrend?
→ If no: wait
Did price then break above recent highs and reclaim EMA20?
→ If yes: this is our Dow-style continuation entry
Is market liquid and moving (volume + ATR)?
→ If yes: go Long with 3 lots
Manage with:
ATR SL & TP
Exit early if 1H trend flips or price falls back below EMA20
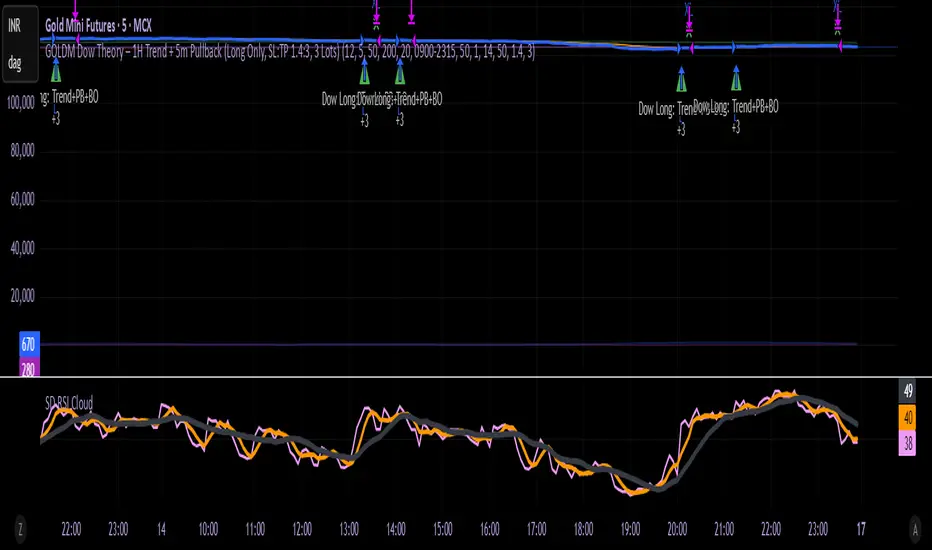
MOMO – Imbalance Trend (SIMPLE BUY/SELL)MOMO – Imbalance Trend (SIMPLE BUY/SELL)
This strategy combines trend breaks, imbalance detection, and first-tap supply/demand entries to create a clean and disciplined trading model.
It automatically highlights imbalance candles, draws fresh zones, and waits for the first retest to deliver precise BUY and SELL signals.
Performance
On optimized settings, this strategy shows an estimated 57%–70% win-rate, depending on the asset and timeframe.
Actual performance may vary, but the model is built for consistency, discipline, and improved decision-making.
How it works
Detects trend structure shifts (BOS / Break of Trend)
Identifies displacement (imbalance) candles
Creates supply and demand zones from imbalance origin
Waits for first tap only (no second chances)
Confirms direction using trend logic
Generates clean BUY/SELL arrows
Automatic SL/TP based on user settings
Features
Clean BUY/SELL markers
Auto-drawn supply & demand zones
Trend break markers
Imbalance tags
Smart first-tap confirmation
Customizable stop loss & take profit
Works on crypto, gold, forex, indices
Best on M5–H1 for day trading
Note
This strategy is designed for day traders who want clarity, structure, and zero emotional trading.
Use it with discipline — and it will serve you well.
Good luck, soldier.

Strategy Builder v1.0.0 [BigBeluga]🔵 OVERVIEW
The Strategy Builder combines advanced price-action logic, smart-money concepts, and volatility-adaptive momentum signals to automate high-quality entries and exits across any market. It blends trend recognition, market structure shifts, order block reactions, imbalance (FVG) signals, liquidity sweeps, candlestick confirmations, and oscillator-powered divergences into one cohesive engine.
Whether used as a full automation workflow or as a structured confirmation framework, this strategy provides a disciplined, rules-driven method to trade with logic — not emotion.
🔵 BACKTEST WINDOW CONTROL
This module allows you to restrict strategy execution to a specific historical period.
Ideal for performance isolation, regime testing, and forward-walk validation.
Limit Backtest Window
Enabling this option activates custom date filters for the backtest engine.
Start — Define the starting date & time for backtesting
End — Define the ending date & time for backtesting
Only trades and signals inside this window are executed
Reduces computation load on large datasets
Useful for testing specific market environments (e.g., bull cycles, crash periods, sideways regimes)
🔵 SIGNAL GLOSSARY (Advanced Technical Explanation)
Traders can build long and short setups using up to 6 configurable entry conditions for each direction.
Every condition can be set as Bullish or Bearish and mapped to any signal source — allowing deep customization
Below is the full internal logic overview of every signal available in the Strategy Builder.
Signals are based on trend models, volatility structures, liquidity logic, oscillator behavior, and market structure mapping.
Trend Signals (Low-Lag Trend Engine)
Uses a proprietary low-lag baseline + momentum gradient model to detect directional bias.
Trend Signal — Momentum breaks above/below adaptive trend baseline.
Trend Signal+ — Stronger trend confirmation using volatility-weighted momentum.
Trend Signal Any — Triggers when any bullish/bearish trend signal appears.
SmartBand & Retests (Adaptive Volatility Bands)
Dynamic envelope that contracts/expands with volatility & trend strength.
SmartBand Retest — Price retests dynamic band and rejects, confirming continuation.
ActionWave Signals (Impulse-Pullback Engine)
Tracks wave behavior, acceleration and deceleration in price.
ActionWave — Detects directional impulse strength vs pullback weakness.
ActionWave Cross — Momentum acceleration threshold crossed → trend ignition.
Magnet Signals (Liquidity Gravity + Mean Reversion Bias)
Detects zones where price is being drawn due to liquidity voids or imbalance.
Magnet — Trend and liquidity pressure align, creating directional “pull.”
MagnetBar Low Momentum — Low-volatility compression → pre-breakout condition.
Flow Trend (Directional Flow State + ATR Envelope)
Higher-timeframe bias confirmation + dynamic volatility filter.
FlowTrend — Confirms major directional bias (uptrend or downtrend).
FlowTrend Retest — Price tests HTF flow band and rejects → trend resume.
Voltix (Volatility Expansion Pulse)
Detects regime shift from quiet accumulation → trending expansion.
Voltix — Breakout volatility signature, trend acceleration trigger.
Candlestick Pattern (Algorithmic Price Action Recognition)
Auto-recognizes meaningful reversal or continuation candle formations.
Candlestick Pattern — Confirms momentum reversal/continuation via candle logic.
OrderBlock Logic (Institutional Footprint System)
Institutional demand/supply zone tracking with mitigation logic.
Order Block Touch — Price taps institutional zone → reaction filter.
Order Block Break — OB invalidation → institutional flow shift.
Market Structure Engine (Swing Logic + Volume Confirmation)
Tracks major swing breaks and structural reversals.
BoS — Break of Structure in trend direction (continuation bias).
ChoCh — Change of Character — early reversal marker.
Fair Value Gaps (Imbalance & Volume Displacement)
Identifies inefficiencies caused by rapid displacement moves.
FVG Created — Price leaves inefficiency behind.
FVG Retest — Price returns to rebalance inefficiency → reaction zone.
Liquidity Events (Stop-Run & Reversal Logic)
Detects stop-hunt events and liquidity sweeps.
SFP — Swing failure & wick sweep → reversal confirmation.
Liquidity Created — New equal highs/lows form liquidity pool.
Liquidity Grab — Sweep through liquidity line followed by rejection.
Support / Resistance Break Logic
Adaptive zone recognition + momentum confirmation.
Support/Resistance Cross — Zone decisively broken → structural shift.
Pattern Breakouts (Market Geometry Engine)
Tracks breakout from compression & expansion formations.
Channel Break — Channel breakout → trend acceleration.
Wedge Break — Break from contraction wedge → burst of momentum.
Session Logic (Opening Range Behavior)
Session-based volatility trigger.
Session Break — Break above/below session opening range.
Momentum / Reversal Oscillator Suite
Oscillator-driven exhaustion & reversal signals.
Nautilus Signals — Momentum reversal signature (oscillator shift).
Nautilus Peak — Momentum peak → exhaustion risk.
OverSold/Overbought ❖ — Extreme exhaustion zones → reversal setup.
DipX Signals ✦ — Dip buy / Dip sell timing, micro-reversal engine.
Advanced Divergence Engine
Momentum/price disagreement layer with multi-trigger confirmation.
Normal Divergence — Classic divergence reversal.
Hidden Divergence — Trend continuation divergence.
Multiple Divergence — Multiple divergence confirmations stacked → high confidence.
🔧 Adjustable Signal Logic
Some signals in this system can be additionally refined through the strategy settings panel.
This allows traders to tune internal behavior for different market regimes, assets, and volatility conditions.
🔵 LONG / SHORT EXIT CONDITIONS
This section allows you to automate exits using the same advanced market conditions available for entries.
Each exit rule consists of:
Toggle — Enable/disable individual exit rule.
Direction Filter — Trigger exit only if selected market bias appears (Bullish/Bearish).
Signal Type — Choose which market event triggers the exit (same list as entry conditions).
When the active conditions are met, the strategy automatically closes the current position — ensuring emotion-free risk management and systematic trade control.
🔵 TAKE PROFIT & STOP LOSS SYSTEM
This strategy builder provides a fully dynamic risk-management engine designed for both systematic traders and discretionary confirmation users.
Take Profit Logic
Scale out of trades progressively or exit fully using algorithmic TP levels.
Up to 3 Take-Profit targets available
Choose TP calculation method:
• ATR-based distance (volatility-adaptive targets)
• %-based distance (fixed percentage from entry)
Define Size — ATR multiplier or % value
Custom Exit Size per TP (e.g., 25% / 25% / 50%)
Visual TP plotting on chart for clarity
Stop Loss Logic
Automated protection logic for every trade.
Two SL Modes:
• Fixed Stop Loss — static SL from entry
• Trailing Stop Loss — SL follows price as trade progresses
Distance options:
• ATR multiplier (adapts to volatility)
• %-based from entry (fixed distance)
SL dynamically draws on chart for transparency
Trailing SL behavior:
Follows price only in profitable direction
Never moves against the trade
Locks profits as trend develops
🔵 Strategy Dashboard
A compact on-chart performance dashboard is included to help monitor live trade status and backtest results in real time.
It displays key metrics:
Start Capital — Initial account balance used in simulation.
Position Size — % of capital allocated per trade based on user settings (It changes if the trade hits take profits, when more than one take profit is selected).
Current Trade — Shows active trade direction (Long / Short) and real-time % return from entry.
Closed Trades — Counter of completed positions, useful for reading sample size during testing.
🔵 CONCLUSION
The Strategy Builder brings together a powerful suite of smart-money and momentum-driven signals, allowing traders to automate robust trade logic built on modern market structure concepts. With access to trend filters, order blocks, liquidity events, divergence signals, volatility cues, and session-based triggers, it provides a deeply adaptive trade engine capable of fitting many market environments.
