EMA Trading StrategyThis script is based on exponential moving average strategy, or EMA strategy, is used to identify trends on the chart.
When EMA 20 and 55 are above EMA 200 and EMA 20 is green, this shows an uptrend, good for a long.
When EMA 20 turns red then it's time to sell.
Pesquisar nos scripts por "20年美元汇率"

Ultimate Moving Average Package (17 MA's)Included is the:
VWAP
Current time frame 10 EMA
Current time frame 20 EMA
Current time frame 50 EMA
Current time frame 10 SMA
Current time frame 20 SMA
Current time frame 50 SMA
Daily 10 EMA
Daily 20 EMA
Daily 50 EMA
Daily 50 SMA
Daily 100 SMA
Daily 200 SMA
Weekly 100 SMA
Weekly 200 SMA
Monthly 100 SMA
Monthly 200 SMA
All Daily/Weekly/Monthly MA's can be seen on intraday charts. Current time frame MA's change depending on your time frame. Obviously you dont need all 17 on your chart but you can pick the ones you like and disable the rest.

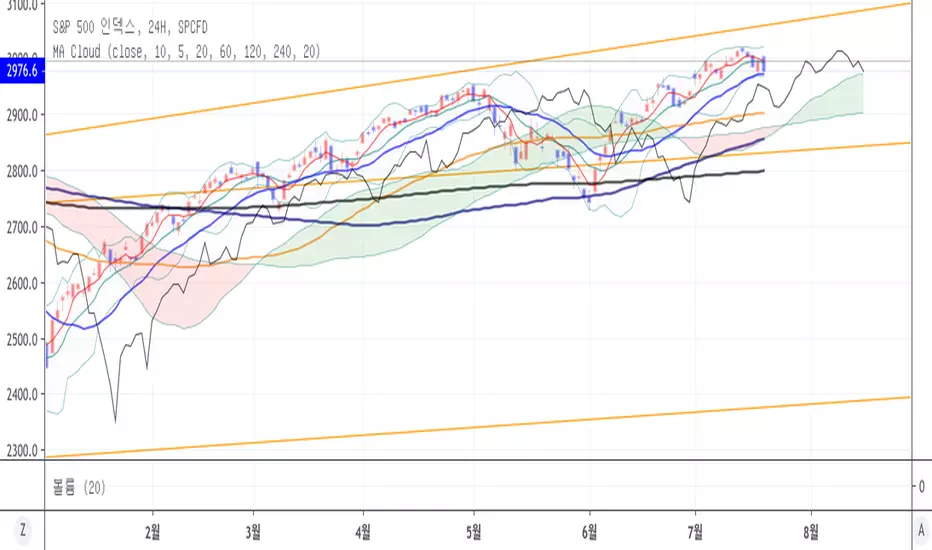
[TH] MA CloudThis script uses concept of ichmok cloud to SMA . ( But the details are different )
It is useful for 1-3 month swing trading (if open market is 5days in a week).
* Cloud
Simple Moving Average ( SMA ) 20 days & 60 days were used to make cloud region( green, red cloud )
- 20 days, 60days SMA were translated to 20days future from now ( =SMA Leading span 1,2 )
- if 20days sma > 60days sma => green
- if 20days sma < 60days sma => red
- if close price < cloud => The bigger red cloud means stronger resistance
- if close price > cloud = > The bigger green cloud means stronger support
* Leading Span (Most important)
Instead of using lagging span, I used leading span.
We can predict 20 days sma's direction with this leading span & current price(close price)
- if close price makes Dead Cross over leading span & close price < 20days sma
=> 20days sma heading down soon
- if close price makes Golden Cross over leading span & close > 20days sma
=> 20days sma heading up soon
* buy
Buy IF 20days sma heading up soon & close price >= green cloud ( even better if 20days sma >= 60days sma )
OR IF 20days sma heading up soon & close price < red cloud & cloud is small ( low success rate )
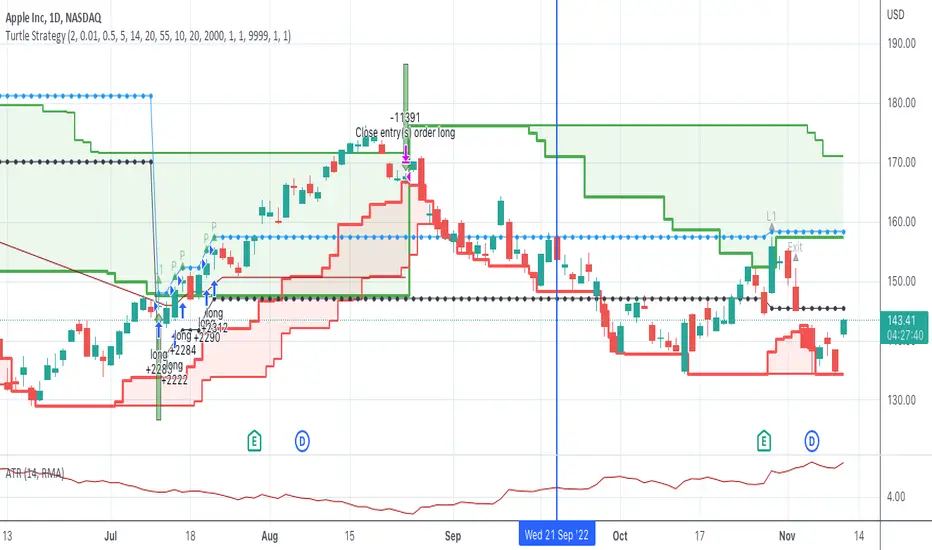
Turtle SystemFirst pinescript strategy I've ever written so still learning what is possible.
This strategy is based on the famous turtle system and tried to stay true
to the rules within the confines of what pinescript will allow me to do.
Features:
Green lines represents the 20/55 day highs (configurable)
Red lines represent the 10/20 day lows (configurable)
Purple line represents stop (defaults to 2N away configurable)
Pyramids up to 5 long positions (each 1N away configurable).
Arrows:
Up Arrow Green - 20 day long position entered
Up Arrow Purple - 55 day long position entered
Down Arrow Green - Winning trade exited out.
Down Arrow Red - Losing Trade either stopped out or exited out.
Code tracks successful wins as it is only allowed to enter positions if the last trade was not a wining trade.
One limitation, only supports Long trades although wouldn't be a lot of work to also make it support Short. NASDAQ:AAPL
Love to hear feedback on improvements, particularly to make it more robust.
Sexy RSI for sexy tradersHello fellow sexy traders.
I was tired of constantly having to add my own horizontals/MAs to the default RSI so I decided to make this modification.
The default settings include channels from 40-80 (green horizontals) for a bullish range, and 20-60 (red horizontals) for the bearish range.
Also includes white line at 50 level, and blue horizontals at extremes (90 and 10).
If RSI stays in one of the red or green range that can signify the trend direction, as directed by Andrew Cardwell (inventor of the RSI).
If you wish for other levels to be included, just let me know! Comment on here or dm me on twitter @boss_charts and I can add the settings for you, so all you have to do is click a button and it will set it to your desired config. I want this to be a tool that is useful for heavy traders to save them time.
Additionally, in order to tell the level of the RSI and how overextended it might be, I added the setting for the RSI to change color depending on its level. Current settings are as follows:
Normal RSI (30-70) = PURPLE
Conventional Overbought/Oversold (30-20 + 70-80) = RED
1st extended (20-15 + 80-85) = PINK
2nd extended (15-10 + 85-90) = ORANGE
VERY EXTENDED (<10 + >90) = YELLOW
That way you can get an idea of how drastic a move is by the color alone. According to Dr. Cardwell, a drastic move to over/under extended can be a sign of strength.
Finally, there are the default MAs added that Mr. Cardwell defines as useful for defining the trend. These being the 9 MA and 45 EMA/WMA.
The strategy with these is to have the MAs on both price and RSI. If the 9MA is above the 45 MA on both price and RSI, then this is bullish and you can look for longs.
Conversely, if the 9 is below the 45 on both RSI and price that is bearish, and you can look for shorts.
I added the background color change for the points where the MAs cross each other, so you do not have to have the MAs fogging up your charts to know where they are relative to one another. This is similar to my MA cross indicator which contains the same functionality.
Never financial advice. Backtest it for yourself and find MA configurations that work for you.
Enjoy! Feel free to send feedback/requests whenever.

Multi SMA EMA WMA HMA BB (5x8 MAs Bollinger Bands) MAX MTF - RRBMulti SMA EMA WMA HMA 4x7 Moving Averages with Bollinger Bands MAX MTF by RagingRocketBull 2019
Version 1.0
All available MAX MTF versions are listed below (They are very similar and I don't want to publish them as separate indicators):
ver 1.0: 4x7 = 28 MTF MAs + 28 Levels + 3 BB = 59 < 64
ver 2.0: 5x6 = 30 MTF MAs + 30 Levels + 3 BB = 63 < 64
ver 3.0: 3x10 = 30 MTF MAs + 30 Levels + 3 BB = 63 < 64
ver 4.0: 5(4+1)x8 = 8 CurTF MAs + 32 MTF MAs + 20 Levels + 3 BB = 63 < 64
ver 5.0: 6(5+1)x6 = 6 CurTF MAs + 30 MTF MAs + 24 Levels + 3 BB = 63 < 64
ver 6.0: 4(3+1)x10 = 10 CurTF MAs + 30 MTF MAs + 20 Levels + 3 BB = 63 < 64
Fib numbers: 8, 13, 21, 34, 55, 89, 144, 233, 377
This indicator shows multiple MAs of any type SMA EMA WMA HMA etc with BB and MTF support, can show MAs as dynamically moving levels.
There are 4 MA groups + 1 BB group, a total of 4 TFs * 7 MAs = 28 MAs. You can assign any type/timeframe combo to a group, for example:
- EMAs 9,12,26,50,100,200,400 x H1, H4, D1, W1 (4 TFs x 7 MAs x 1 type)
- EMAs 8,13,21,30,34,50,55,89,100,144,200,233,377,400 x M15, H1 (2 TFs x 14 MAs x 1 type)
- D1 EMAs and SMAs 8,13,21,30,34,50,55,89,100,144,200,233,377,400 (1 TF x 14 MAs x 2 types)
- H1 WMAs 13,21,34,55,89,144,233; H4 HMAs 9,12,26,50,100,200,400; D1 EMAs 12,26,89,144,169,233,377; W1 SMAs 9,12,26,50,100,200,400 (4 TFs x 7 MAs x 4 types)
- +1 extra MA type/timeframe for BB
There are several versions: Simple, MTF, Pro MTF, Advanced MTF, MAX MTF and Ultimate MTF. This is the MAX MTF version. The Differences are listed below. All versions have BB
- Simple: you have 2 groups of MAs that can be assigned any type (5+5)
- MTF: +2 custom Timeframes for each group (2x5 MTF) +1 TF for BB, TF XY smoothing
- Pro MTF: 4 custom Timeframes for each group (4x3 MTF), 1 TF for BB, MA levels and show max bars back options
- Advanced MTF: +4 extra MAs/group (4x7 MTF), custom Ticker/Symbols, Timeframe <>= filter, Remove Duplicates Option
- MAX MTF: +2 subtypes/group, packed to the limit with max possible MAs/TFs: 4x7, 5x6, 3x10, 4(3+1)x10, 5(4+1)x8, 6(5+1)x6
- Ultimate MTF: +individual settings for each MA, custom Ticker/Symbols
MAX MTF version tests the limits of Pinescript trying to squeeze as many MAs/TFs as possible into a single indicator.
It's basically a maxed out Advanced version with subtypes allowing for mixed types within a group (i.e. both emas and smas in a single group/TF)
Pinescript has the following limits:
- max 40 security calls (6 calls are reserved for dupe checks and smoothing, 2 are used for BB, so only 32 calls are available)
- max 64 plot outputs (BB uses 3 outputs, so only 61 plot outputs are available)
- max 50000 (50kb) size of the compiled code
Based on those limits, you can only have the following MAs/TFs combos in a single script:
1. 4x7, 5x6, 3x10 - total number of MTF MAs must always be <= 32, and you can still have BB and Num Levels = total MAs, without any compromises
2. 5(4+1)x8, 6(5+1)x6, 4(3+1)x10 - you can use the Current Symbol/Timeframe as an extra (+1) fixed TF with the same number of MTF MAs
- you don't need to call security to display MAs on the Current Symbol/Timeframe, so the total number of MTF MAs remains the same and is still <= 32
- to fit that many MAs into the max 64 plot outputs limit you need to reduce the number of levels (not every MA Group will have corresponding levels)
Features:
- 4x7 = 28 MAs of any type
- 4x MTF groups with XY step line smoothing
- +1 extra TF/type for BB MAs
- 2 MA subtypes within each group/TF
- 4x7 = 28 MA levels with adjustable group offsets, indents and shift
- supports any existing type of MA: SMA, EMA, WMA, Hull Moving Average (HMA)
- custom tickers/symbols for each group
- show max bars back option
- show/hide both groups of MAs/levels/BB and individual MAs
- timeframe filter: show only MAs/Levels with TFs <>= Current TF
- hide MAs/Levels with duplicate TFs
- support for custom TFs that are not available in free accounts: 2D, 3D etc
- support for timeframes in H: H, 2H, 4H etc
Notes:
- Uses timeframe textbox instead of input resolution dropdown to allow for 240 120 and other custom TFs
- Uses symbol textbox instead of input symbol to avoid establishing multiple dummy security connections to the current ticker - otherwise empty symbols will prevent script from running
- Possible reasons for missing MAs on a chart:
- there may not be enough bars in history to start plotting it. For example, W1 EMA200 needs at least 200 bars on a weekly chart.
- for charts with low/fractional prices i.e. 0.00002 << 0.001 (default Y smoothing step) decrease Y smoothing as needed (set Y = 0.0000001) or disable it completely (set X,Y to 0,0)
- for charts with high price values i.e. 20000 >> 0.001 increase Y smoothing as needed (set Y = 10-20). Higher values exceeding MAs point density will cause it to disappear as there will be no points to plot. Different TFs may require diff adjustments
- TradingView Replay Mode UI and Pinescript security calls are limited to TFs >= D (D,2D,W,MN...) for free accounts
- attempting to plot any TF < D1 in Replay Mode will only result in straight lines, but all TFs will work properly in history and real-time modes. This is not a bug.
- Max Bars Back (num_bars) is limited to 5000 for free accounts (10000 for paid), will show error when exceeded. To plot on all available history set to 0 (default)
- Slow load/redraw times. This indicator becomes slower, its UI less responsive when:
- Pinescript Node.js graphics library is too slow and inefficient at plotting bars/objects in a browser window. Code optimization doesn't help much - the graphics engine is the main reason for general slowness.
- the chart has a long history (10000+ bars) in a browser's cache (you have scrolled back a couple of screens in a max zoom mode).
- Reload the page/Load a fresh chart and then apply the indicator or
- Switch to another Timeframe (old TF history will still remain in cache and that TF will be slow)
- in max possible zoom mode around 4500 bars can fit on 1 screen - this also slows down responsiveness. Reset Zoom level
- initial load and redraw times after a param change in UI also depend on TF. For example: D1/W1 - 2 sec, H1/H4 - 5-6 sec, M30 - 10 sec, M15/M5 - 4 sec, M1 - 5 sec. M30 usually has the longest history (up to 16000 bars) and W1 - the shortest (1000 bars).
- when indicator uses more MAs (plots) and timeframes it will redraw slower. Seems that up to 5 Timeframes is acceptable, but 6+ Timeframes can become very slow.
- show_last=last_bars plot limit doesn't affect load/redraw times, so it was removed from MA plot
- Max Bars Back (num_bars) default/custom set UI value doesn't seem to affect load/redraw times
- In max zoom mode all dynamic levels disappear (they behave like text)
- Dupe check includes symbol: symbol, tf, both subtypes - all must match for a duplicate group
- For the dupe check to work correctly a custom symbol must always include an exchange prefix. BB is not checked for dupes
Good Luck! Feel free to learn from/reuse the code to build your own indicators.

Multi SMA EMA WMA HMA BB (4x5 MAs Bollinger Bands) Adv MTF - RRBMulti SMA EMA WMA HMA 4x5 Moving Averages with Bollinger Bands Advanced MTF by RagingRocketBull 2019
Version 1.0
This indicator shows multiple MAs of any type SMA EMA WMA HMA etc with BB and MTF support, can show MAs as dynamically moving levels.
There are 4 MA groups + 1 BB group, a total of 4 TFs * 5 MAs = 20 MAs. You can assign any type/timeframe combo to a group, for example:
- EMAs 12,26,50,100,200 x H1, H4, D1, W1 (4 TFs x 5 MAs x 1 type)
- EMAs 8,10,13,21,30,50,55,100,200,400 x M15, H1 (2 TFs x 10 MAs x 1 type)
- D1 EMAs and SMAs 8,10,12,26,30,50,55,100,200,400 (1 TF x 10 MAs x 2 types)
- H1 WMAs 7,77,89,167,231; H4 HMAs 12,26,50,100,200; D1 EMAs 89,144,169,233,377; W1 SMAs 12,26,50,100,200 (4 TFs x 5 MAs x 4 types)
- +1 extra MA type/timeframe for BB
There are several versions: Simple, MTF, Pro MTF, Advanced MTF and Ultimate MTF. This is the Advanced MTF version. The Differences are listed below. All versions have BB
- Simple: you have 2 groups of MAs that can be assigned any type (5+5)
- MTF: +2 custom Timeframes for each group (2x5 MTF) +1 TF for BB, TF XY smoothing
- Pro MTF: 4 custom Timeframes for each group (4x3 MTF), 1 TF for BB, MA levels and show max bars back options
- Advanced MTF: +2 extra MAs/group (4x5 MTF), custom Ticker/Symbols, Timeframe <>= filter, Remove Duplicates Option
- Ultimate MTF: +individual settings for each MA, custom Ticker/Symbols
Features:
- 4x5 = 20 MAs of any type
- 4x MTF groups with XY step line smoothing
- +1 extra TF/type for BB MAs
- 4x5 = 20 MA levels with adjustable group offsets, indents and shift
- supports any existing type of MA: SMA, EMA, WMA, Hull Moving Average (HMA)
- custom tickers/symbols for each group - you can compare MAs of the same symbol across exchanges
- show max bars back option
- show/hide both groups of MAs/levels/BB and individual MAs
- timeframe filter: show only MAs/Levels with TFs <>= Current TF
- hide MAs/Levels with duplicate TFs
- support for custom TFs that are not available in free accounts: 2D, 3D etc
- support for timeframes in H: H, 2H, 4H etc
Notes:
- Uses timeframe textbox instead of input resolution dropdown to allow for 240 120 and other custom TFs
- Uses symbol textbox instead of input symbol to avoid establishing multiple dummy security connections to the current ticker - otherwise empty symbols will prevent script from running
- Possible reasons for missing MAs on a chart:
- there may not be enough bars in history to start plotting it. For example, W1 EMA200 needs at least 200 bars on a weekly chart.
- price << default Y smoothing step 5. For charts with low/fractional prices (i.e. 0.00002 << 5) adjust X Y smoothing as needed (set Y = 0.0000001) or disable it completely (set X,Y to 0,0)
- TradingView Replay Mode UI and Pinescript security calls are limited to TFs >= D (D,2D,W,MN...) for free accounts
- attempting to plot any TF < D1 in Replay Mode will only result in straight lines, but all TFs will work properly in history and real-time modes. This is not a bug.
- Max Bars Back (num_bars) is limited to 5000 for free accounts (10000 for paid), will show error when exceeded. To plot on all available history set to 0 (default)
- Slow load/redraw times. This indicator becomes slower, its UI less responsive when:
- Pinescript Node.js graphics library is too slow and inefficient at plotting bars/objects in a browser window. Code optimization doesn't help much - the graphics engine is the main reason for general slowness.
- the chart has a long history (10000+ bars) in a browser's cache (you have scrolled back a couple of screens in a max zoom mode).
- Reload the page/Load a fresh chart and then apply the indicator or
- Switch to another Timeframe (old TF history will still remain in cache and that TF will be slow)
- in max possible zoom mode around 4500 bars can fit on 1 screen - this also slows down responsiveness. Reset Zoom level
- initial load and redraw times after a param change in UI also depend on TF. For example:
D1/W1 - 2 sec, H1/H4 - 5-6 sec, M30 - 10 sec, M15/M5 - 4 sec, M1 - 5 sec.
M30 usually has the longest history (up to 16000 bars) and W1 - the shortest (1000 bars).
- when indicator uses more MAs (plots) and timeframes it will redraw slower. Seems that up to 5 Timeframes is acceptable, but 6+ Timeframes can become very slow.
- show_last=last_bars plot limit doesn't affect load/redraw times, so it was removed from MA plot
- Max Bars Back (num_bars) default/custom set UI value doesn't seem to affect load/redraw times
- In max zoom mode all dynamic levels disappear (they behave like text)
1. based on 3EmaBB, uses plot*, barssince and security functions
2. you can't set certain constants from input due to Pinescript limitations - change the code as needed, recompile and use as a private version
3. Levels = trackprice implementation
4. Show Max Bars Back = show_last implementation
5. swma has a fixed length = 4, alma and linreg have additional offset and smoothing params
6. Smoothing is applied by default for visual aesthetics on MTF. To use exact ma mtf values (lines with stair stepping) - disable it
Good Luck! You can explore, modify/reuse the code to build your own indicators.

ADX +- DiThis Adx +-Di is just a complete version of what the ADX is supposed to signal.
So you have:
15 (contraction), 20 (threshold), 30 (expansion), 40 (resistance) levels.
Below 20 the price is not trending
Above 30 the price is trending
Below 15 price has been in contraction for too long
Between 20 and 30 price is in a "transition zone".
I finally added a "Resistance" level (40), which has to be adapted to best represent the historical levels where price usually encounters resistance, and where the price can be declared "overtrending", which means a return to lower levels is likely to happen.
I've chosen mild colors, and set the Adx Color to White, because I use black background, you can easily change that.
Enjoy
-Maurice

Average Directional Index with DI SpreadThis indicator converts conventional triple lined ADX, DI+ and DI- into two lines. First line is the
original ADX line and second line is obtained by subtracting DI- from DI+ which named DI Spread(DIS)
If ADX is greater than 20 there is a trend and if greater than 40 there is a strong trend but ADX does not tell
the trend direction
To determine trend direction, DIS can be used with ADX; Sımply; If DIS is greater than 0, it is an uptrend and If DIS
is less than 0, it is a downtrend.
To sum up;
If ADX is greater than 20 and especially greater than 40 with positive DIS value, this implies an uptrend.
If ADX is greater than 20 and especially greater than 40 with negative DIS value, this implies a downtrend.
*Because of coloration and reference levels used, this indicator is really simple and efficient to analyze trend direction.

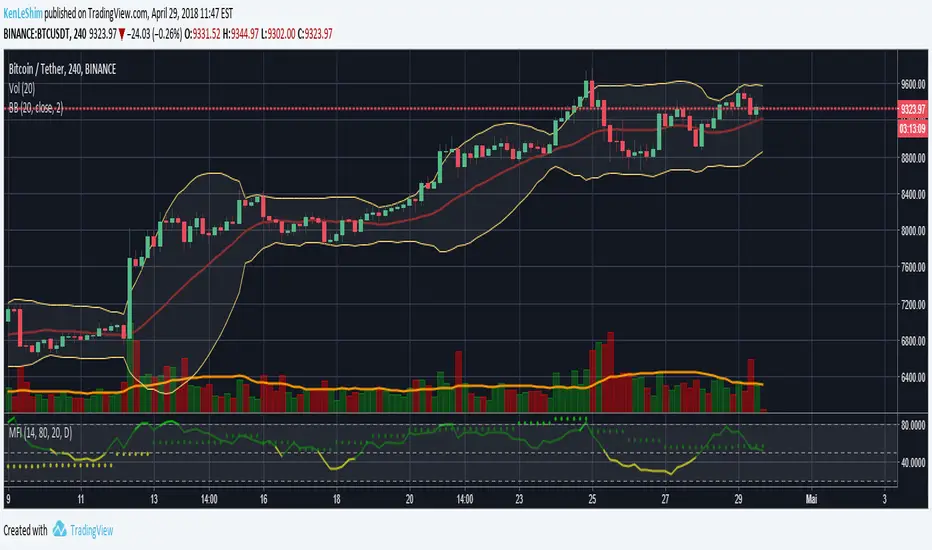
MFI Multi-TimeframeThe Money Flow Index (MFI) is an oscillating momentum and market strength indicator that was developed by Gene Quong and Avrum Soudack. It is also a leading indicator, which means it tends to lead price action, and is similar in calculation as J. Welles Wilder's Relative Strength Index (RSI) with the significant difference being that the MFI uses both price and volume. Like the RSI, the MFI is a range-bound oscillator that oscillates between zero and 100 and is interpreted in a similar way as the RSI. The ultimate aim of the MFI is to determine whether money is flowing in or out of a security over a specified look-back period.
HOW IS IT USED ?
The MFI oscillates between 0 and 100 and a security is considered overbought when its MFI rises above 80 and oversold when its MFI falls below 20. These levels are the suggested overbought and oversold levels as suggested by Quong and Soudack, though they do not suggest these levels as entry signals. Instead, these caution levels warn that the price action and the current trend have reached extremes that may be unsustainable. Quong and Soudack also recommend using the 90 and 10 lines as truly overbought and truly oversold levels respectively. MFI movements above 90 and below 10 are rare and indicate a higher level of unsustainability.
Finally, failure swings from the 20 or 80 levels can also be used to identify potential price reversals and trade entries. A failure swing occurs when the MFI moves over the overbought or oversold level but reverses back before reaching the opposite level. Thus, when the MFI crosses up over the 20 (oversold) level but reverses before it reaches the 80 (overbought) level, it indicates that the uptrend is weak and that it may reverse soon. This signals that you should cover any long positions or go short. Similarly, when the MFI crosses down over the 80 (overbought) level but reverses before it reaches the 20 (oversold) level, it indicates a weakness in the down trend and the probability that the trend will reverse. This would be a signal to close of any short positions; or a signal to long buy.
I added the possibility to add on the chart a 2nd timeframe for confirmation.
If you found this script useful, a tip is always welcome... :)
Exponential Moving Average (Set of 3) [Krypt] + 13/34 EMAsI took Krypt's script and essentially added on to it.
the 20/50/100/200 EMAs should be used together as support and resistance as normal.
Wait for price to break 200 EMA
Wait for 50 EMA to cross 200 EMA
Wait for pullback to 50 EMA to open position
20 and 100 EMAs are for extra information about moving support and resistance
and 13/34 EMAs should be used in conjunction
When 13 EMA crosses 34 EMA, open position
When price gets far from 13/34, close position (because price will attempt to revert back to mean)
This is better for scalping and swing trades than the 20/50/100/200 setup.
Twitter: @AzorAhai06

Gap Gain Test V1.0 by @overratedtraderOddball indicators for entertainment purposes only. This is best used on daily chart.
Look at the 20 ALMA to gauge likelihood of stock following its up or down gap.
- if above the 20 ALMA , follow the gap direction
- if below the 20 ALMA , take counter trend trade
If stock gaps up AND closes higher than it opens, that gain % (close/open) is colored green and if stock gaps down and closes lower than it opens, that gain % (close/open) is colored green
Conversely if the stock gaps up BUT closes lower than it opens, red and if a stop gaps down but closes higher than it opens, red.
Enjoy and follow me on twitter @overratedtrader for more nonsensical and out-of-the-box ideas.

Adaptive Donchian ChannelThis indicator adds a level of adaptivity to the simple Donchian Channel by adjusting the sensitivity (lookback periods) of the channel's upper and lower bounds based on the amount of time that has elapsed since the price has hit/expanded the channel boundaries. Comparing the results of this indicator to the standard Donchian Channel, the readier level of responsiveness may prove self-evident.
METHODOLOGY:
Specifically, the more recently the channel was expanded in one direction, the longer the lookback period grows in that direction. Conversely, if the channel has not been expanded in a given direction, the lookback period will contract so as to allow for a tighter channel.
For example, let the initial lookback period be 20 bars and let the factor argument be 0.1 (or 2 bars to start, as 20*0.1 = 2). Now say the current bar sets a new 20-period high. Then the lookback period for the upper bound is expanded by 2 bars to 22, and the lookback period for the lower bound is contracted by 2 bars to 18, thereby making it simultaneously harder to set new highs and easier to set new lows (and vice versa for hitting new lows). If neither a new high nor a new low is formed, both periods contract by the given factor.

TonyUX EMA Scalper - Buy / SellThis is a simple scalping strategy that works for all time frames... I have only tested it on FOREX
It works by checking if the price is currently in an uptrend and if it crosses the 20 EMA.
If it crosses the 20 EMA and its in and uptrend it will post a BUY SIGNAL.
If it crosses the 20 EMA and its in and down it will post a SELL SIGNAL.
The red line is the highest close of the previous 8 bars --- This is resistance
The green line is the lowest close of the previous 8 bars -- This is support

EMA_ConvergenceFirst I have to give kudos to my son who I asked to take a shot at creating this little indicator. Nice work son!
While trading, one of the things I look for is when price or certain EMA's approach another EMA. The example that I use on this 1 minute SPY chart is an 8 EMA and 20 EMA. I am looking for when the 8 and 20 are within' 3 cents of each other. Many times when they are getting close, price is approaching a top or bottom. I am looking for a candlestick reversal around that area. You may want to know when PRICE is near the 50 EMA: Use EMA 1 and 50 for that. Having it light up on top of the page, or elsewhere, makes it easier to look for the convergence when it occurs. If it lights up for a long period, price may be going sideways. I don't enter into a trade until the EMA starts separating, usually with another candlestick formation.
You are able to change the distance for convergence and two EMA's. Unfortunately you will have to adjust the convergence number up as you increase in time frames. This is designed to see when they are close, not when they cross.
The bars on top of this example are lit up purple due to the 8 and 20 EMA are within' 3 cents of each other.
If you want to overlay the price bars, instead of having it separate, just change overlay to "true"
Enjoy.

DTM 444 BANDS 🚀DTM 444 BANDS 🚀:
The DTM 444 BANDS 🚀 is a powerful, multi-purpose trading indicator combining Supertrend, Dynamic Band Levels, Breakout Signals, and Volume Confirmation to help traders identify high-probability trade setups across different timeframes.
🔧 Key Features
✅ Multi-Timeframe Support
Analyze price action across any timeframe using the Timeframe input.
All band calculations (High, Low, Midline, and Supertrend) are pulled from a higher timeframe for clearer context.
✅ Dynamic Bands Based on Supertrend
High Band: Rolling highest of Supertrend over hiLen period.
Low Band: Rolling lowest of Supertrend over loLen period.
Midline: Midpoint of the above.
Acts like dynamic support/resistance, ideal for trend-following and breakout strategies.
✅ Dual Signal System
Breakout Signals (Buy and Sell): Triggered when price breaks the bands with volume confirmation.
Supertrend Crossover Signals (Buy1 and Sell1): Classic momentum entries with a confirmation twist.
Exit Signals: Optional take-profit/neutral indicators when price reverses.
✅ Volume Confirmation Filter (Optional)
Only triggers signals if the volume exceeds its 20-period SMA.
Helps filter out false breakouts and weak trends in low-liquidity periods.
✅ Visual Enhancements
Color-coded candles based on band positioning (e.g., red = weak, green = strong, etc.)
On-chart labels for each signal for quick reference.
Real-time Signal Dashboard using Pine Script tables showing:
Current signal
Volume filter status
Live volume vs volume SMA
🧪 Practical Use Cases
Trend Traders: Use the Supertrend cross and band breakouts to ride trends early.
Breakout Traders: Catch high-probability moves outside established ranges.
Swing Traders: Time entries and exits using color-coded bars and exit labels.
Volume-Sensitive Traders: Focus on trades with strong volume backing.
📊 Backtest Snapshot
Based on the example chart for Reliance Industries (RELIANCE.NS) on the weekly timeframe:
Several profitable buy and breakout signals during uptrends.
Timely exits and breakdown alerts before reversals.
Volume filter keeps trades clean and avoids noise.
⚙️ Customizable Parameters
High Length and Low Length (default: 19)
Supertrend Multiplier and ATR Length
Volume Filter: Toggle ON/OFF
Volume SMA Length: Default 20
Custom Timeframe: Choose any higher timeframe for multi-timeframe analysis
📢 Alerts Ready
Fully integrated with TradingView alerts:
Breakout & Breakdown
Supertrend crossovers
All alerts respect the volume filter setting
🏁 Final Thoughts
DTM 444 BANDS 🚀 is a versatile and adaptive trading system that blends trend analysis, volatility bands, and volume validation. Whether you're a trend trader, breakout hunter, or swing trader — this tool gives you a structured edge with clear visual cues and real-time alerts.

3SMA (1H only) by tophengzkyThis script plots three Simple Moving Averages (SMA 10, 20, 50), but they are only visible when the chart timeframe is set to 1 hour (1H).
It helps traders focus on higher timeframe trend direction without cluttering charts on other timeframes.
SMA1 = 10 (white)
SMA2 = 20 (yellow)
SMA3 = 200 (red)
Works only on 1H timeframe
Useful for swing traders and intraday traders who rely on hourly trend confirmation.
why 1 hr only? the only purpose of this is just to know the bias of the market weather it will reverse or it will continue the trend. As long as the price action did not cross this 3 SMA's the trend will continue.
as a trend trader it is very useful this strategy.. make it simple!

💎DrFX Diamond Algo 💎Diamond Algo - Multi-Feature Trading System
Advanced trading system combining Supertrend signals with multiple confirmation filters, risk management tools, and a comprehensive market analysis dashboard.
═══ CORE FEATURES ═══
• Smart Buy/Sell signals using modified Supertrend algorithm
• Multi-timeframe trend analysis (M1 to D1)
• Support & Resistance zone detection
• Risk management with automatic TP/SL levels (1:1, 2:1, 3:1)
• Real-time market dashboard with key metrics
• Multiple trend cloud overlays for visual confirmation
═══ SIGNAL GENERATION ═══
BUY Signal:
• Supertrend bullish crossover
• Price above SMA filter
• Optional smart signals (EMA 200 confirmation)
SELL Signal:
• Supertrend bearish crossunder
• Price below SMA filter
• Optional smart signals (EMA 200 confirmation)
═══ DASHBOARD COMPONENTS ═══
• Multi-timeframe trend status (8 timeframes)
• Current position indicator
• Market state analysis (Trending/Ranging/No trend)
• Volatility percentage
• Institutional activity monitor
• Trading session tracker (NY/London/Tokyo/Sydney)
• Trend pressure indicator
═══ VISUAL OVERLAYS ═══
• Trend Cloud: Long-term trend visualization
• Trend Follower: Adaptive trend line
• Comulus Cloud: Dual ALMA-based trend zones
• Cirrus Cloud: Short-term trend bands
• Smart Trail: Fibonacci-based trailing stop
• Dynamic trend lines with breakout alerts
═══ RISK MANAGEMENT ═══
• Automatic Stop-Loss placement (ATR-based)
• Three Take-Profit levels with Risk:Reward ratios
• Entry price labeling
• Optional distance and decimal customization
• Visual lines connecting entry to targets
═══ INPUT PARAMETERS ═══
Sensitivity (1-20): Controls signal frequency
Smart Signals Only: Filters for high-probability setups
Bar Coloring: Trend-based or gradient coloring
Dashboard Location/Size: Customizable placement
Multiple overlay toggles for clean charts
═══ BEST PRACTICES ═══
• Lower sensitivity (1-5) for swing trading
• Higher sensitivity (10-20) for scalping
• Enable Smart Signals for conservative approach
• Use dashboard to confirm multi-timeframe alignment
• Monitor volatility % before entering trades
═══ ALERT CONDITIONS ═══
• Buy Alert: Triggered on bullish signal
• Sell Alert: Triggered on bearish signal
• Trend line breakout alerts (automated)
═══ VERSION INFO ═══
Pine Script: v5
Max Labels: 500
Repainting: Minimal (uses confirmed bars for signals)
```

Liquidity Spectrum Visualizer [BigBeluga] [Optimized]This version of Liquidity Spectrum Visualizer (© BigBeluga) has been optimized to improve execution speed and reduce script load times without altering the visual output or analytical logic of the original indicator. The key improvements focus on reducing computational complexity, eliminating redundant calculations, and minimizing expensive function calls within loops.
Core Optimization Changes
Single-Pass Volume Binning (O(N) instead of O(N×M))
Original: For each bin (100) the script iterated through every bar (lookback), resulting in ~20,000 operations.
Optimized: Each bar is processed once to directly calculate its bin index. This reduces the loop complexity from O(N×M) to O(N), where N = lookback.
Precomputed Min/Max Values
Original: array.min() and array.max() were repeatedly called inside loops, re-scanning arrays hundreds of times.
Optimized: Min and max are computed once before all calculations and reused, reducing computational overhead.
Reduced Label Creation
Original: Labels were created in every iteration, potentially hundreds of times per update — a very expensive operation in Pine.
Optimized: Only two labels are created for significant high and low levels, cutting down label calls by ~99%.
Efficient Resource Management
All boxes and lines are cleared once before re-rendering instead of being deleted individually inside nested loops.
Optional gradient rendering and POC drawing remain, but only after binning is complete.
Performance Evaluation
The most important change is the reduction of loop complexity — instead of performing around 20,000 iterations per update, the optimized version now processes only about 200. This reduces execution time and makes the indicator much lighter.
Function calls such as min() and max() are now calculated only once instead of hundreds of times, which removes unnecessary overhead. Likewise, label creation has been reduced from hundreds of labels per refresh to just two, further improving performance.
As a result, the average loading time of the indicator dropped from roughly 1.5–3 seconds to about 0.05–0.2 seconds on typical datasets.

自定义均线(多色 & 分级线宽)Title: Multi-Color Moving Average Suite (MA5…MA4320) — Pine v6
Summary (1–2 lines):
An overlay indicator that plots a full ladder of SMA lines from MA5 up to MA4320. Each MA has a unique color, and line width scales with period (short = thin, mid = medium, long = thick) to make trend structure easy to read at a glance.
What it does
• Plots 16 simple moving averages: 5, 10, 20, 30, 60, 120, 160, 240, 480, 720, 960, 1440, 1750, 2880, 4320.
• Distinct colors for every MA to avoid confusion when lines cluster.
• Period-based thickness:
• Short-term (<60) = thin,
• Mid-term (60–160) = medium,
• Long-term (≥240) = thick (capped; no unlimited growth).
• Designed for quick trend reading across intraday to multi-year cycles (especially useful for 24/7 markets like crypto).
How to use
1. Add the indicator to any chart (works on all symbols/timeframes).
2. Use the thin/medium/thick visual hierarchy to identify short-/mid-/long-term bias and crossovers.
3. On very low timeframes, consider hiding some ultra-long MAs if your chart has insufficient history.
Notes
• Built with Pine Script v6; uses ta.sma(close, length) only (no repainting).
• Very long MAs (e.g., 2880/4320) require enough bars; they will display na until sufficient history loads.
• No inputs/alerts by default—kept intentionally simple for clarity. (Easy to extend with toggles, custom colors, EMA/WMA options, alerts, etc.)
Credits
Author: TraderFinsher (customized multi-MA visualization with color and thickness hierarchy).
⸻
标题: 多色均线系统(MA5…MA4320)— Pine v6
摘要(1–2 句):
这是一个叠加在价格上的 SMA 均线组,从 MA5 到 MA4320。为每条均线设置了 独立颜色,并按 周期长度分级线宽(短=细、中=中等、长=较粗),让趋势结构一眼可读。
功能说明
• 绘制 16 条简单移动平均线:5、10、20、30、60、120、160、240、480、720、960、1440、1750、2880、4320。
• 全部不同颜色,避免密集时混淆。
• 线宽随周期分级:
• 短期(<60)= 细,
• 中期(60–160)= 中等,
• 长期(≥240)= 粗(封顶,不再无限加粗)。
• 适合从日内到多年周期的 趋势快速判读(对加密等 24/7 市场尤为友好)。
使用建议
1. 将指标添加到任意品种/周期。
2. 结合细/中/粗的视觉层级,判断短/中/长趋势与均线交叉。
3. 在较低周期下,如果历史数据不足,可隐藏部分超长均线。
注意事项
• 使用 Pine v6,仅调用 ta.sma(close, length),不重绘。
• 超长均线需要足够历史数据,未满足前会显示 na。
• 默认不含参数和告警,追求简洁清晰(后续可扩展开关、自定义颜色/线宽、EMA/WMA 选项与告警等)。
致谢
作者:TraderFinsher(基于颜色与线宽层级的多均线可视化)。

Atlantean Sideways / Range Regime DetectorPurpose
When using trend based indicators, you can skip the false signals when there is a sideways action, protecting you from the false signals.
Flags likely sideways/range phases using three checks:
Weak trend (ADX from DMI)
Price compression (Bollinger Band Width, normalized)
Low volatility (NATR = ATR/Price%)
Logic
isSideways = (ADX < adxThresh) AND (bbNorm < 0.25) AND (NATR < natrMax)
When true: bars + background turn teal and a provisional Range High/Low (rolling rangeWin) is drawn.
Key Inputs
DMI: diLen(22)
Optimized for 15 mins Bitcoin, could change it to 14 for more general approach
ADX: adxSmooth(14), adxThresh(18)
Volatility: lenATR(14), natrMax(1.8)
Visuals: rangeWin(20), bar/range toggles
Quick Tuning
More signals: raise adxThresh to 20–25, raise natrMax to 2.5–4.0, increase BB cutoff by editing bbNorm < 0.25 --> 0.35–0.50.
Smoother range lines: increase rangeWin to 30–40.
Use Cases
Mean reversion inside teal ranges.
Breakout prep when price closes outside the drawn range after teal ends. Could be used as a signal although not suggested.
Filter trend systems: skip trades when sidewaysCond is true. This is the main purpose, for it to be combined with trend based indicators, like Supertrend.
Alert
“Sideways Detected” triggers when isSideways is true.
Script could be expanded upon your requests.

Mongoose Oscillator Lab — Pro v4 (weighted RSI/Stoch/MFI, div.Description (short)
Weighted composite oscillator that blends RSI, Stoch%K, and MFI into a single –100…+100 line with zero-center area fill, signal line, momentum histogram, BB-inside-Keltner squeeze, optional bull/bear divergence, MTF confirmation and a compact value/weight dashboard.
How to use
Trade in the direction of the regime strip; use green/red dots to time entries.
Prefer divergences that agree with the regime and (optionally) a higher-TF gate.
In compression (yellow dots), wait for squeeze release.
Method
Each input (RSI/Stoch/MFI) is normalized (0–100), blended by weights, then mapped to –100…+100.
Signals use EMA smoothing + band thresholds (±60 default).
Divergence is pivot-based (L/R = 5/5 by default).
Squeeze = BB width < Keltner width on 20 bars.
Suggested defaults
Lengths: RSI 14, Stoch 14, MFI 14, Smooth 9, Signal 18, MomZ 20
Weights: 1 / 1 / 1 (set any to 0 to exclude)
Bands: ±60 (tight) or ±70/80 (stricter)
MTF Gate: blank (off) or W to require osc > 0 for longs, < 0 for shorts
Notes
Indicator only (no orders). Educational use; not financial advice.

Mongoose Compass v2 — Regime & Position SizingWhat it does
Mongoose Compass v2 is a regime‐detection dashboard and optional price-chart ribbon. It combines four market “pillars” into a 0–4 score and a suggested equity beta/position size. It is scale-independent and works on any host symbol.
Pillars (green = expansion supportive):
RS IWM/SPY – small-cap relative strength vs large caps
Credit HYG/LQD – high-yield vs investment-grade credit
Growth Cu/Au – copper vs gold (cyclical demand vs safety)
Participation – uses the first available of:
Breadth (% > 200-DMA) if you provide a symbol, else
Cboe S&P 500 Dispersion (DSPX), else
RSP/SPY equal-weight proxy
Score (0–4):
≥ 3 = Expansion
2 = Neutral
≤ 1 = Contraction
A panel shows each pillar’s normalized value (0–100), bias, total score, and a suggested size (default mapping: 0/30/60/90/100% for scores 0–4). The companion “Ribbon” script paints the price chart background by regime and displays the suggested size.
How to use
Timeframes
Weekly for regime calls (recommended anchor).
Daily for execution within the active regime (adds, trims, hedges).
Playbook
Expansion (score ≥ 3): increase risk/beta; favor cyclicals, small caps, EM; reduce hedges.
Neutral (score = 2): keep moderate beta; use relative value (e.g., quality/mega vs small caps) until RS or Cu/Au turns.
Contraction (score ≤ 1): de-risk; rotate to defensives/quality, gold/long duration; add hedges.
Alerts (included):
Expansion Regime (score ≥ 3) – risk-on trigger
Contraction Regime (score ≤ 1) – risk-off trigger
Methodology
Prices are pulled with request.security on the chosen timeframe.
Pillars are built from ratios then smoothed with an SMA (Smoothing Length, default 20).
For display/comparison, series are normalized to 0–100 within a rolling window (Normalization Length, default 60).
Bias rules:
RS / Credit / Growth: fast SMA( len ) vs slow SMA( len*2 ) of each ratio
Breadth: normalized value > 60
DSPX: normalized value < 40 (lower dispersion supports index coherence)
RSP/SPY proxy: fast > slow trend test
Score is the count of green pillars (0–4).
Suggested size is a deterministic mapping from score (editable in settings).
Notes:
Host chart scaling (log vs linear) does not affect calculations.
If a breadth series is unavailable, the script automatically falls back to DSPX, then to RSP/SPY.
Settings
Sources
Default inputs use liquid ETFs (BATS/AMEX). You may switch Copper/Gold to futures (e.g., COMEX_DL:HG1!, COMEX_DL:GC1!) if your data plan supports them.
Optional Breadth: paste a percent-above-MA series if you have one.
DSPX: uses CBOE:DSPX when breadth is blank.
If neither breadth nor DSPX resolve, the script uses RSP/SPY as a participation proxy.
Calculation
Smoothing Length (20) – higher = steadier regime, fewer flips; lower = faster reaction.
Normalization Length (60) – window for the 0–100 scaling; increase to reduce pinning at extremes.
Regime Timeframe (Ribbon only) – lock the ribbon to Weekly while viewing Daily charts.
Visual
Show/hide dashboard table, choose table position, dark/light theme, ribbon opacity.
Recommended usage
Anchor decisions on Weekly Compass; use Daily for timing.
For small-cap rotation, apply on IWM/RTY; for broad beta, use SPY/ES. Output is identical regardless of host symbol because inputs are fetched internally.
Limitations & disclaimer
This is a systematic information tool, not investment advice.
Signals can whipsaw in fast markets; confirm with your risk framework.
Data availability varies by plan (especially futures and DSPX). When a source is unavailable the scripted fallbacks apply automatically.
