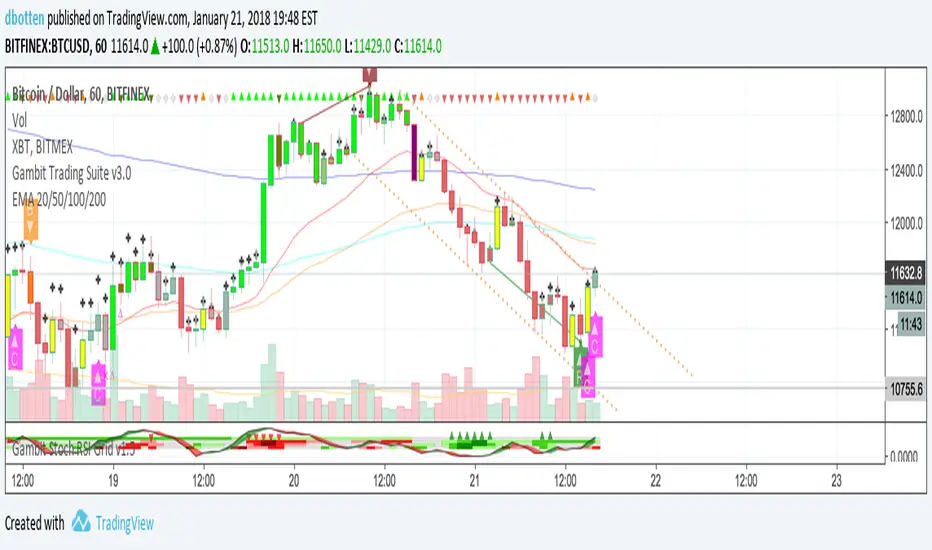
EMA 20/50/100/200Plots exponential moving average on four timeframes at once for rapid indication of momentum shift as well as slower-moving confirmations.
Displays EMA 20, 50, 100, and 200... default colors are hotter for faster timeframes, cooler for slower ones
Pesquisar nos scripts por "20年美元汇率"
B3 20/50 MeanSimple MA's 20 and 50 are averaged to produce a mean MA line. I like the smoothness of it, and it can help you stay in a trade in the slow moving trends. Also if you start to see a large cloud in your favor, it could be a great time take the profits.


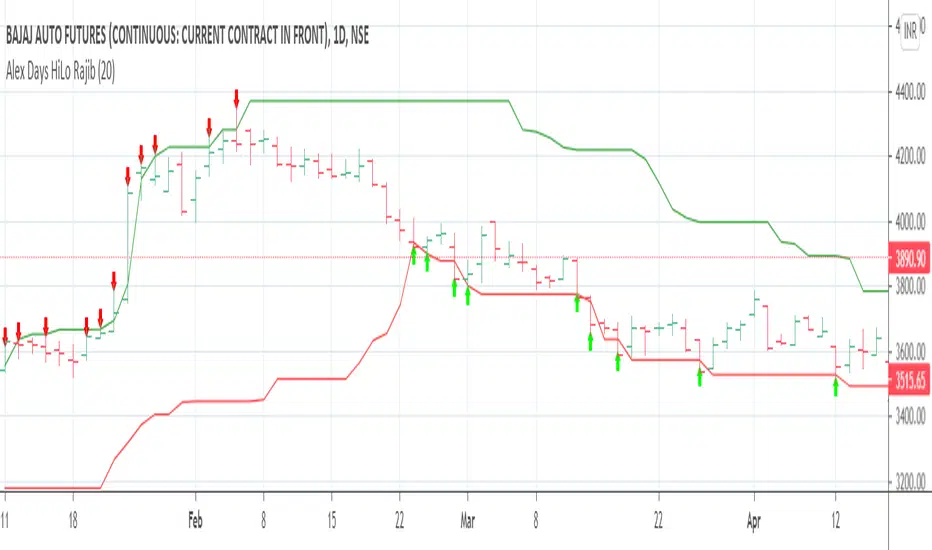
ShareGenius Swing Trading (SST) 20 days low
20 days high
target to set
special thanks to Shri Mahesh Chander Kaushik and Shri Krishan

EMA/SMA + Multi-Timeframe Dashboard (Vertical)20/50 ema and 200 sma
The EMA SMA Trading Indicator combines the power of Exponential Moving Averages (EMA) and Simple Moving Averages (SMA) to help traders identify trends, reversals, and key entry/exit points.
Features:
Dual Moving Averages: Tracks both EMA and SMA to provide a balanced view of short-term and long-term market trends.
Customizable Periods: Allows users to set unique periods for EMA and SMA to suit their trading style and timeframe (e.g., day trading, swing trading, or investing).
Cross Alerts: Highlights EMA and SMA crossover points, which often indicate potential buy or sell signals.
Color-Coded Lines: Visual differentiation between EMA (dynamic and responsive) and SMA (smooth and lagging) for better readability.
Multi-Timeframe Compatibility: Suitable for scalping, intraday trading, and long-term analysis.
Usage:
Trend Confirmation: When the EMA is above the SMA, it signals a bullish trend; when it is below the SMA, it signals a bearish trend.
Crossover Strategy: Use crossovers as potential buy (EMA crosses above SMA) or sell (EMA crosses below SMA) signals.
Dynamic Support/Resistance: EMA can act as short-term support/resistance, while SMA represents long-term levels.
This indicator is perfect for traders who want to combine EMA's speed with SMA's stability for improved decision-making in volatile markets. Customizable alerts and visual cues make it user-friendly for beginners and experienced traders.
Make informed decisions and take your trading to the next level with the EMA SMA Trading Indicator!

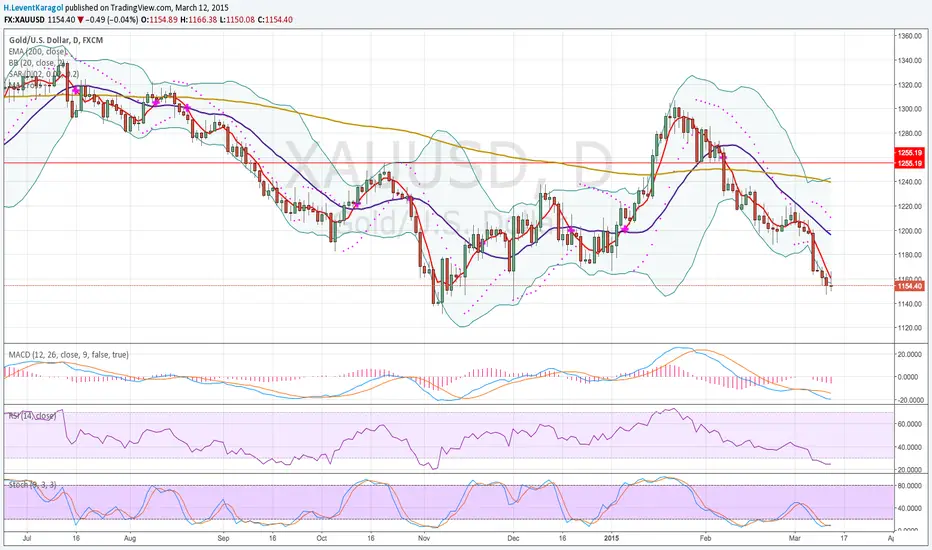
6 Bollinger Bands (1.5 thru 4)20 period SMA Bollinger Bands with the following standard deviations: 1.5 2 2.5 3 3.5 4


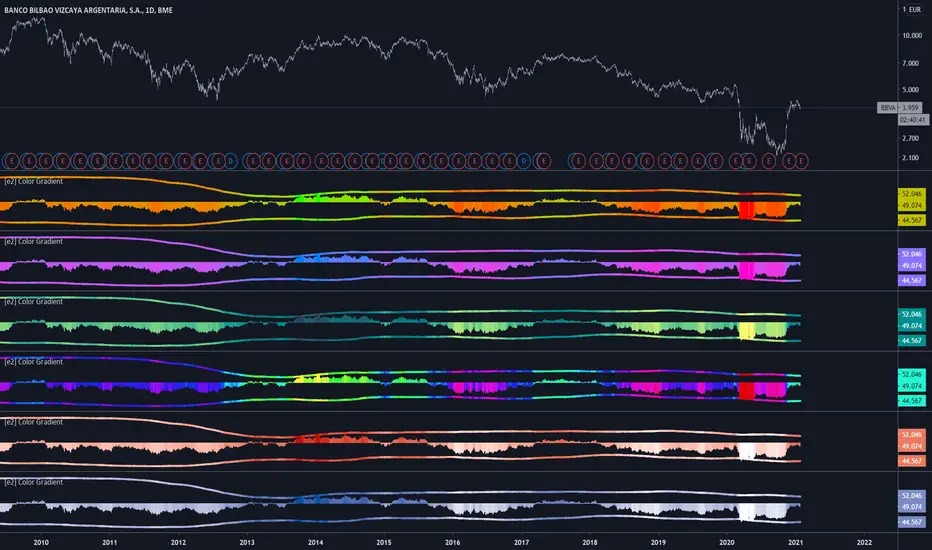
[e2] Color Gradient Function20 step red/green gradient function
The color gradient function allow colorize any source in 5% steps.
Define the source, minimum and maximum value (constant or , for example, bb (or any other channel)).
Rounded Bottom Breakout Strategy Moving Averages20-day SMA , 34-day EMA , 50-day SMA and 200-day SMA moving average indicator based on Rick Saddler's Rounded Bottom Reversal Breakout Strategy


Noro's Fishnet Strategy20 lines are JMA. Green color - a uptrend. Red color - a downtrend.
Color filter
If this checkbox is chosen, then long positions will be open only if a red candle. Short positions will open if a green candle.
If this checkbox is not chosen, then positions will open at change of a trend. Color of a candle will not matter.


20 years old Turtles strategy still work!!original idea from «Way of the Turtle: The Secret Methods that Turned Ordinary People into Legendary Traders» (2007) CURTIS FAITH

Relative Volume (RVOL) [JopAlgo]Relative Volume (RVOL) — “Filter Fakes, Ride Real Moves”
What it does:
Shows how today’s volume compares to its own average.
RVOL = current volume ÷ SMA(volume, length)
RVOL > cutoff → participation above normal (green)
RVOL < cutoff → participation below normal (red)
Use it to confirm breaks, filter entries, and avoid chasing moves fueled by thin volume.
Read it in 5 seconds
Above/Below the cutoff line (white) = high/low participation now.
Spikes through the cutoff on a break = real interest.
Dry-ups (well below cutoff) into support/resistance = good risk for mean-revert or pullback entries.
If you remember one rule: don’t chase a breakout with RVOL under the cutoff.
Simple playbook (copy this)
Breakout confirmation
Break at VAH/LVN/structure and RVOL > cutoff → take the retest that holds.
If RVOL stays below cutoff on the break → likely fake; wait for reclaim.
Pullback in trend
Trend up, price pulls to AVWAP / VAL / MA cluster with RVOL below cutoff → take the bounce when price turns; add if RVOL rises on the resume.
Fade the exhaustion
Into resistance, huge RVOL spike but no follow-through (long wick, CVD Absorption) → look for the fail back inside value.
Do less in chop
When RVOL hugs below cutoff all session, expect range; trade edges only.
Timeframe guide
1–5m (scalps): Signals are frequent. Keep cutoff ≥ 1.5; demand RVOL on breaks.
15m–1H (intraday): Sweet spot. cutoff 1.5–2.0 is a solid filter.
2H–4H (swing): Look for clustered bars > cutoff during expansions; dry-ups flag pullback entries.
1D+: Use RVOL to separate true trend days from drift.
Settings that matter
Length (default 14):
Shorter = reacts faster; Longer = smoother baseline.
Intraday: 14–20
Swing/Daily: 20–30
Cutoff (default 1.0):
Set the bar for “real” volume.
Conservative confirmation: 1.5–2.0
For slower pairs/timeframes: 1.2–1.5
Tune by scrolling back and marking where good breaks happened.
Color logic: green above cutoff, red below—no surprises.
Best combos (kept simple)
Volume Profile v3.2 : Confirm breaks of VAH/VAL/LVNs with RVOL > cutoff; target POC/HVNs.
Anchored VWAP : Reclaims/rejections with RVOL > cutoff stick more often.
CVDv1 :
Yes: RVOL high and CVD Alignment OK and no Absorption → higher-quality move.
No: RVOL high but Absorption red → don’t chase; look for fail/reclaim.
Pattern cheat sheet
Trend day: RVOL stays > cutoff on pushes; pullbacks show RVOL dip, then re-expand.
False break: Price pokes level, RVOL < cutoff, quick give-back.
Accumulation: Series of low-RVOL bars compressing under a level → watch for the first RVOL pop to go.
Exhaustion wick: RVOL spike + long wick into resistance/support → likely trap unless next bar accepts.
Notes & pitfalls
Exchange volume varies (crypto): use the same feed you trade and calibrate cutoff there.
RVOL ≠ direction: it’s participation. Always pair with location, structure, and flow.
Quick defaults to start
Length: 20
Cutoff: 1.5 (intraday) / 1.8–2.0 (for stricter confirmation)
Process: Level → RVOL above/below cutoff → CVD quality → Execute with structure-based risk
Mini-disclaimer
Educational tool, not financial advice. Test first, size sensibly, and always anchor decisions to levels, flow, and risk.

Multiple Moving Averages [JopAlgo]Multiple Moving Averages — read trend, timing, and strength at a glance
What it does:
Mark up to 5 moving averages (you pick type + length + color). Watch how they stack, slope, braid, and fan out to judge trend direction, pullback timing, and breakout quality on any timeframe.
Read it in 5 seconds
Stack order:
Bullish: fast MAs on top of slow MAs.
Bearish: fast MAs below slow MAs.
Slope: up = trend has a tailwind; down = headwind.
Spacing: wide = strong trend; tight/braided = balance/chop.
If you remember only one rule: trade with the stack and slope, enter at levels.
High-probability plays (simple and repeatable)
Trend pullback (with level)
Stack is bullish, slopes up.
Price pulls back to the MA cluster (or AVWAP/VAL), holds, fast MAs curl back up.
Long. Stop: below structure/slowest MA. Target: POC/HVNs or next swing.
(Mirror for shorts in a bearish stack.)
Reclaim + recurl
After a down phase, price closes above fast MAs (MA1–MA2), they turn up, and you’re at a real level (AVWAP/VA edge).
Take the first higher-low with the stack starting to flip.
Squeeze → expansion
MAs braid tight = energy building.
Break at a level, then the lines fan out in your direction.
Enter on the first retest that holds.
Skip trades when the lines are braided mid-range and you’re not at a level.
Timeframe guide (what usually works)
1–5m (scalps): EMA heavy (e.g., 5/9/21/34/55). Expect more signals; filter with levels + CVD.
15m–1H (intraday): 9/21/34/50/200 (mix EMA for fast, SMA for slow).
2H–4H (swing): 10/20/50/100/200 or 8/21/34/55/89 (smoother read).
1D+ (position): 20/50/100/200 (bias) and enter on lower TF.
Tip: Don’t set all five to the same length—stagger them so the stack tells a story.
Settings that matter (and what they mean)
MA types (pick the feel you like):
EMA – fastest response (great for timing).
SMA – smoother backbone (great for bias).
WMA / LWMA – responsive but less twitchy than EMA.
VWMA – weights price by volume (good on assets with uneven volume).
SMMA – very smooth (reduces whips).
DEMA – extra fast (can be noisy).
HEMA – in this script behaves like a double-EMA style response (fast).
RVIMA – not implemented here (will plot nothing if chosen).
Length:
Shorter = earlier turns, more noise.
Longer = slower, cleaner bias.
Keep a sensible spread (e.g., 1:2:3… or Fib-style 9/21/34/55/89).
Colors:
Use consistent colors (e.g., warm = fast, cool = slow) so you can read the stack instantly.
Best combos with other tools
Volume Profile v3.2: take signals at VAH/VAL/LVNs; use POC/HVNs for targets.
Anchored VWAP: reclaims/rejections + MA recurl = clean timing.
CVDv1: execute with flow (Alignment OK, strong Imbalance, no Absorption against you).
Common mistakes this prevents
Shorting into a bullish stack (or buying into a bearish one).
Chasing far from the fast MAs; better to wait for a pullback.
Trading every wiggle in chop—braids tell you to do less.
Quick FAQs
Cluttered chart? Hide 1–2 lines (keep fast, middle, slow) or thin the linewidth.
Which one is “right”? None. Pick a set that fits your tempo and stick to it.
RVIMA option? Not implemented in this version—choose another type.
Starter presets (copy these, then adjust)
Intraday: MA1 EMA9, MA2 EMA21, MA3 SMA34, MA4 SMA50, MA5 SMA200
Swing: MA1 EMA10, MA2 SMA20, MA3 SMA50, MA4 SMA100, MA5 SMA200
Scalp: MA1 EMA5, MA2 EMA9, MA3 EMA21, MA4 EMA34, MA5 EMA55
Mini-disclaimer
Educational tool, not financial advice. Always anchor trades to levels, flow, and risk—this indicator keeps your bias and timing honest; the plan is still yours.

Multi MA Cross [JopAlgo]Multi MA Cross — simple, flexible trend + timing
What it does:
Plots two moving averages (you pick the types and lengths) and marks their crossovers. Use it to read trend direction and time pullbacks/breakouts. Works on any timeframe.
What you’ll see
Short MA (orange)
Long MA (lime)
Cross mark (aqua ✚) when they cross
Green/lime above orange = bullish bias (short MA above long).
Orange above lime = bearish bias.
How to use it (simple playbook)
Trade with the bias
Longs only when short MA > long MA.
Shorts only when short MA < long MA.
Enter at a real level
Use Volume Profile v3.2 (VAH/VAL/POC/LVNs) or Anchored VWAP .
Crosses at or just after a level hold are higher quality.
Quality check (optional, strong)
CVDv1 : take trades when Alignment = OK, Imbalance strong, Absorption ≠ red.
Manage risk
Stop goes beyond the level/structure, not on an MA wiggle.
Trim into POC/HVNs or next structure.
Good entries you’ll recognize
Pullback-to-long MA (trend):
Bias up, price pulls to long MA (or AVWAP/VAL), short MA curls back up → enter long.
Reclaim + cross:
Price reclaims AVWAP/VA edge, then short MA crosses over long → confirmation to join.
Squeeze → break:
MAs converge (tight), then expand after a level break. Enter on retest that holds.
Skip crosses in the middle of nowhere. Cross + location + flow beats cross alone.
Timeframe guidance
1–5m (scalps): EMA/EMA or EMA/WMA. Expect more crosses. Use VP/AVWAP and CVD filters.
15m–1H (intraday): EMA(9) vs SMA(21) is a solid default.
2H–4H (swing): SMA(20–34) vs SMA(50) or EMA(21) vs EMA(55).
1D+ (position): SMA(50) vs SMA(200) for broad bias; entries on lower TF.
Settings that matter (and what they mean)
Short/Long MA Type:
EMA = fast, good for timing.
SMA = smooth, good for bias.
WMA/LWMA = in-between (responsive).
VWMA = weights by volume.
SMMA = very smooth (reduces whips).
HEMA/DEMA = extra responsive.
VWAP = daily session VWAP (anchor), ignores length in practice.
Short/Long Length:
Short = timing sensitivity.
Long = trend backbone.
Keep a ratio ~ 1:2 to 1:3 (e.g., 9/21, 10/30, 20/50).
Note on VWAP option: The script fetches a daily VWAP anchor. It acts like a fair-value line, not a rolling MA. Your Length won’t affect VWAP.
Filters that boost win rate
Slope check: Only take longs when both MAs slope up; shorts when both slope down.
Distance check: Don’t chase if price is far from the short MA; wait for a pullback.
HTF agreement: On 15m, glance at 1H/4H bias; on 4H, glance at 1D. Trade with the higher-TF wind.
Combos that work
Volume Profile v3.2: Use VAH/VAL/POC/LVNs for entries/targets. Cross at those references is meaningful.
Anchored VWAP: Reclaims/rejections first, MA cross second = cleaner timing.
CVDv1: Only act when flow agrees (ALIGN OK, no Absorption against you).
Common mistakes this avoids
Shorting into an up-bias (or vice versa).
Chasing a cross far from value (wait for the pullback).
Trading every cross in chop (use levels + CVD to filter).
Defaults to start with
Short MA: EMA 9
Long MA: SMA 21
Timeframes: 15m–4H
Process: Bias → Level → Cross/Retest → CVD check → Execute
Quick disclaimer
Educational tool, not financial advice. Test first, size sensibly, and always anchor your trades to levels, flow, and risk.

FRAMA Channel [JopAlgo]FRAMA Channel — let the market tell you how fast to move
Most moving averages make you pick a speed and hope it fits every regime. FRAMA (Fractal Adaptive Moving Average, popularized by John Ehlers) does the opposite: it adapts its smoothing to market structure. When price action is “trendy” (more directional, less jagged), FRAMA speeds up; when it’s choppy (more fractal noise), FRAMA slows down and filters the rubble.
FRAMA Channel wraps that adaptive core with a volatility channel and clean color logic so you can read trend, mean-reversion windows, and breakouts in one glance—on any timeframe.
What you’re seeing (plain-English tour)
FRAMA midline (Filt): the adaptive average. It’s computed from a fractal dimension of price over Length (N).
Trendy tape → lower fractal dimension → FRAMA tracks price tighter.
Choppy tape → higher fractal dimension → FRAMA smooths harder.
Channel bands (Filt ± distance × volatility): the “breathing room.” Volatility here is a long lookback average of (high − low).
Upper band = potential resistance in down/neutral or trend-walk path in uptrends.
Lower band = mirror logic for shorts.
Color logic (simple and strict):
Green when price breaks above the upper band → bullish regime (momentum present).
Red when price breaks below the lower band → bearish regime.
White when price crosses the FRAMA midline → neutral/reset.
Optional candle coloring: toggle Color Candles to tint the chart itself with the regime color—handy for quick reads.
(When you add screenshots: image #1 should label FRAMA, bands, and the three colors in a small trend + pullback. Image #2 can show a “squeeze → expansion” sequence: channel tightens, then price breaks and walks the band.)
How it’s built (without the jargon)
The script measures three ranges over your Length (N): two half-windows and the full window.
It converts those into a fractal dimension (Dimen). That number says “how zig-zaggy” price is right now.
It turns Dimen into an alpha (smoothing factor): alpha = exp(−4.6 × (Dimen − 1)), clamped so it never explodes or flatlines.
It updates FRAMA each bar using that alpha.
It builds bands using a long average of (high − low) multiplied by your Bands Distance setting.
It changes color only on confirmed bar events:
hlc3 crosses above the upper band → green
hlc3 crosses below the lower band → red
close crosses the midline → white
Result: a channel that tightens in balance, widens in trend, and doesn’t flicker on partial bars.
How to use FRAMA Channel on any timeframe
Same framework everywhere. Your job is to choose where to act (objective levels) and let FRAMA tell you trend/mean-reversion context and breakout quality.
Scalping (1–5m)
Pullback-to-midline (trend): When color is green, buy pullbacks that hold at/above the midline; when red, short pullbacks that fail at/below it.
Invalidation: a white flip (midline cross back) right after entry → tighten or bail.
Squeeze → break: A narrowing channel often precedes a move. Only chase the break if color flips to green/red and the first pullback holds the band/midline.
Intraday (15m–1H)
Trend rides: In green/red, expect price to walk the outer band. Entries on midline kisses are cleaner than chasing the band itself.
Balance fades: In white (neutral) with a tight channel, fade outer band → midline—but only at a real level (see “Pairing” below).
Swing (2H–4H)
Regime compass: Color changes that stick (several bars) often mark swing regime shifts. Combine with Weekly/Event AVWAP and composite VP levels.
Add/Trim: In an uptrend, add on midline holds; trim as the channel widens and price spikes beyond the upper band into HVNs.
Position (1D–1W)
Context first: A persistent green weekly channel is constructive; a persistent red is distributive.
Patience: Wait for midline retests at higher-TF levels rather than chasing outer-band prints.
Entries, exits, and risk (keep it simple)
Continuation entry (trend):
Color already green/red.
Price pulls back to FRAMA midline (or shallowly toward it) and holds.
Take the trend side.
Stop: beyond the opposite side of the midline or behind local structure.
Targets: your Volume Profile HVN/POC or prior swing, not the band alone.
Breakout entry:
Channel had tightened; price breaks a key level.
Color flips green/red and the first retest holds.
Enter with the break.
Avoid: breaks that flip color but immediately white-flip on the next bar.
Mean-reversion entry (balance):
Color white and channel tight.
At a VP edge (VAL/VAH), fade outer band → midline.
Stop: just outside the band; Exit: at midline/POC.
Settings that actually matter (and how to tune them)
Length (N) — default 26
Controls how FRAMA “reads” structure.
Shorter (14–20): faster, more responsive (good for scalps/intraday), more flips in chop.
Longer (30–40): steadier (good for swings/position), slower to acknowledge new trends.
Bands Distance — default 1.5
Scales the channel width.
If you’re constantly tagging bands, increase slightly (1.7–2.0).
If nothing ever reaches the band, decrease (1.2–1.4) to make context meaningful.
Color Candles — on/off
Great for quick regime reads. If your chart feels too busy, leave bands colored and turn candle coloring off.
Warm-up note: FRAMA references N bars. Right after switching timeframes or symbols, give it N–2N bars to settle before you judge the current state.
(You may see an input named “Signals Data” in this version; it’s reserved for future enhancements.)
What to look for (pattern cheat sheet)
Walk-the-band: After a green/red flip, price hugs the outer band while the midline slopes. Ride pullbacks to the midline, don’t fade the band.
Squeeze → Expansion: Channel pinches, then color flips and bands widen—that’s the move. The first midline retest is your best entry.
False break tell: Brief color flip to green/red that immediately reverts to white on the next bar—skip chasing; plan for a reclaim.
Midline reclaims: In chop, repeated white↔green/white↔red flips say “mean reversion”; stay tactical and target the midline/POC.
Pairing FRAMA Channel with other tools
Cumulative Volume Delta v1 (CVDv1):
FRAMA tells you trend/mean-reversion context; CVDv1 tells you flow quality.
Breakout quality: FRAMA flips green and CVDv1 ALIGN = OK, Imbalance strong, Absorption ≠ red → higher odds the break sticks.
If Absorption is red on a FRAMA green flip, do not chase—wait for retest or look for a fail/reclaim.
Volume Profile v3.2:
Use VAH/VAL/LVNs/POC for where.
Green + VAL retest → rotate toward POC/HVN.
Red + VAH rejection → rotate back to POC.
LVN + green flip → expect fast travel toward the next HVN; set targets there.
Anchored VWAP :
Treat AVWAP as fair-value rails.
AVWAP reclaim + FRAMA green → excellent trend-resume entry.
AVWAP rejection + FRAMA red → high-quality short; use midline as your risk guide.
Common pitfalls this helps you avoid
Chasing every poke: FRAMA’s white → green/red state change helps you wait for confirmation (or a retest) instead of reacting to the first wick.
Fading a real trend: A sloped midline with price walking the band is telling you not to fight it.
Stops too tight: In expansion, give the trade room to the midline or local structure, not just inside the channel.
Practical defaults to start with
Length: 26
Bands Distance: 1.5
Color Candles: on (turn off if your chart is busy)
Timeframes: works out of the box on 15m–4H; for 1–5m try Length=20; for daily swings try Length=34–40.
Open source & disclaimer
This indicator is published open source so traders can learn, tweak, and build rules they trust. No tool guarantees outcomes; risk management is essential.
Disclaimer — Not Financial Advice.
The “FRAMA Channel ” indicator and this description are provided for educational purposes only and do not constitute financial or investment advice. Trading involves risk, including possible loss of capital. makes no warranties and assumes no responsibility for any trading decisions or outcomes resulting from the use of this script. Past performance is not indicative of future results.
Use FRAMA Channel for context (trend vs balance, squeeze vs expansion), Volume Profile v3.2 and Anchored VWAP for locations, and CVDv1 for flow quality. That trio keeps your trades selective and your rules consistent on any timeframe.
