MarkdownUtilsLibrary "MarkdownUtils"
This library shows all of CommonMark's formatting elements that are currently (2024-03-30)
available in Pine Script® and gives some hints on how to use them.
The documentation will be in the tooltip of each of the following functions. It is also
logged into Pine Logs by default if it is called. We can disable the logging by setting `pLog = false`.
mediumMathematicalSpace()
Medium mathematical space that can be used in e.g. the library names like `Markdown Utils`.
Returns: The medium mathematical space character U+205F between those double quotes " ".
zeroWidthSpace()
Zero-width space.
Returns: The zero-width character U+200B between those double quotes "".
stableSpace(pCount)
Consecutive space characters in Pine Script® are replaced by a single space character on output.
Therefore we require a "stable" space to properly indent text e.g. in Pine Logs. To use it in code blocks
of a description like this one, we have to copy the 2(!) characters between the following reverse brackets instead:
# > <
Those are the zero-width character U+200B and a space.
Of course, this can also be used within a text to add some extra spaces.
Parameters:
pCount (simple int)
Returns: A zero-width space combined with a space character.
headers(pLog)
Headers
```
# H1
## H2
### H3
#### H4
##### H5
###### H6
```
*results in*
# H1
## H2
### H3
#### H4
##### H5
###### H6
*Best practices*: Add blank line before and after each header.
Parameters:
pLog (bool)
paragrahps(pLog)
Paragraphs
```
First paragraph
Second paragraph
```
*results in*
First paragraph
Second paragraph
Parameters:
pLog (bool)
lineBreaks(pLog)
Line breaks
```
First row
Second row
```
*results in*
First row\
Second row
Parameters:
pLog (bool)
emphasis(pLog)
Emphasis
With surrounding `*` and `~` we can emphasize text as follows. All emphasis can be arbitrarily combined.
```
*Italics*, **Bold**, ***Bold italics***, ~~Scratch~~
```
*results in*
*Italics*, **Bold**, ***Bold italics***, ~~Scratch~~
Parameters:
pLog (bool)
blockquotes(pLog)
Blockquotes
Lines starting with at least one `>` followed by a space and text build block quotes.
```
Text before blockquotes.
> 1st main blockquote
>
> 1st main blockquote
>
>> 1st 1-nested blockquote
>
>>> 1st 2-nested blockquote
>
>>>> 1st 3-nested blockquote
>
>>>>> 1st 4-nested blockquote
>
>>>>>> 1st 5-nested blockquote
>
>>>>>>> 1st 6-nested blockquote
>
>>>>>>>> 1st 7-nested blockquote
>
> 2nd main blockquote, 1st paragraph, 1st row\
> 2nd main blockquote, 1st paragraph, 2nd row
>
> 2nd main blockquote, 2nd paragraph, 1st row\
> 2nd main blockquote, 2nd paragraph, 2nd row
>
>> 2nd nested blockquote, 1st paragraph, 1st row\
>> 2nd nested blockquote, 1st paragraph, 2nd row
>
>> 2nd nested blockquote, 2nd paragraph, 1st row\
>> 2nd nested blockquote, 2nd paragraph, 2nd row
Text after blockquotes.
```
*results in*
Text before blockquotes.
> 1st main blockquote
>
>> 1st 1-nested blockquote
>
>>> 1st 2-nested blockquote
>
>>>> 1st 3-nested blockquote
>
>>>>> 1st 4-nested blockquote
>
>>>>>> 1st 5-nested blockquote
>
>>>>>>> 1st 6-nested blockquote
>
>>>>>>>> 1st 7-nested blockquote
>
> 2nd main blockquote, 1st paragraph, 1st row\
> 2nd main blockquote, 1st paragraph, 2nd row
>
> 2nd main blockquote, 2nd paragraph, 1st row\
> 2nd main blockquote, 2nd paragraph, 2nd row
>
>> 2nd nested blockquote, 1st paragraph, 1st row\
>> 2nd nested blockquote, 1st paragraph, 2nd row
>
>> 2nd nested blockquote, 2nd paragraph, 1st row\
>> 2nd nested blockquote, 2nd paragraph, 2nd row
Text after blockquotes.
*Best practices*: Add blank line before and after each (nested) blockquote.
Parameters:
pLog (bool)
lists(pLog)
Paragraphs
#### Ordered lists
The first line starting with a number combined with a delimiter `.` or `)` starts an ordered
list. The list's numbering starts with the given number. All following lines that also start
with whatever number and the same delimiter add items to the list.
#### Unordered lists
A line starting with a `-`, `*` or `+` becomes an unordered list item. All consecutive items with
the same start symbol build a separate list. Therefore every list can only have a single symbol.
#### General information
To start a new list either use the other delimiter or add some non-list text between.
List items in Pine Script® allow line breaks but cannot have paragraphs or blockquotes.
Lists Pine Script® cannot be nested.
```
1) 1st list, 1st item, 1st row\
1st list, 1st item, 2nd row
1) 1st list, 2nd item, 1st row\
1st list, 2nd item, 2nd row
1) 1st list, 2nd item, 1st row\
1st list, 2nd item, 2nd row
1. 2nd list, 1st item, 1st row\
2nd list, 1st item, 2nd row
Intermediary text.
1. 3rd list
Intermediary text (sorry, unfortunately without proper spacing).
8. 4th list, 8th item
8. 4th list, 9th item
Intermediary text.
- 1st list, 1st item
- 1st list, 2nd item
* 2nd list, 1st item
* 2nd list, 2nd item
Intermediary text.
+ 3rd list, 1st item
+ 3rd list, 2nd item
```
*results in*
1) 1st list, 1st item, 1st row\
1st list, 1st item, 2nd row
1) 1st list, 2nd item, 1st row\
1st list, 2nd item, 2nd row
1) 1st list, 2nd item, 1st row\
1st list, 2nd item, 2nd row
1. 2nd list, 1st item, 1st row\
2nd list, 1st item, 2nd row
Intermediary text.
1. 3rd list
Intermediary text (sorry, unfortunately without proper spacing).
8. 4th list, 8th item
8. 4th list, 9th item
Intermediary text.
- 1st list, 1st item
- 1st list, 2nd item
* 2nd list, 1st item
* 2nd list, 2nd item
Intermediary text.
+ 3rd list, 1st item
+ 3rd list, 2nd item
Parameters:
pLog (bool)
code(pLog)
### Code
`` `Inline code` `` is formatted like this.
To write above line we wrote `` `` `Inline code` `` ``.
And to write that line we added another pair of `` `` `` around that code and
a zero-width space of function between the inner `` `` ``.
### Code blocks
can be formatted like that:
~~~
```
export method codeBlock() =>
"code block"
```
~~~
Or like that:
```
~~~
export method codeBlock() =>
"code block"
~~~
```
To write ````` within a code block we can either surround it with `~~~`.
Or we "escape" those ````` by only the zero-width space of function (stableSpace) in between.
To escape \` within a text we use `` \` ``.
Parameters:
pLog (bool)
horizontalRules(pLog)
Horizontal rules
At least three connected `*`, `-` or `_` in a separate line build a horizontal rule.
```
Intermediary text.
---
Intermediary text.
***
Intermediary text.
___
Intermediary text.
```
*results in*
Intermediary text.
---
Intermediary text.
***
Intermediary text.
___
Intermediary text.
*Best practices*: Add blank line before and after each horizontal rule.
Parameters:
pLog (bool)
tables(pLog)
Tables
A table consists of a single header line with columns separated by `|`
and followed by a row of alignment indicators for either left (`---`, `:---`), centered (`:---:`) and right (`---:`)
A table can contain several rows of data.
The table can be written as follows but hasn't to be formatte like that. By adding (stableSpace)
on the correct side of the header we could even adjust the spacing if we don't like it as it is. Only around
the column separator we should only use a usual space on each side.
```
Header 1 | Header 1 | Header 2 | Header 3
--- | :--- | :----: | ---:
Left (Default) | Left | Centered | Right
Left (Default) | Left | Centered | Right
```
*results in*
Header 1 | Header 1 | Header 2 | Header 3
--- | :--- | :----: | ---:
Left (Default) | Left | Centered | Right
Left (Default) | Left | Centered | Right
Parameters:
pLog (bool)
links(pLog)
## Links.
### Inline-style
` (Here should be the link to the TradingView homepage)`\
results in (Here should be the link to the TradingView homepage)
` (Here should be the link to the TradingView homepage "Trading View tooltip")`\
results in (Here should be the link to the TradingView homepage "Trading View tooltip")
### Reference-style
One can also collect all links e.g. at the end of a description and use a reference to that as follows.
` `\
results in .
` `\
results in .
` `\
results in .
` (../tradingview/scripts/readme)`\
results in (../tradingview/scripts/readme).
### URLs and email
URLs are also identified by the protocol identifier, email addresses by `@`. They can also be surrounded by `<` and `>`.
Input | Result
--- | ---
`Here should be the link to the TradingView homepage` | Here should be the link to the TradingView homepage
`` |
`support@tradingview.com` | support@tradingview.com
`` |
## Images
We can display gif, jp(e)g and png files in our documentation, if we add `!` before a link.
### Inline-style:
`! (Here should be the link to the favicon of the TradingView homepage "Trading View icon")`
results in
! (Here should be the link to the favicon of the TradingView homepage "Trading View icon")\
### Reference-style:
`! `
results in
!
## References for reference-style links
Even though only the formatted references are visible here in the output, this text is also followed
by the following references with links in the style
` : Referenced link`
```
: Here should be the link to the TradingView homepage "Trading view text-reference tooltip"
: Here should be the link to the TradingView homepage "Trading view number-reference tooltip"
: Here should be the link to the TradingView homepage "Trading view self-reference tooltip"
: Here should be the link to the favicon of the TradingView homepage "Trading View icon (reference)"
Parameters:
pLog (bool)
taskLists(pLog)
Task lists.
Other Markdown implementations can also display task lists for list items like `- ` respective `- `.
This can only be simulated by inline code `` ´ ` ``.
Make sure to either add a line-break `\` at the end of the line or a new paragraph by a blank line.
### Task lists
` ` Finish library
` ` Finish library
Parameters:
pLog (bool)
escapeMd(pLog)
Escaping Markdown syntax
To write and display Markdown syntax in regular text, we have to escape it. This can be done
by adding `\` before the Markdown syntax. If the Markdown syntax consists of more than one character
in some cases also the character of function can be helpful if a command consists of
more than one character if it is placed between the separate characters of the command.
Parameters:
pLog (bool)
test()
Calls all functions of above script.
Pesquisar nos scripts por "2024年3月+股票市场+异常波动"

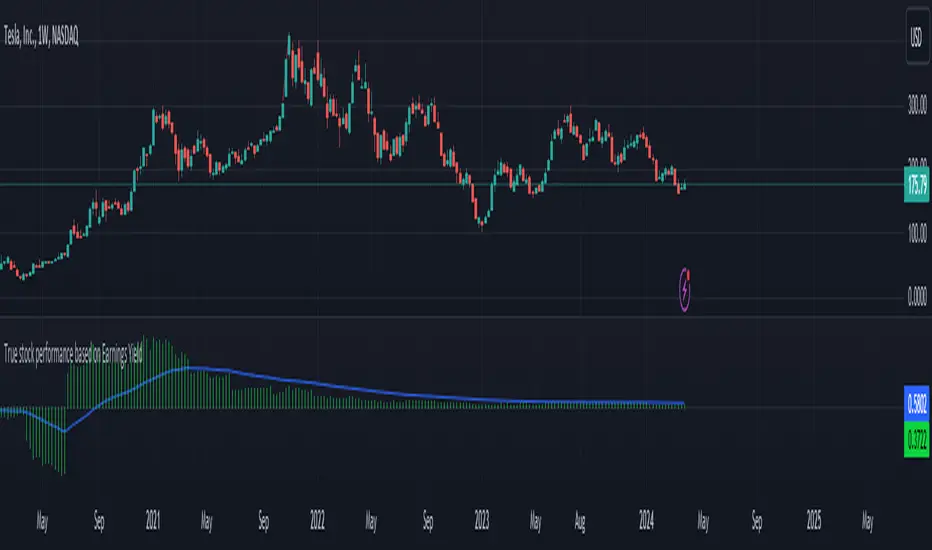
True stock performance based on Earnings YieldThe whole basis of the stock market is that you invest your money into a business that can use that money to increase it's earnings and pay you back for that investment with dividends and increased stock value. But because we are human the market often overbuy stocks that cant keep up their earnings with the current inflow of investments. We can also oversell a stock that is keeping up with earnings in regards to the stock price but we don't care because of the sentiment we have.
Earnings Yield is simply the percentage of Earnings Per Share in relation to the stock price. Alone, it's a great fundamental indicator to analyze a company. But I wanted to use it in another way and got tired of using the calculator all the time so that's why I made this indicator.
The goal is to see if the STOCK price is moving accordingly to the BUSINESS earnings. It works by calculating the difference of EY (TTM) previous close (1 bar) to the close thereafter. It then calculates the stock performance of the latest bar and divides that to get decimal form instead of percent. Then it divides the stock performance in decimal form with the difference of EY calculated before. The result shows how much the stock prices moves in relation to how much EY is moving. The theory is that if EY barely moves but the stock price moves heavily, you have a sentiment driven trend.
Example: Week 1 EY = 1.201. Week 2 EY = 1.105.
1.201 - 1.105 = 0.096
Week 2 performed a 11,2% increase in stock price. = 0.112 in decimal form.
0.112 / 0.096 = 1.67
1.67 is the multiple that plots this indicator.
Here is an good example of a stock that's currently in a highly sentiment driven trend, NVIDIA! (Posted 2024-03-30)
Here is an example of a Swedish stock that retail investors flocked to that have been blowned out completely.
When do I buy and sell?
This indicator is not meant to give exact entries or exits. The purpose is to scout the current and past sentiment, possible divergencies and see if a stock is over or under valued. I did add a 50 EMA to get some form of mean plotted. One could buy when true performance is low and sell when true performance drops below the 50 EMA. You could also just sell a part of your position and set a trailing exit with a ordinary 50 EMA or something like that. Often the sentiment will keep driving the price up. But if it last for 1 month or 1 year is impossible to tell.
Try it out and learn how it works and use it as you like. Cheers!
RSI Strategy with Manual TP and SL 19/03/2024This TradingView script implements a simple RSI (Relative Strength Index) strategy with manual take profit (TP) and stop-loss (SL) levels. Let's break down the script and analyze its components:
RSI Calculation: The script calculates the RSI using the specified length parameter. RSI is a momentum oscillator that measures the speed and change of price movements. It ranges from 0 to 100 and typically values above 70 indicate overbought conditions while values below 30 indicate oversold conditions.
Strategy Parameters:
length: Length of the RSI period.
overSold: Threshold for oversold condition.
overBought: Threshold for overbought condition.
trail_profit_pct: Percentage for trailing profit.
Entry Conditions:
For a long position: RSI crosses above 30 and the daily close is above 70% of the highest close in the last 50 bars.
For a short position: RSI crosses below 70 and the daily close is below 130% of the lowest close in the last 50 bars.
Entry Signals:
Long entry is signaled when both conditions for a long position are met.
Short entry is signaled when both conditions for a short position are met.
Manual TP and SL:
Take profit and stop-loss levels are calculated based on the entry price and the specified percentage.
For long positions, the take profit level is set above the entry price and the stop-loss level is set below the entry price.
For short positions, the take profit level is set below the entry price and the stop-loss level is set above the entry price.
Strategy Exits:
Exit conditions are defined for both long and short positions using the calculated take profit and stop-loss levels.
Chart Analysis:
This strategy aims to capitalize on short-term momentum shifts indicated by RSI crossings combined with daily price movements.
It utilizes manual TP and SL levels, providing traders with flexibility in managing their positions.
The strategy may perform well in ranging or oscillating markets where RSI signals are more reliable.
However, it may encounter challenges in trending markets where RSI can remain overbought or oversold for extended periods.
Traders should backtest this strategy thoroughly on historical data and consider optimizing parameters to suit different market conditions.
Risk management is crucial, so traders should carefully adjust TP and SL percentages based on their risk tolerance and market volatility.
Overall, this strategy provides a structured approach to trading based on RSI signals while allowing traders to customize their risk management. However, like any trading strategy, it should be used judiciously and in conjunction with other forms of analysis and risk management techniques.

Ichimoku OscillatorHello All,
This is Ichimoku Oscillator that creates different oscillator layers, calculates the trend and possible entry/exit levels by using Ichimoku Cloud features.
There are four layer:
First layer is the distance between closing price and cloud (min or max, depending on the main trend)
Second layer is the distance between Lagging and Cloud X bars ago (X: the displacement)
Third layer is the distance between Conversion and Base lines
Fourth layer is the distance between both Leadlines
If all layers are visible maning that positive according to the main trend, you can take long/short position and when main trend changed then you should close the position. so it doesn't mean you can take position when main trend changed, you need to wait for all other conditions met (all layers(
there is take profit partially option. if Conversion and base lines cross then you can take profit partially. Optionally you can take profit partially when EMA line crosses Fourth layer.
Optionally ATR (average true range) is used for Conversion and baseline for protection from whipsaws. you can use it to stay on the trend longer time.
I added options to enable/disable the alert and customize alert messages. You can change alert messages as you wish. if you use ' close ' in the alert message then you can get closing price in the alert message when the alert was triggered.
There is an option Bounce Off Support/Resistance , if there is trend and if the price bounce off Support/Resistance zone then a tiny triangle is shown.
There are many other options for coloring, alerts etc.
Some screenshots:
Main trend:
Taking/closing positions:
Example alert messages:
Bounce off:
Colors:
Colors:
Colors:
Non-colored background:
P.S. For a few months I haven't published any new script because of some health issues. hope to be healthy and create new scripts in 2024 :)
Enjoy!

Volume Heatmap 2024 | NXT2017 Christmas EditionHi big players around the world,
I wish you a merry christmas time.
Today I have a nice present for you: a new volume heatmap indicator for free using!
HISTORY
My first volume heatmap project got a lot of feedback and a big demand. You can find it here:
In this time pinescript version 4 was the newest one and I worked the first time with arrays.
Today we have pinescript version 5 and some new features. This is why I tried again with matrix function and the results are better than I expected.
HOW IT WORKS
The indicator calculates similar like the volume profile. It looks back and every volume where the close price is on the same row area, the volume will cumulated. How much rows the new chart view is showing, you can choose manually.
The mind behind this is to find high volume levels, where high volume catch the price in a range or get function as support/resistance line.
PICTURES
I hope it helps for your trading. You are welcome to give some comments.
Merry christmas and best regards
NXT2017

chrono_utilsLibrary "chrono_utils"
📝 Description
Collection of objects and common functions that are related to datetime windows session days and time ranges. The main purpose of this library is to handle time-related functionality and make it easy to reason about a future bar checking if it will be part of a predefined session and/or inside a datetime window. All existing session functionality I found in the documentation e.g. "not na(time(timeframe, session, timezone))" are not suitable for strategy scripts, since the execution of the orders is delayed by one bar, due to the script execution happening at the bar close. Moreover, a history operator with a negative value that looks forward is not allowed in any pinescript expression. So, a prediction for the next bar using the bars_back argument of "time()"" and "time_close()" was necessary. Thus, I created this library to overcome this small but very important limitation. In the meantime, I added useful functionality to handle session-based behavior. An interesting utility that emerged from this development is data anomaly detection where a comparison between the prediction and the actual value is happening. If those two values are different then a data inconsistency happens between the prediction bar and the actual bar (probably due to a holiday, half session day, a timezone change etc..)
🤔 How to Guide
To use the functionality this library provides in your script you have to import it first!
Copy the import statement of the latest release by pressing the copy button below and then paste it into your script. Give a short name to this library so you can refer to it later on. The import statement should look like this:
import jason5480/chrono_utils/2 as chr
To check if a future bar will be inside a window first of all you have to initialize a DateTimeWindow object.
A code example is the following:
var dateTimeWindow = chr.DateTimeWindow.new().init(fromDateTime = timestamp('01 Jan 2023 00:00'), toDateTime = timestamp('01 Jan 2024 00:00'))
Then you have to "ask" the dateTimeWindow if the future bar defined by an offset (default is 1 that corresponds th the next bar), will be inside that window:
// Filter bars outside of the datetime window
bool dateFilterApproval = dateTimeWindow.is_bar_included()
You can visualize the result by drawing the background of the bars that are outside the given window:
bgcolor(color = dateFilterApproval ? na : color.new(color.fuchsia, 90), offset = 1, title = 'Datetime Window Filter')
In the same way, you can "ask" the Session if the future bar defined by an offset it will be inside that session.
First of all, you should initialize a Session object.
A code example is the following:
var sess = chr.Session.new().from_sess_string(sess = '0800-1700:23456', refTimezone = 'UTC')
Then check if the given bar defined by the offset (default is 1 that corresponds th the next bar), will be inside the session like that:
// Filter bars outside the sessions
bool sessionFilterApproval = view.sess.is_bar_included()
You can visualize the result by drawing the background of the bars that are outside the given session:
bgcolor(color = sessionFilterApproval ? na : color.new(color.red, 90), offset = 1, title = 'Session Filter')
In case you want to visualize multiple session ranges you can create a SessionView object like that:
var view = SessionView.new().init(SessionDays.new().from_sess_string('2345'), array.from(SessionTimeRange.new().from_sess_string('0800-1600'), SessionTimeRange.new().from_sess_string('1300-2200')), array.from('London', 'New York'), array.from(color.blue, color.orange))
and then call the draw method of the SessionView object like that:
view.draw()
🏋️♂️ Please refer to the "EXAMPLE DATETIME WINDOW FILTER" and "EXAMPLE SESSION FILTER" regions of the script for more advanced code examples of how to utilize the full potential of this library, including user input settings and advanced visualization!
⚠️ Caveats
As I mentioned in the description there are some cases that the prediction of the next bar is not accurate. A wrong prediction will affect the outcome of the filtering. The main reasons this could happen are the following:
Public holidays when the market is closed
Half trading days usually before public holidays
Change in the daylight saving time (DST)
A data anomaly of the chart, where there are missing and/or inconsistent data.
A bug in this library (Please report by PM sending the symbol, timeframe, and settings)
Special thanks to @robbatt and @skinra for the constructive feedback 🏆. Without them, the exposed API of this library would be very lengthy and complicated to use. Thanks to them, now the user of this library will be able to get the most, with only a few lines of code!

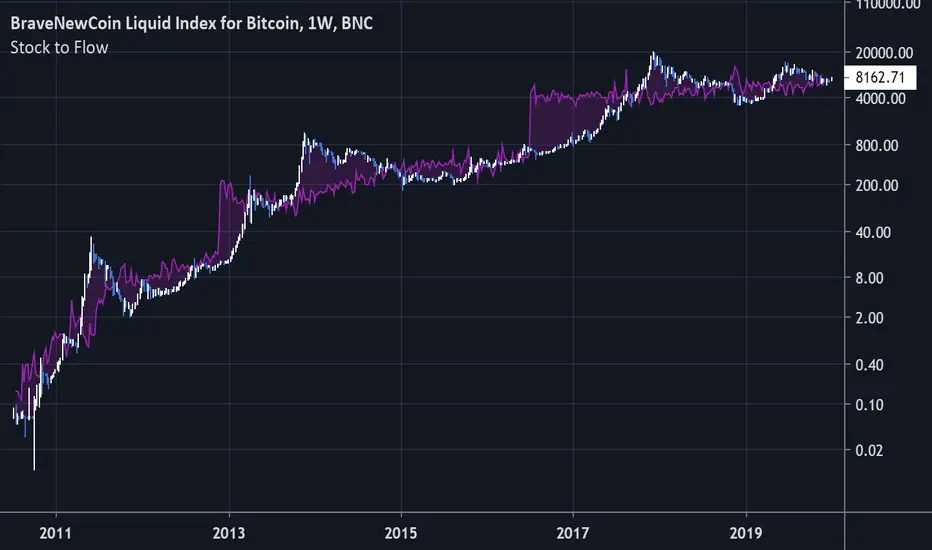
Bitcoin Stock to FlowModeling Bitcoin's Value With Scarcity
The Stock to Flow model for Bitcoin suggests that Bitcoin price is driven by scarcity over time.
Bitcoin is the first scarce digital object the world has ever seen. It is scarce like silver & gold, and can be sent over the internet, radio, satellite etc. Bitcoin includes a mathematical mechanism to restrict its supply over time making it more rare as time goes on. Digital Scarcity.
In 2017 BTC exceeded the market capitalization of Silver. After the next halving in 2024, Bitcoin will become the hardest asset the world has ever seen, rarer than Gold.
There is only enough Bitcoin in the world for each person to own .0023 BTC. Because of this, Bitcoin's value should continue to rise over time.