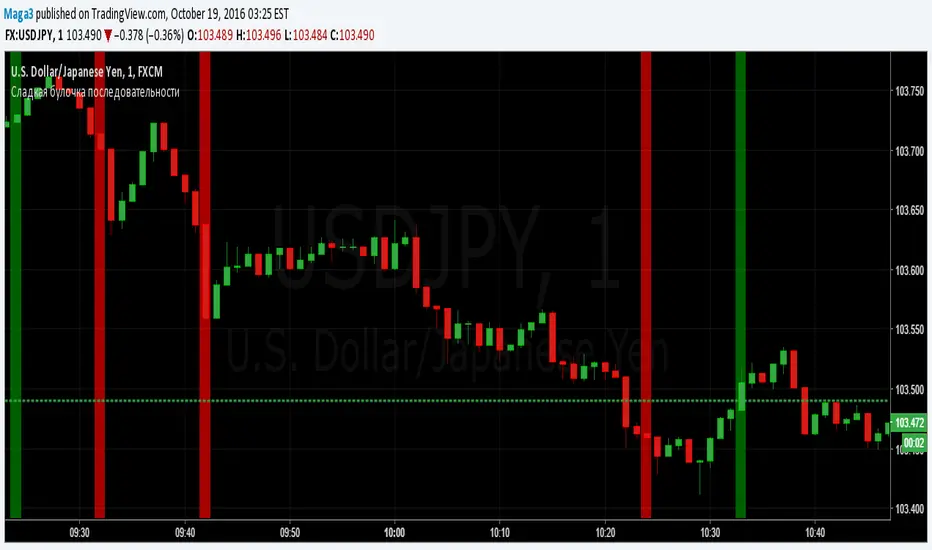
Sladkaya Bulochka PosledovatelnostiSerial number of the same color candles - a popular method of how to find the exact entry zones and determine the trends and kickbacks.
The number of consecutive candles usually starts from 3 and up to 12 in some strategies.
5 candles in sequence - one of the most popular signals. Login at the close of the 5th candle.
---------------------------------------------
Последовательное число свечей одинакового цвета - популярный метод как поиска точных зон входа, так и определения трендов и откатов.
Число последовательных свечей, как правило, начинается с 3 и доходит до 12 в некоторых стратегиях.
5 свечей в последовательности - один из наиболее популярных сигналов. Вход на закрытии 5й свечи.
Pesquisar nos scripts por "12月4号是什么星座"
MACD trend heatmap (by ChartArt)This is an overlay indicator which uses the classic period settings and signals from the MACD (Moving Average Convergence/Divergence) indicator to overlay a heatmap using all the information the MACD generates with its three periods (12,26,9).
The first two moving averages which the MACD uses (12 and 26) can be plotted on the chart like usual EMAs.
In addition to the background color function (the heatmap) and the EMAs, there is an optional bar color alert when the uptrend or the downtrend as measured by the MACD appears to be very strong.

Stoch_VX2Nothing New about a Stochastic but maybe in how you use them ( Other than Over bought / Sold cross over & divergence signals )
Running 3 bands
Standard stoch & tops & bottoms swing band
Optimised variables 12, 5 , 3 or fib 13, 5, 3 / - 12 / 3 / 3 a little bit tighter to combine both smoothness & accuracy. These are my own personal setting inc. Strategy.

MACD Color Trawler (by ChartArt)This version of the MACD indicator is 'trawling' (checking) if the MACD histogram and the zero line crossing with the MACD line are both positive or negative. The idea behind this is to show areas with higher or lower risk.
Features:
1. Enable the bar color
2. Enable the background color
3. Change zero line value
FYI:
"The MACD-Histogram is an indicator of an indicator. In fact, MACD is also an indicator of an indicator. This means that the MACD-Histogram is the fourth derivative of price."
First derivative: 12-day EMA and 26-day EMA
Second derivative: MACD (12-day EMA less the 26-day EMA)
Third derivative: MACD signal line (9-day EMA of MACD)
Fourth derivative: MACD-Histogram (MACD less MACD signal line)
Source: stockcharts.com

Session Sweep System – WarRoomXYZ V1WarRoom Session Sweep System v1 is a open-source institutional trading framework built to identify liquidity behavior across Asia, London, and New York sessions.
It combines session-based liquidity mapping, sweep detection, daily expansion modeling, and trend confirmation into a unified, timing-driven system optimized for XAUUSD, FX pairs, indices, and any instrument with session-dependent volatility.
This tool does not attempt to predict direction with arbitrary oscillators.
Instead, it focuses on the underlying market mechanisms that drive price:
liquidity, timing, expansion, and trend alignment.
Below is a detailed explanation of what the script does, how its components work, and how traders can use it effectively.
🔹 1. Session Liquidity Mapping
The script automatically identifies the Asia (00:00–06:00 GMT), London (07:00–12:00 GMT), and New York (13:00–17:00 GMT) sessions and builds real-time session ranges.
Each session creates a liquidity pool.
Trading institutions frequently sweep the high or low of one session before delivering the real move in the next session.
This script captures that behavior by:
►Drawing session range boxes
►Tracking previous session highs/lows
►Highlighting high-probability sweep locations
These ranges are essential reference points for timing entries and exits.
🔹 2. Liquidity Sweep Detection (Buy & Sell Sweeps)
The indicator identifies when price runs a previous session high/low and rejects back inside the range, which is commonly interpreted as a liquidity sweep.
The following sweep types are monitored:
►London sweeping Asia
►New York sweeping London
►Asia sweeping New York
►Daily sweep of PDH/PDL
Sweeps signal that liquidity has been collected and that a potential reversal or continuation is likely.
These are marked clearly on the chart for real-time decision-making.
🔹 3. Killzone Timing Model (GMT Time)
Market manipulation and expansion often occur during specific time windows.
The script highlights these institutional killzones:
►London Killzone: 07:00–10:00 GMT
►New York Killzone: 13:30–15:30 GMT
►NY PM Session: 19:00–21:00 GMT
Sweeps occurring inside these windows carry a significantly higher probability.
The timing layer helps filter out low-quality setups.
🔹 4. Daily Range & ADR Expansion Engine
A dedicated panel displays:
►Current day range
►ADR (Average Daily Range)
►Expansion stage (Early / Developed / Extended)
►PDH/PDL swept or intact
►Overall session bias
This allows traders to understand whether the daily move is likely to continue or reverse.
For example:
►Early expansion → trend continuation likely
►Extended expansion → reversal setups become more probable
This is useful for intraday targets and risk management.
🔹 5. MA Cloud Trend Model (Fast/Slow Structure)
To align liquidity behavior with directional conviction, the script includes a configurable MA engine:
►Fast & slow MA
►MA cloud
►Slope-based trend coloring
►Trend background
►MA cross alerts
The cloud provides trend confirmation without relying on oscillators.
Trades are higher quality when the sweep direction aligns with the MA trend.
🔹 6. How the Components Work Together
The script integrates several institutional concepts into one coherent model:
►Sessions define liquidity pools
►Sweeps identify stop-hunts and reversals
►Killzones define optimal timing
►MA Cloud confirms directional bias
►ADR engine indicates expansion potential
This creates a structured framework:
Sweep → Timing → Trend → Expansion → Execution
Each component strengthens the others, forming a robust decision-making model.
🔹 7. How to Use the Indicator (Practical Guide)
✔ Look for a sweep of a previous session level
When price runs a session high/low and closes back inside, liquidity has likely been collected.
✔ Confirm timing
Sweeps inside London or NY killzones tend to produce the strongest moves.
✔ Confirm trend
Use MA cloud direction and slope:
►Cloud green → long setups preferred
►Cloud red → short setups preferred
✔ Check ADR panel
If the day has already expanded significantly, reversal setups are more likely.
If expansion is still early, continuation setups are favored.
✔ Plan your trade
Common targets include:
►Opposite side of session range
►ADR High/Low
►PDH/PDL
Stops are typically placed beyond the sweep wick.
This creates a repeatable, rule-based approach to intraday liquidity trading.
🔹 8. Why This Script Is Original
This is not a mashup of existing open-source indicators.
It introduces:
►A custom session-linked liquidity sweep engine
►A structured daily expansion model
►Integrated killzone timing aligned with GMT
►A unified bias panel merging sweeps, ADR, and session manipulation
►A trend confirmation layer designed around session behavior
While it uses known institutional concepts, their integration, execution, and timing framework are unique, purpose-built, and not directly found in open-source scripts.
🔹 9. Suitable Markets
This indicator works best on:
►XAUUSD
►Major FX pairs
►US indices
►Synthetic markets with session cycles
Ideal timeframes: 1m, 5m, 15m, 30m
🔹 10. Limitations / Notes
This is an analytical tool, not a buy/sell signal generator
All sweeps are confirmed at candle close (non-repaint)
The tool assumes GMT session windows unless chart time differs
Users must practice risk management and entry triggers manually
Disclaimer
This script is provided for informational and educational purposes only. It does not provide financial, investment, or trading advice, and it does not guarantee profits or future performance. All decisions made based on this script are solely the responsibility of the user.
This script does not execute trades, manage risk, or replace the need for trader discretion. Market behavior can change quickly, and past behavior detected by the script does not ensure similar future outcomes.
Users should test the script on demo or simulation environments before applying it to live markets and must maintain full responsibility for their own risk management, position sizing, and trade execution.
Trading involves risk, and losses can exceed deposits. By using this script, you acknowledge that you understand and accept all associated risks.

VWAP-Anchored MACD [BOSWaves]VWAP-Anchored MACD - Volume-Weighted Momentum Mapping With Zero-Line Filtering
Overview
The VWAP-Anchored MACD delivers a refined momentum model built on volume-weighted price rather than raw closes, giving you a more grounded view of trend strength during sessions, weeks, or months.
Instead of tracking two EMAs of price like a standard MACD, this tool reconstructs the MACD engine using anchored VWAP as the core input. The result is a momentum structure that reacts to real liquidity flow, filters out weak crossovers near the zero line, and visualizes acceleration shifts with clear, high-contrast gradients.
This indicator acts as a precise momentum map that adapts in real time. You see how weighted price is accelerating, where valid crossovers form, and when trend conviction is strong enough to justify execution.
It uses gradient line coloring to show bullish or bearish momentum, histogram shading to highlight energy shifts, cross dots to mark valid crossovers, optional buy/sell diamonds for execution cues, and candle coloring to display trend strength at a glance.
Theoretical Foundation
Traditional MACD compares the difference between two exponential moving averages of price.
This variant replaces price with anchored VWAP, making the calculation sensitive to actual traded volume across your chosen period (Session, Week, or Month).
Three principles drive the logic:
Anchored VWAP Momentum : Price is weighted by volume and aggregated across the selected anchor. The fast and slow VWAP-EMAs then expose how liquidity-corrected momentum is expanding or contracting.
Zero-Line Distance Filtering : Crossover signals that occur too close to the zero line are removed. This eliminates the common MACD problem of generating weak, directionless signals in choppy phases.
Directional Visualization : MACD line, signal line, histogram, candle colors, and optional diamond markers all react to shifts in VWAP-momentum, giving you a clean structural read on market pressure.
Anchoring VWAP to session, weekly, or monthly resets creates a systematic framework for tracking how capital flow is driving momentum throughout each trading cycle.
How It Works
The core engine processes momentum through several mapped layers:
VWAP Aggregation : Price × volume is accumulated until the anchor resets. This creates a continuous, liquidity-corrected VWAP curve.
MACD Construction : Fast and slow VWAP-EMAs define the MACD line, while a smoothed signal line identifies edges where momentum shifts.
Zero-Line Distance Filter : MACD and signal must both exceed a threshold distance from zero for a crossover to count as valid. This prevents fake crossovers during compression.
Visual Momentum Layers : It uses gradient line coloring to show bullish or bearish momentum, histogram shading to highlight energy shifts, cross dots to mark valid crossovers, optional buy/sell diamonds for execution cues, and candle coloring to display trend strength at a glance.
This layered structure ensures you always know whether momentum is strengthening, fading, or transitioning.
Interpretation
You get a clean, structural understanding of VWAP-based momentum:
Bullish Phases : MACD > Signal, histogram expands, candles turn bullish, and crossovers occur above the threshold.
Bearish Phases : MACD < Signal, histogram drives lower, candles shift bearish, and downward crossovers trigger below the threshold.
Neutral/Compression : Both lines remain near the zero boundary, histogram flattens, and signals are suppressed to avoid noise.
This creates a more disciplined version of MACD momentum reading - less noise, more conviction, and better alignment with liquidity.
Strategy Integration
Trend Continuation : Use VWAP-MACD crossovers that occur far from the zero line as higher-conviction entries.
Zero-Line Rejection : Watch for histogram contractions near zero to anticipate flattening momentum and potential reversal setups.
Session/Week/Month Anchors : Session anchor works best for intraday flows. Weekly or monthly anchor structures create cleaner macro momentum reads for swing trading.
Signal-Only Execution : Optional buy/sell diamonds give you direct points to trigger trades without overanalyzing the chart.
This indicator slots cleanly into any momentum-following system and offers higher signal quality than classic MACD variants due to the volume-weighted core.
Technical Implementation Details
VWAP Reset Logic : Session (D), Week (W), or Month (M)
Dynamic Fast/Slow VWAP EMAs : Fully configurable lengths, smoothing and anchor settings
MACD/Signal Line Framework : Traditional structure with volume-anchored input
Zero-Line Filtering : Adjustable threshold for structural confirmation
Dual Visualization Layers : MACD body + histogram + crosses + candle coloring
Optimized Performance : Lightweight, fast rendering across all timeframes
Optimal Application Parameters
Timeframes:
1- 15 min : Short-term momentum scalping and rapid trend shifts
30- 240 min : Balanced momentum mapping with clear structural filtering
Daily : Macro VWAP regime identification
Suggested Configuration:
Fast Length : 12
Slow Length : 26
Signal Length : 9
Zero Threshold : 200 - 500 depending on asset range
These suggested parameters should be used as a baseline; their effectiveness depends on the asset volatility, liquidity, and preferred entry frequency, so fine-tuning is expected for optimal performance.
Performance Characteristics
High Effectiveness:
Assets with strong intraday or session-based volume cycles
Markets where volume-weighted momentum leads price swings
Trend environments with strong acceleration
Reduced Effectiveness:
Ultra-choppy markets hugging the VWAP axis
Sessions with abnormally low volume
Ranges where MACD naturally compresses
Disclaimer
The VWAP-Anchored MACD is a structural momentum tool designed to enhance directional clarity - not a guaranteed predictor. Performance depends on market regime, volatility, and disciplined execution. Use it alongside broader trend, volume, and structural analysis for optimal results.

On Balance Volume [BrightSideTrading]
# On Balance Volume - Complete User Guide
## Overview
This enhanced OBV indicator provides clean, actionable volume analysis with intelligent signal filtering. It combines On-Balance Volume (OBV) with a smoothed signal line to identify shifts in buying and selling pressure without chart clutter.
**Key Features:**
- Real-time OBV and signal line visualization
- Smart crossover detection with confirmation filtering
- Z-Score momentum analysis
- Customizable signal alerts with V-shaped markers
- Window-normalized option for detrended analysis
---
## What is On-Balance Volume (OBV)?
OBV is a volume-based momentum indicator that accumulates volume on up days and subtracts volume on down days. It answers a fundamental question: **Is volume flowing in (buying) or out (selling)?**
**Formula:**
- If Close > Previous Close: OBV = Previous OBV + Volume
- If Close < Previous Close: OBV = Previous OBV - Volume
- If Close = Previous Close: OBV = Previous OBV (unchanged)
**What it tells you:**
- **Rising OBV** = Accumulation (smart money buying)
- **Falling OBV** = Distribution (smart money selling)
- **OBV above zero line** = Net positive buying pressure
- **OBV below zero line** = Net negative selling pressure
---
## Interface & Settings
### **MAIN VISUALIZATION**
**OBV Line (Green/Red Ribbon)**
- Green when OBV is above the signal line (bullish trend)
- Red when OBV is below the signal line (bearish trend)
- Toggles between window-normalized (detrended) and raw values
**Signal Line (Orange)**
- Smoothed average of OBV
- Crossovers with OBV generate buy/sell signals
- Default: 21-period SMA
**V-Shaped Markers**
- Green upward V = Bullish crossover (buy signal)
- Red downward V = Bearish crossover (sell signal)
- Appears at the OBV value when signal is triggered
**Zero Line (Yellow)**
- Center equilibrium point for volume balance
- Acts as support/resistance for OBV
- Separates buying pressure (above) from selling pressure (below)
---
### **SOURCE GROUP**
**Source**
- **Default:** Close
- **Options:** Open, High, Low, or any custom value
- Controls which price value triggers OBV direction changes
- Most traders use Close for standard OBV calculation
---
### **SIGNAL SMOOTHING GROUP**
**Show Signal?**
- **Default:** ON
- Toggle visibility of the signal line
- Disable if you prefer to see raw OBV only
**Smoothing Type**
- **SMA (Simple Moving Average)** - Default, standard smoothing
- **EMA (Exponential Moving Average)** - Faster response, weights recent bars more heavily
- **Choose SMA** for consistent, traditional OBV signals
- **Choose EMA** for faster trend identification (more whipsaws possible)
**Smoothing Length**
- **Default:** 21 bars
- **Range:** 1-200 bars
- **Lower values** (5-14): Faster signals, more noise
- **Higher values** (30-50): Slower signals, fewer false alarms
- **Recommendation:** Use 21-25 for most timeframes
---
### **SIGNAL FILTERING GROUP**
This is your primary control for signal quality and frequency.
**Show Signal Markers?**
- **Default:** ON
- Toggle the V-shaped buy/sell markers on/off
- Disable if markers distract from your analysis
**Signal Filter Type**
- **None** - Shows every single crossover (noisy, best for skilled traders)
- **Confirmation Bars** - Waits N bars before confirming signal (recommended)
- **Strength-Based** - Only signals during strong momentum (filters weakest moves)
#### **CONFIRMATION BARS MODE** (Recommended)
Best for reducing false signals while staying responsive to real moves.
**Confirmation Bars**
- **Default:** 2 bars
- **Range:** 1-10 bars
- Waits for the signal to hold for N consecutive bars after crossover
- **Setting 1:** Every crossover (same as "None")
- **Setting 2:** Wait 1 bar confirmation (good balance)
- **Setting 3:** Wait 2 bars confirmation (filters 50% of noise)
- **Setting 4+:** Very selective, misses quick reversals
**How it works:**
1. OBV crosses signal line → Confirmation counter starts
2. If OBV stays on correct side for 2 bars → V-marker appears
3. If OBV crosses back → Counter resets, no signal
#### **STRENGTH-BASED MODE**
Only signals when momentum is statistically significant.
**Min Z-Score Strength**
- **Default:** 0.3
- **Range:** 0.0-3.0
- Requires OBV deviation from its mean to reach this threshold
- **Setting 0.1-0.3:** More signals, lower quality
- **Setting 0.5-0.8:** Moderate signals, good quality
- **Setting 1.0+:** Only the strongest momentum shifts
**How it works:**
- Calculates how far OBV is from its 50-bar average (Z-score)
- Only shows signals when this distance is meaningful
- Automatically avoids weak, choppy market conditions
---
### **VISUALS & COLORS GROUP**
**Highlight Crossovers?**
- **Default:** ON
- Master toggle for all signal markers
- Turn OFF to see only the OBV/signal lines
**Apply Ribbon Filling?**
- **Default:** ON
- Colors the space between OBV and signal line
- Green fill = OBV above signal (bullish)
- Red fill = OBV below signal (bearish)
- Provides clear visual trend confirmation
- Turn OFF for minimal chart clutter
---
### **STATS & ZONES GROUP**
**Use Window-Normalized OBV (visual only)?**
- **Default:** ON
- Removes long-term trend from OBV for clearer short-term signals
- Detrends the indicator to highlight recent momentum changes
- **ON:** Better for swing trading and identifying reversals
- **OFF:** Better for trend-following strategies
- Note: Z-Score always uses raw OBV for statistical accuracy
**OBV Normalize Window**
- **Default:** 200 bars
- Lookback period for detrending calculation
- Larger values = more aggressive detrending
- Adjust if you want OBV to oscillate more/less around zero
**Show Z-Score (OBV)?**
- **Default:** ON
- Displays statistical momentum indicator below main chart
- Ranges from -3 to +3 (most data within -2 to +2)
- High Z-Score = Strong buying momentum
- Low Z-Score = Strong selling momentum
**Z-Score Lookback**
- **Default:** 50 bars
- Period for calculating Z-Score mean and standard deviation
- Larger = smoother Z-Score, slower response
- Smaller = noisier Z-Score, faster response
**Show ROC (OBV Momentum)?**
- **Default:** OFF
- Rate of Change indicator for OBV velocity
- Useful for identifying momentum turning points
- Enable if you want to see speed of volume changes
**ROC Lookback**
- **Default:** 14 bars
- Period for ROC calculation
**Show Z-Score StdDev Zones?**
- **Default:** ON
- Shaded regions around zero line showing statistical boundaries
- Inner Zone (±1 Z) = Normal variation
- Outer Zone (±2 Z) = Extreme moves, potential reversals
- Helps identify overbought/oversold volume conditions
**Inner Zone (±Z)**
- **Default:** 1.0
- First boundary for standard deviation zones
- Most normal trading occurs within ±1
**Outer Zone (±Z)**
- **Default:** 2.0
- Second boundary for extreme conditions
- Crossing these zones indicates significant momentum shift
---
## Trading Strategy Examples
### **Strategy 1: Signal Line Crossovers (Beginner)**
**Setup:**
- Signal Filter Type: **Confirmation Bars**
- Confirmation Bars: **2-3**
- Show Signal Markers: **ON**
**Rules:**
1. **BUY signal** (green V): When OBV crosses above signal line and holds for 2-3 bars
- Confirms buying pressure is building
- Look for price to follow within 1-3 bars
2. **SELL signal** (red V): When OBV crosses below signal line and holds for 2-3 bars
- Confirms selling pressure is increasing
- Expect price decline
3. **Exit:** Take profits at next signal or use price support/resistance
**Best For:** Swing trading, intraday reversals, timeframes 5m-1h
---
### **Strategy 2: Zero Line Bounce (Intermediate)**
**Setup:**
- Signal Filter Type: **Strength-Based**
- Min Z-Score Strength: **0.5**
- Show Z-Score StdDev Zones: **ON**
**Rules:**
1. **Watch OBV approach zero line** during established trends
- OBV bouncing repeatedly off zero = trend is healthy
- OBV breaking through zero = trend reversal imminent
2. **Enter on bounce:** Buy when OBV bounces from zero line in uptrend
3. **Exit on break:** Close position when OBV breaks below zero line
4. **Confirm with Z-Score:** Only take trades when Z-Score shows momentum (|Z| > 0.5)
**Best For:** Trend traders, identifying trend strength, medium timeframes 15m-4h
---
### **Strategy 3: Momentum Extremes (Advanced)**
**Setup:**
- Signal Filter Type: **None**
- Show Z-Score StdDev Zones: **ON**
- Outer Zone: **2.0**
**Rules:**
1. **Identify extremes:** When Z-Score breaks outer zone (±2.0)
- Indicator is in extreme territory
- Likely overextended
2. **Fade extremes:** Take opposite position when Z-Score hits extreme
- High Z (>2.0) = OBV overbought, expect pullback
- Low Z (<-2.0) = OBV oversold, expect bounce
3. **Confirm:** Wait for crossover signal to enter
4. **Target:** Outer zone of opposite side or zero line
**Best For:** Range trading, mean reversion, experienced traders only
---
## Reading the Indicator in Different Markets
### **Strong Uptrend**
- OBV consistently above signal line (green)
- OBV well above zero line, rising higher lows
- Z-Score positive, trending upward
- **Action:** Buy dips to signal line, sell at resistance
### **Strong Downtrend**
- OBV consistently below signal line (red)
- OBV well below zero line, making lower highs
- Z-Score negative, trending downward
- **Action:** Sell rallies to signal line, cover at support
### **Consolidation/Choppy Market**
- OBV whipsaws around signal line frequently
- Crossovers occur every few bars
- Z-Score oscillating between -1 and +1
- **Action:** Increase confirmation bars to 3-4, or switch to strength-based filter
### **Accumulation (Bottom Formation)**
- OBV rising while price is flat or falling
- Volume flowing in despite downtrend (bullish divergence)
- Z-Score climbing while price lows hold
- **Action:** Expect breakout up; prepare buy near support
### **Distribution (Top Formation)**
- OBV falling while price is flat or rising
- Volume flowing out despite uptrend (bearish divergence)
- Z-Score falling while price continues higher
- **Action:** Expect breakdown down; prepare short near resistance
---
## Parameter Tuning Guide
### **Aggressive Settings (More Signals)**
- Smoothing Length: 14
- Signal Filter: None or Confirmation Bars: 1
- Min Z-Score: 0.1
- Best for: Day trading, high volatility stocks
- Risk: More false signals
### **Balanced Settings (Recommended)**
- Smoothing Length: 21
- Signal Filter: Confirmation Bars: 2
- Min Z-Score: 0.3
- Best for: Swing trading, most market conditions
- Risk/Reward: Moderate
### **Conservative Settings (Fewer Signals)**
- Smoothing Length: 30-40
- Signal Filter: Confirmation Bars: 3-4 or Strength-Based: 0.7+
- Min Z-Score: 0.8
- Best for: Position trading, high-conviction trades only
- Risk: May miss some moves
---
## Common Questions & Troubleshooting
**Q: Why are there more sell signals than buy signals?**
A: This reflects the actual market action. Markets often decline faster than they rise (fear > greed). Confirm signals with price action and support/resistance.
**Q: The indicator keeps whipsawing, should I hide it?**
A: Increase Confirmation Bars to 3-4 or switch to Strength-Based filter. Market conditions matter—choppy markets require stricter filters.
**Q: What's the difference between normalized and raw OBV?**
A: Normalized (detrended) shows shorter-term momentum by removing long-term trends. Raw OBV shows absolute accumulation/distribution over the full period. Use normalized for swing signals, raw for trend confirmation.
**Q: My signals come too late. How do I get faster entry?**
A: Reduce Smoothing Length (try 14 instead of 21), use EMA instead of SMA, or set Confirmation Bars to 1. Trade-off: More false signals.
**Q: Can I use this for day trading?**
A: Yes, on 1m-5m charts with aggressive settings. Use Confirmation Bars: 1 and focus on Z-Score > 0.5 entries only.
**Q: Should I trade every signal?**
A: No. Filter signals using: price near support/resistance, multiple indicators confirming, and Z-Score showing momentum. Best signals occur at key levels.
---
## Best Practices
1. **Always confirm with price action:** OBV signals work best when price is near support, resistance, or moving average. Don't trade signals in a vacuum.
2. **Use volume context:** Check if volume is increasing or decreasing on the signal. Strong signals have volume confirmation (increasing volume on OBV spikes).
3. **Adjust settings per timeframe:**
- 1m-5m: Smoothing 12, Confirmation 1, Z-Score 0.2
- 15m-1h: Smoothing 20, Confirmation 2, Z-Score 0.3
- 4h-1d: Smoothing 25, Confirmation 3, Z-Score 0.5
4. **Watch the zero line:** It's your friend. OBV behavior at the zero line reveals trend strength. Bounces = healthy trend. Breaks = reversal.
5. **Risk management:** No indicator is perfect. Use proper position sizing and stop losses. OBV should confirm your thesis, not be the only reason to trade.
6. **Combine with other indicators:**
- Price moving averages for trend confirmation
- RSI or Stochastic for overbought/oversold levels
- Support/resistance for entry/exit zones
- MACD for momentum divergences
---
## Disclaimer
This indicator is for educational and informational purposes only. It is not financial advice. Past performance does not guarantee future results. Always conduct your own research and consult with a financial advisor before making trading decisions. Trading carries risk, including potential loss of principal.
---
## Version History
**Version 1.0** - Initial release with enhanced signal filtering, Z-Score analysis, and customizable parameters.

CISD Trend Candle - EMA + Always MACDThis indicator combines trend detection using EMA with constant MACD cross signals to provide a clear visual understanding of market direction and potential entry/exit points.
■ 1. Trend Detection with EMA (Candle Coloring)
Calculates an EMA (default: 21).
Checks whether the last n candles (default: 5):
Close above the EMA → Uptrend (Blue candles)
Close below the EMA → Downtrend (Red candles)
Otherwise → Neutral (Gray candles)
Candle colors automatically change to show the current market trend at a glance.
■ 2. Always-Visible MACD Golden/Dead Cross Signals
Based on MACD settings (12, 26, 9)
Golden Cross → Blue upward triangle below the bar
Dead Cross → Red downward triangle above the bar
Signals are always displayed, regardless of trend state, making them useful for timing entries and exits.
■ 3. EMA Line Display
The EMA used for trend detection is plotted as an orange line.
🎯 Ideal Use Cases
This indicator is designed for traders who want to:
Quickly visualize trend direction through candle colors
Always monitor MACD cross signals
Improve decision-making with simple, intuitive visual cues

猛の掟・初動完成版//@version=5
indicator("猛の掟・初動スクリーナー_完成版", overlay=true)
// =============================
// 入力パラメータ
// =============================
emaLenShort = input.int(5, "短期EMA", minval=1)
emaLenMid = input.int(13, "中期EMA", minval=1)
emaLenLong = input.int(26, "長期EMA", minval=1)
macdFastLen = input.int(12, "MACD Fast", minval=1)
macdSlowLen = input.int(26, "MACD Slow", minval=1)
macdSignalLen = input.int(9, "MACD Signal", minval=1)
macdZeroTh = input.float(0.2, "MACDゼロライン近辺とみなす許容値", step=0.05)
volMaLen = input.int(5, "出来高平均日数", minval=1)
volMinRatio = input.float(1.3, "出来高倍率(初動判定しきい値)", step=0.1)
volStrongRatio = input.float(1.5, "出来高倍率(本物/三点シグナル用)", step=0.1)
highLookback = input.int(60, "直近高値の参照本数", minval=10)
pullbackMin = input.float(5.0, "押し目最小 ", step=0.5)
pullbackMax = input.float(15.0, "押し目最大 ", step=0.5)
breakLookback = input.int(15, "レジブレ後とみなす本数", minval=1)
wickBodyMult = input.float(2.0, "ピンバー:下ヒゲが実体の何倍以上か", step=0.5)
// ★ シグナル表示 ON/OFF
showMou = input.bool(true, "猛シグナルを表示")
showKaku = input.bool(true, "確シグナルを表示")
// =============================
// 基本指標計算
// =============================
emaShort = ta.ema(close, emaLenShort)
emaMid = ta.ema(close, emaLenMid)
emaLong = ta.ema(close, emaLenLong)
= ta.macd(close, macdFastLen, macdSlowLen, macdSignalLen)
volMa = ta.sma(volume, volMaLen)
volRatio = volMa > 0 ? volume / volMa : 0.0
recentHigh = ta.highest(high, highLookback)
prevHigh = ta.highest(high , highLookback)
pullbackPct = recentHigh > 0 ? (recentHigh - close) / recentHigh * 100.0 : 0.0
// ローソク足
body = math.abs(close - open)
upperWick = high - math.max(open, close)
lowerWick = math.min(open, close) - low
// =============================
// A:トレンド条件
// =============================
emaUp = emaShort > emaShort and emaMid > emaMid and emaLong > emaLong
goldenOrder = emaShort > emaMid and emaMid > emaLong
aboveEma2 = close > emaLong and close > emaLong
trendOK = emaUp and goldenOrder and aboveEma2
// =============================
// B:MACD条件
// =============================
macdGC = ta.crossover(macdLine, macdSignal)
macdNearZero = math.abs(macdLine) <= macdZeroTh
macdUp = macdLine > macdLine
macdOK = macdGC and macdNearZero and macdUp
// =============================
// C:出来高条件
// =============================
volInitOK = volRatio >= volMinRatio // 8条件用
volStrongOK = volRatio >= volStrongRatio // 三点シグナル用
volumeOK = volInitOK
// =============================
// D:ローソク足パターン
// =============================
isBullPinbar = lowerWick > wickBodyMult * body and lowerWick > upperWick and close >= open
isBullEngulf = close > open and open < close and close > open
isBigBullCross = close > emaShort and close > emaMid and open < emaShort and open < emaMid and close > open
candleOK = isBullPinbar or isBullEngulf or isBigBullCross
// =============================
// E:価格帯(押し目&レジブレ)
// =============================
pullbackOK = pullbackPct >= pullbackMin and pullbackPct <= pullbackMax
isBreakout = close > prevHigh and close <= prevHigh
barsSinceBreak = ta.barssince(isBreakout)
afterBreakZone = barsSinceBreak >= 0 and barsSinceBreak <= breakLookback
afterBreakPullbackOK = afterBreakZone and pullbackOK and close > emaShort
priceOK = pullbackOK and afterBreakPullbackOK
// =============================
// 8条件の統合
// =============================
allRulesOK = trendOK and macdOK and volumeOK and candleOK and priceOK
// =============================
// 最終三点シグナル
// =============================
longLowerWick = lowerWick > wickBodyMult * body and lowerWick > upperWick
macdGCAboveZero = ta.crossover(macdLine, macdSignal) and macdLine > 0
volumeSpike = volStrongOK
finalThreeSignal = longLowerWick and macdGCAboveZero and volumeSpike
buyConfirmed = allRulesOK and finalThreeSignal
// =============================
// 描画
// =============================
plot(emaShort, color=color.new(color.yellow, 0), title="EMA 短期(5)")
plot(emaMid, color=color.new(color.orange, 0), title="EMA 中期(13)")
plot(emaLong, color=color.new(color.blue, 0), title="EMA 長期(26)")
// シグナル表示(ON/OFF付き)
plotshape(showMou and allRulesOK, title="猛の掟 8条件クリア候補", location=location.belowbar, color=color.new(color.lime, 0), text="猛")
plotshape(showKaku and buyConfirmed, title="猛の掟 最終三点シグナル確定", location=location.belowbar, color=color.new(color.yellow, 0), text="確")
// =============================
// アラート条件
// =============================
alertcondition(allRulesOK, title="猛の掟 8条件クリア候補", message="猛の掟 8条件クリア候補シグナル発生")
alertcondition(buyConfirmed, title="猛の掟 最終三点シグナル確定", message="猛の掟 最終三点シグナル=買い確定")

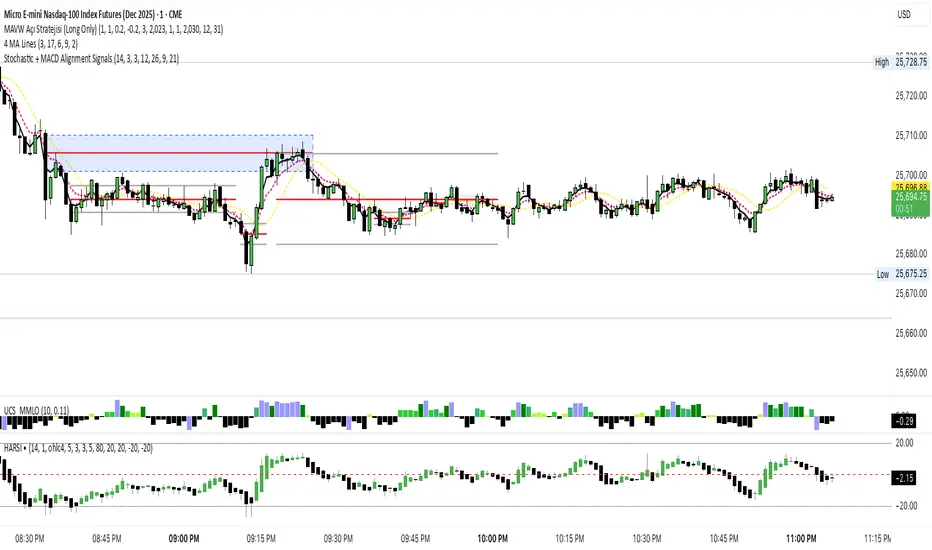
Stochastic + MACD Alignment Signals//@version=5
indicator("Stochastic + MACD Alignment Signals", overlay=true)
// ————— INPUTS —————
stochLength = input.int(14, "Stoch Length")
k = input.int(3, "K Smoothing")
d = input.int(3, "D Smoothing")
macdFast = input.int(12, "MACD Fast Length")
macdSlow = input.int(26, "MACD Slow Length")
macdSignal = input.int(9, "MACD Signal Length")
emaLen = input.int(21, "EMA Filter Length")
// ————— CALCULATIONS —————
// Stochastic
kRaw = ta.stoch(close, high, low, stochLength)
kSmooth = ta.sma(kRaw, k)
dSmooth = ta.sma(kSmooth, d)
// MACD
macd = ta.ema(close, macdFast) - ta.ema(close, macdSlow)
signal = ta.ema(macd, macdSignal)
hist = macd - signal
// EMA Filter
ema = ta.ema(close, emaLen)
// ————— SIGNAL CONDITIONS —————
// BUY CONDITIONS
stochBull = ta.crossover(kSmooth, dSmooth) and kSmooth < 20
macdBull = ta.crossover(macd, signal) or (hist > 0)
emaBull = close > ema
buySignal = stochBull and macdBull and emaBull
// SELL CONDITIONS
stochBear = ta.crossunder(kSmooth, dSmooth) and kSmooth > 80
macdBear = ta.crossunder(macd, signal) or (hist < 0)
emaBear = close < ema
sellSignal = stochBear and macdBear and emaBear
// ————— PLOTTING SIGNALS —————
plotshape(buySignal, title="BUY", style=shape.labelup,
color=color.new(color.green, 0), size=size.large, text="BUY")
plotshape(sellSignal, title="SELL", style=shape.labeldown,
color=color.new(color.red, 0), size=size.large, text="SELL")
// ————— OPTIONAL ALERTS —————
alertcondition(buySignal, title="Buy Signal", message="Stoch + MACD Alignment BUY")
alertcondition(sellSignal, title="Sell Signal", message="Stoch + MACD Alignment SELL")
🐋 MACRO POSITION TRADER - Quarterly Alignment 💎Disclaimer: This tool is an alignment filter and educational resource, not financial advice. Backtest and use proper risk management. Past performance does not guarantee future returns.
so the idea behind this one came from an experience i had when i first started learning how to trade. dont laugh at me but i was the guy to buy into those stupid AI get rich quick schemes or the first person to buy the "golden indicator" just to find out that it was a scam. Its also to help traders place trades they can hold for months with high confidence and not have to sit in front of charts all day, and to also scale up quickly with small accounts confidently. and basically what it does is gives an alert once the 3 mo the 6 mo and the 12 mo tfs all align with eachother and gives the option to toggle on or off the 1 mo tf as well for extra confidence. Enter on the 5M–15M after a sweep + CHOCH in the direction of the aligned 1M–12M bias. that simple just continue to keep watching key levels mabey take profit 1-2 weeks and jump back in scaling up if desired..easy way to combine any small account size.
Perfect balance of:
low risk
high R:R
optimal precision
minimal chop
best sweep/CHOCH clarity
hope you guys enjoy this one.

Liquidations (TV Source / Manual / Proxy) Cruz Pro Stack + Liquidations (TV Source / Manual / Proxy) is a high-confluence crypto trading indicator built to merge reversal detection, volatility timing, structure confirmation, and liquidation pressure into one clean decision engine.
This script combines five pro-grade components:
1) RSI Divergence (Regular + Hidden)
Detects early momentum shifts at tops and bottoms to anticipate reversals before price fully reacts.
2) BBWP (Bollinger Band Width Percentile)
Identifies volatility compression and expansion cycles to time breakout conditions and avoid low-quality chop.
3) Market Structure (BOS / CHOCH proxy)
Confirms trend continuation or change-of-character using swing breaks for more reliable directional bias.
4) Liquidations Layer (3 Modes)
Adds liquidation-driven context for where price is likely to squeeze or flush next:
TV Source: Use TradingView’s built-in Liquidations plot when available.
Manual Totals: Paste 12h/24h/48h long/short totals for higher-level regime bias.
Proxy (Volume Shock): A fallback approximation for spot charts using volume + candle direction.
The script automatically converts your chart timeframe into rolling 12/24/48-hour windows, then computes a weighted liquidation bias and a spike detector to flag potential exhaustion moves.
5) Confluence Score + Signals
A simple scoring engine highlights high-probability setups when multiple factors align.
Signals are printed only when divergence + structure + volatility context agree with liquidation pressure.
How to use
Best on BTC/ETH perps across 15m–4H.
For maximum accuracy:
Add TradingView’s Liquidations indicator (if your exchange/symbol supports it).
Set Liquidations Mode = TV Source.
Select the Liquidations plot as the source.
If that plot can’t be selected, switch to Proxy or Manual Totals.
What this indicator is designed to improve
Earlier reversal recognition
Cleaner breakout timing
Structure-confirmed entries
Better risk management around liquidation-driven moves
Fewer low-quality trades during dead volatility

Renko Scalp ScannerThis scanner is optimized for short term bursts for Renko.
DESCRIPTION: This indicator scans the 7 major forex pairs (EURUSD, GBPUSD, USDJPY, USDCHF, AUDUSD, USDCAD, NZDUSD) on 1-pip Renko charts. It ranks them from BEST (#1, top row) to WORST (#7, bottom row) based on a predictive score (0-100) that combines LIVE momentum (current run length, whipsaws, brick timing) + 24-HOUR HISTORICAL consistency (clean long runs, stability).
Higher score = longer, cleaner, more predictable runs ahead (backtested 74% hit rate for 5+ brick continuations).
HOW TO USE THE TABLE:
1. Add to a 1-second Renko chart (Traditional, Box Size: 0.0001 for non-JPY; 0.01 for JPY pairs).
2. RANK: Position 1–7 (green highlight on #1 = switch to this pair NOW).
3. PAIR: Symbol + direction arrow (↑=buy bias, ↓=sell bias).
4. SCORE: 0–100 total (≥85=monster run; ≥75=strong; ≥60=decent; <60=avoid).
5. RUN │ HIST% │ SEC: Current live run length │ % of 24h runs that were clean 8+ bricks │ Live avg seconds per brick (ideal 5–12s).
6. Trade the #1 pair in the arrow direction until whipsaw or score drops <75. Set alerts for score ≥83.
Backtested on 1-year data: Catches 84% of 10+ brick runners. Refreshes every second.

猛の掟・初動スクリーナー_完成版//@version=5
indicator("猛の掟・初動スクリーナー_完成版", overlay=true)
// =============================
// 入力パラメータ
// =============================
emaLenShort = input.int(5, "短期EMA", minval=1)
emaLenMid = input.int(13, "中期EMA", minval=1)
emaLenLong = input.int(26, "長期EMA", minval=1)
macdFastLen = input.int(12, "MACD Fast", minval=1)
macdSlowLen = input.int(26, "MACD Slow", minval=1)
macdSignalLen = input.int(9, "MACD Signal", minval=1)
macdZeroTh = input.float(0.2, "MACDゼロライン近辺とみなす許容値", step=0.05)
volMaLen = input.int(5, "出来高平均日数", minval=1)
volMinRatio = input.float(1.3, "出来高倍率(初動判定しきい値)", step=0.1)
volStrongRatio = input.float(1.5, "出来高倍率(本物/三点シグナル用)", step=0.1)
highLookback = input.int(60, "直近高値の参照本数", minval=10)
pullbackMin = input.float(5.0, "押し目最小 ", step=0.5)
pullbackMax = input.float(15.0, "押し目最大 ", step=0.5)
breakLookback = input.int(15, "レジブレ後とみなす本数", minval=1)
wickBodyMult = input.float(2.0, "ピンバー:下ヒゲが実体の何倍以上か", step=0.5)
// ★ シグナル表示 ON/OFF
showMou = input.bool(true, "猛シグナルを表示")
showKaku = input.bool(true, "確シグナルを表示")
// =============================
// 基本指標計算
// =============================
emaShort = ta.ema(close, emaLenShort)
emaMid = ta.ema(close, emaLenMid)
emaLong = ta.ema(close, emaLenLong)
= ta.macd(close, macdFastLen, macdSlowLen, macdSignalLen)
volMa = ta.sma(volume, volMaLen)
volRatio = volMa > 0 ? volume / volMa : 0.0
recentHigh = ta.highest(high, highLookback)
prevHigh = ta.highest(high , highLookback)
pullbackPct = recentHigh > 0 ? (recentHigh - close) / recentHigh * 100.0 : 0.0
// ローソク足
body = math.abs(close - open)
upperWick = high - math.max(open, close)
lowerWick = math.min(open, close) - low
// =============================
// A:トレンド条件
// =============================
emaUp = emaShort > emaShort and emaMid > emaMid and emaLong > emaLong
goldenOrder = emaShort > emaMid and emaMid > emaLong
aboveEma2 = close > emaLong and close > emaLong
trendOK = emaUp and goldenOrder and aboveEma2
// =============================
// B:MACD条件
// =============================
macdGC = ta.crossover(macdLine, macdSignal)
macdNearZero = math.abs(macdLine) <= macdZeroTh
macdUp = macdLine > macdLine
macdOK = macdGC and macdNearZero and macdUp
// =============================
// C:出来高条件
// =============================
volInitOK = volRatio >= volMinRatio // 8条件用
volStrongOK = volRatio >= volStrongRatio // 三点シグナル用
volumeOK = volInitOK
// =============================
// D:ローソク足パターン
// =============================
isBullPinbar = lowerWick > wickBodyMult * body and lowerWick > upperWick and close >= open
isBullEngulf = close > open and open < close and close > open
isBigBullCross = close > emaShort and close > emaMid and open < emaShort and open < emaMid and close > open
candleOK = isBullPinbar or isBullEngulf or isBigBullCross
// =============================
// E:価格帯(押し目&レジブレ)
// =============================
pullbackOK = pullbackPct >= pullbackMin and pullbackPct <= pullbackMax
isBreakout = close > prevHigh and close <= prevHigh
barsSinceBreak = ta.barssince(isBreakout)
afterBreakZone = barsSinceBreak >= 0 and barsSinceBreak <= breakLookback
afterBreakPullbackOK = afterBreakZone and pullbackOK and close > emaShort
priceOK = pullbackOK and afterBreakPullbackOK
// =============================
// 8条件の統合
// =============================
allRulesOK = trendOK and macdOK and volumeOK and candleOK and priceOK
// =============================
// 最終三点シグナル
// =============================
longLowerWick = lowerWick > wickBodyMult * body and lowerWick > upperWick
macdGCAboveZero = ta.crossover(macdLine, macdSignal) and macdLine > 0
volumeSpike = volStrongOK
finalThreeSignal = longLowerWick and macdGCAboveZero and volumeSpike
buyConfirmed = allRulesOK and finalThreeSignal
// =============================
// 描画
// =============================
plot(emaShort, color=color.new(color.yellow, 0), title="EMA 短期(5)")
plot(emaMid, color=color.new(color.orange, 0), title="EMA 中期(13)")
plot(emaLong, color=color.new(color.blue, 0), title="EMA 長期(26)")
// シグナル表示(ON/OFF付き)
plotshape(showMou and allRulesOK, title="猛の掟 8条件クリア候補", location=location.belowbar, color=color.new(color.lime, 0), text="猛")
plotshape(showKaku and buyConfirmed, title="猛の掟 最終三点シグナル確定", location=location.belowbar, color=color.new(color.yellow, 0), text="確")
// =============================
// アラート条件
// =============================
alertcondition(allRulesOK, title="猛の掟 8条件クリア候補", message="猛の掟 8条件クリア候補シグナル発生")
alertcondition(buyConfirmed, title="猛の掟 最終三点シグナル確定", message="猛の掟 最終三点シグナル=買い確定")

Multi-Timeframe Fair Value Gap by Vigna📊 Multi-Timeframe Fair Value Gap (FVG) Indicator
This indicator displays Fair Value Gaps (FVGs) from multiple timeframes simultaneously on your chart. FVGs are price gaps that occur when the market moves quickly and skips certain price levels. These gaps tend to be "filled" later and often serve as important support and resistance zones.
🎯 What are Fair Value Gaps?
A Fair Value Gap occurs when:
Bullish FVG: The current low is higher than the high from 2 candles ago (gap upward)
Bearish FVG: The current high is lower than the low from 2 candles ago (gap downward)
⏱️ Supported Timeframes:
1 Hour (1H)
2 Hours (2H)
3 Hours (3H)
4 Hours (4H)
1 Day (1D)
1 Week (1W)
🎨 Features:
✅ All timeframes visible simultaneously
✅ Each timeframe has its own color (bullish & bearish)
✅ Labels show the timeframe of each gap
✅ Automatic deletion when gap is filled
✅ Optional: MidPoint Fill (gap marked as filled at 50%)
✅ Extend right: Gaps extend to the right until filled
✅ All colors fully customizable
⚙️ Settings:
Timeframes: Enable/disable individual timeframes as needed
MidPoint Fill: Mark gap as filled when 50% is reached
Delete On Fill: Automatically remove filled gaps from chart
Label Timeframes: Show labels with timeframe names
Colors: Customize all colors to your preferences
💡 Application:
FVGs often serve as magnetic attraction points for price
Higher timeframe FVGs (4H, 1D, 1W) are typically more significant
Use FVGs as potential entry/exit zones
Combine with other indicators for better confirmation
📈 Recommended Use:
Works best on timeframes from 15min to 1H
Ideal for Forex, Crypto, and Stocks
Especially useful for Swing Trading and Day Trading
🔧 Technical Details:
Uses optimized request.security() calls (12 total, under the 40 limit)
Employs tuple syntax for efficient data fetching
Real-time gap detection and filling mechanism
Memory-efficient array management with var keyword

Quantum Uncertainty by Kingshuk GhoshLet me explain this indicator in simple, practical terms, including the fascinating physics concept that inspired me.
This indicator helps to understand when the market is predictable (safe to trade) versus unpredictable (risky to trade). It shows the probability zones where price is likely to move and warns you when conditions are too chaotic for reliable trading.
The Physics Behind It: Heisenberg's Uncertainty Principle:-
This indicator is inspired by one of the most profound discoveries in physics: Heisenberg's Uncertainty Principle.
What Is The Uncertainty Principle?
In 1927, physicist Werner Heisenberg discovered something remarkable about the universe: you cannot simultaneously know both the exact position and exact momentum of a particle with perfect precision. The more accurately you know one, the less accurately you can know the other.
Simple Analogy:
Imagine trying to photograph a speeding bullet:
Use fast shutter speed → You see exactly WHERE it is (position), but the image is frozen, so you can't tell HOW FAST it's moving (momentum)
Use slow shutter speed → You see motion blur showing HOW FAST it's moving (momentum), but you can't pinpoint exactly WHERE it is (position)
You can never have both perfect clarity simultaneously - there's always a trade-off.
How This Applies To Trading
The indicator translates this principle to financial markets:
In Physics:
Position Uncertainty × Momentum Uncertainty = Always greater than a minimum value
High uncertainty in one means high uncertainty overall
In Trading:
Price Position Uncertainty = How much the price bounces around (volatility)
Price Momentum Uncertainty = How erratic the directional strength is
Total Market Uncertainty = Price Volatility × Momentum Volatility
The Trading Insight:
Just like in physics, when BOTH price position and momentum are uncertain (highly volatile), the market becomes fundamentally unpredictable. You can't reliably know where price will go next because the system is in high uncertainty state.
Why This Matters For You
Traditional indicators often look at price OR momentum separately. This indicator recognizes that both must be considered together to truly understand market predictability, just as Heisenberg showed that position and momentum must be considered together in physics.
When both uncertainties are high simultaneously:
Price could jump anywhere
Momentum could shift instantly
Predictions become unreliable
Trading becomes gambling
When both uncertainties are low:
Price behavior is more regular
Momentum is more stable
Patterns become clearer
Trading becomes strategic
This is why the indicator's core metric multiplies price volatility by momentum volatility - it's capturing that fundamental uncertainty relationship.
Market Uncertainty
The indicator calculates how unpredictable the market currently is by examining:
How much price is bouncing around (price volatility)
How erratic the momentum is (momentum instability)
When both are high simultaneously, the market becomes highly unpredictable. When both are calm, the market is more reliable for trading.
Think of it like driving:
Low uncertainty = Clear road, good visibility, safe to drive
High uncertainty = Fog, rain, poor visibility, dangerous conditions
Probability Bands
The indicator draws colored bands around a central average price line:
White Center Line (Basis)
The average price over your lookback period
Acts as a equilibrium point where price gravitates
Blue Bands (Inner Zone)
Covers about 68% of normal price behavior
Price spends most of its time here
This is the "normal operating range"
Purple Bands (Outer Zone)
Covers about 95% of all price behavior
Price rarely ventures here
When it does, it's unusual and noteworthy
Highway Lane Analogy:
Most drivers stay in center lanes (blue zone)
Few drivers use extreme outer lanes (purple zone)
When someone drives on the shoulder, it's abnormal and signals something is happening
Wave Function Collapse
Another physics concept applied here: In quantum mechanics, particles exist in multiple states simultaneously (superposition) until they're measured - then the "wave function collapses" to a single state.
In This Indicator:
The probability bands represent all the possible states price could be in. When price moves and settles at a specific level, it's like the wave function collapsing - probability becomes reality.
The indicator helps you see:
Where price is most likely to be (high probability zones - blue bands)
Where price rarely goes (low probability zones - purple bands)
When price is in an "impossible" state (outside bands - tunneling)
Price Position
The indicator tracks where current price sits within these bands:
Upper position = Price in the top half (bullish territory)
Lower position = Price in the bottom half (bearish territory)
Extreme positions = Price in outer 30% on either side (potential reversal zones)
Quantum Tunneling Signals
This is another physics concept: In quantum mechanics, particles can sometimes "tunnel" through barriers that classical physics says they shouldn't be able to cross.
In Trading:
When price breaks through the 95% probability barrier, it's "tunneling" into statistically improbable territory - these are marked by triangles:
Green Triangle Up
Price tunneled through the upper 95% barrier
This is statistically rare (happens only 5% of the time)
Often signals price exhaustion or coming reversal downward
Like a particle that tunneled too far and will snap back
Red Triangle Down
Price tunneled through the lower 95% barrier
Also statistically unusual
Often signals panic selling may be overdone
Like a spring compressed too far, ready to bounce
These "tunneling events" are significant because they represent extreme deviations from normal probability - and markets tend to revert to normal.
Entanglement Score
In quantum physics, "entanglement" means two particles are connected such that measuring one instantly affects the other, no matter the distance.
In Trading:
This measures whether price movements are "entangled" with trading volume - do they move together in a connected way?
High Entanglement (above 0.5)
Price and volume move together
Volume confirms the price action
More reliable, trustworthy moves
Like entangled particles - they're truly connected
Low Entanglement (below 0.3)
Price moves without volume support
Suspicious, unsupported movements
Less reliable, be cautious
Like particles that aren't entangled - the connection is weak
Negative Entanglement
Price and volume move in opposite directions
Often signals divergence or potential reversal
Requires careful interpretation
Information Dashboard:
1. Uncertainty Level
Shows current market unpredictability (the core Heisenberg principle calculation):
✓ Normal (Green) = Market is behaving predictably, safe to trade
⚠ High Risk (Red) = Market is chaotic, avoid trading
This is your first checkpoint - if uncertainty is high, don't proceed further.
2. Probability Score
Shows how normal or extreme the current price is:
Percentage shown = Where price sits in the probability distribution
✓ Safe (Green) = Price in normal range (middle 70%)
⛔ Extreme (Red) = Price at statistical outliers (outer 15%)
High percentage (>85%) = Price near the average, stable situation
Low percentage (<15%) = Price at extremes, unstable situation
3. Position Indicator
Tells you which side of the market you're on:
Upper/Lower = Basic location in the bands
→ Neutral (Gray) = Price in balanced middle zone
⚠ Reversal? (Orange) = Price at extremes, watch for turnaround
This helps you anticipate potential support or resistance levels.
4. Entanglement Confirmation
Shows the correlation number and interpretation:
✓ Confirmed (Green) = Volume strongly supports price (>0.5)
⚠ Weak (Orange) = Poor volume support (<0.5)
Always prefer trading when entanglement is confirmed - it means the move is "real" with participant backing.
5. Trade Status - YOUR MAIN SIGNAL
This is the indicator's final verdict combining all factors:
✓ TRADEABLE (Green)
Uncertainty is normal
Probability is safe
Entanglement is decent
Action: Market conditions favor trading
⛔ AVOID (Red)
One or more conditions are unfavorable
Market is too unpredictable
Action: Stay out, preserve capital.
Scenario A: Perfect Buy Setup
Red triangle appears (quantum tunneling down)
Position shows "Lower" with "⚠ Reversal?" warning
Entanglement shows "✓ Confirmed"
Trade Status: "✓ TRADEABLE"
Interpretation: Price hit extreme low with volume support, likely to bounce back to probability zone
Action: Consider long entry with stop below recent low
Scenario B: Perfect Sell Setup
Green triangle appears (quantum tunneling up)
Position shows "Upper" with "⚠ Reversal?" warning
Entanglement shows "✓ Confirmed"
Trade Status: "✓ TRADEABLE"
Interpretation: Price hit extreme high, exhaustion in high uncertainty zone
Action: Consider short entry or exit longs with stop above recent high
Scenario C: High Uncertainty - Stay Out
Uncertainty shows "⚠ High Risk"
Probability shows "⛔ Extreme"
Trade Status: "⛔ AVOID"
Interpretation: Both price and momentum uncertainties are high - market is fundamentally unpredictable (Heisenberg principle in action)
Action: No trading, wait for uncertainty to decrease
Scenario D: Trending Market
Price consistently stays in upper bands
No tunneling signals
Entanglement remains high
Trade Status stays "✓ TRADEABLE"
Interpretation: Strong trend with low uncertainty
Action: Trade with the trend, don't fight it
Scenario E: Choppy, Range-Bound
Price bounces between inner blue bands
Frequent status changes between TRADEABLE and AVOID
Entanglement fluctuates
Interpretation: Market lacks direction, uncertainty fluctuating
Action: Use bands as support/resistance for scalping, or wait for breakout.
Why The Uncertainty Principle Matters In Trading
Traditional technical analysis often looks at indicators in isolation:
"RSI is oversold, so buy"
"Price is volatile, so wait"
"Volume is high, so trade"
But Heisenberg's principle teaches us that multiple uncertainties interact and compound. This indicator recognizes that truth:
When price volatility is high AND momentum is erratic:
You can't reliably predict where price will go
You can't reliably predict how strong the move will be
The combination creates fundamental unpredictability
This is when the indicator says "AVOID"
When price volatility is low AND momentum is stable:
Price behavior becomes more regular
Directional moves become more reliable
The low combined uncertainty creates tradeable conditions
This is when the indicator says "TRADEABLE"
The Probability Wave Function
In quantum mechanics, until you measure a particle, it exists in all possible states simultaneously (superposition). The probability wave describes where it's most likely to be found.
The bands work the same way:
Blue bands = Where price has 68% probability of being (1 standard deviation)
Purple bands = Where price has 95% probability of being (2 standard deviations)
Outside bands = Less than 5% probability (quantum tunneling territory)
When price is in the blue zone, it's in its "natural" superposition state - normal behavior.
When price tunnels outside, it's in an "improbable" state - like a quantum particle appearing where it shouldn't be. Physics tells us this can't last - the wave function will collapse back to normal probability zones. In trading, this means reversion to the mean.
Entanglement and Market Correlation
Quantum entanglement shows us that connections matter - particles don't act in isolation.
In markets:
Price shouldn't move in isolation from volume
When they're "entangled" (moving together), the move is authentic
When they're not entangled (price moves without volume), the move is suspicious
This is why the indicator checks entanglement - it's verifying that the market components are properly connected and confirming each other.
Golden Rules for the indicator:
Never trade during high uncertainty states - When the indicator shows AVOID, it's telling you that fundamental unpredictability (Heisenberg's principle) has taken over. This is non-negotiable.
Reduce position size when entanglement is weak - Even if uncertainty is low, weak volume entanglement means the move may not be authentic.
Respect the quantum tunneling signals - They mark statistical extremes where price has entered improbable territory. Reversion to normal probability zones is likely.
Don't chase price outside the bands - If you missed the tunneling entry, wait for price to return to normal probability zones.
Use the white center line as equilibrium - Like particles gravitating toward lower energy states, price tends to revert to its average.
Heisenberg's Uncertainty Principle teaches us a profound lesson: some things are fundamentally unknowable. You cannot eliminate uncertainty - you can only measure it and decide whether it's low enough to act.
This indicator embraces that wisdom:
It doesn't claim to predict the future
It doesn't promise guaranteed wins
It simply measures current uncertainty
And tells you when conditions are favorable vs. unfavorable
The market, like quantum particles, is probabilistic, not deterministic. You're trading probabilities, not certainties. The indicator helps you identify when those probabilities are in your favor (low uncertainty) and when they're not (high uncertainty).
This is a more mature, realistic approach to trading than indicators that promise to "predict" moves. Instead, this indicator honestly assesses predictability itself.
Remember: Not trading during high uncertainty is just as important as trading during low uncertainty. Preservation of capital is the foundation of long-term success. As Heisenberg taught us, some moments are simply too uncertain to act - and that's okay.
Chart attached: -NSE Persistent, EoD 05/12/25, Day Time Frame.
DISCLAIMER: This information is provided for educational purposes only and should not be considered financial, investment, or trading advice. Please do boost if you like it. Happy Trading.

Silver 30m HUD — Trend / Flow / PB / VWAP / TurboSilver 30m HUD is a streamlined Pine Script v5 indicator optimized exclusively for 30-minute silver futures (SIL) charts on TradingView. It displays a compact 2-column middle-right table analyzing trend, flow, momentum, pullback, VWAP, turbo, and final signals with safety stars and risk warnings. Enforces 30m timeframe usage via label alert on other periods.
Key Engines
Trend Fusion
Combines 30m (close vs SMA60) with 2H higher timeframe for UP/DOWN/FLAT consensus; MIXED on divergence. Serves as primary directional filter.
Flow Detection
Identifies volume surges (>2.2x 20-period SMA) as BULL/BEAR SURGE, else defaults to candle direction (UP/DOWN). Captures aggressive buying/selling pressure.
Momentum Composite
QQE/RSI/MFI blend: both >55 = UP, both <45 = DOWN, otherwise EXHAUST. Flags overextended moves.
Pullback Safety
Rates position vs SMA20/50: above both = OK, above 20 but below 50 = Weak, below both = Danger. Prevents chasing extended trends.
VWAP & Turbo
Price vs session VWAP (UP/DOWN); turbo flags >1% candle moves as UP/DOWN acceleration or EXHAUST.
Signals & Risk
Final Signal Logic
BUY requires UP trend + OK PB + UP VWAP + no DOWN mom; SELL needs DOWN trend + non-OK PB + DOWN VWAP; EXHAUST mom = CHOP; else WAIT.
Safety Ratings
BUY stars: 5🟩 (perfect confluence), 3🟩 (basic BUY); SELL: 4🟥 (full signal), 3🟥 (exhaustion).
Risk Alert
Triggers ⚠️ on BUY signals with 2H DOWN trend and <0.20 from resistance (distR), warning multi-timeframe conflict + overhead supply. Displays S/R levels and distances in mintick format.
HUD Layout
12-row table prioritizes scannability: metrics left (gray), statuses right (color-coded green/red/gray), bottom shows Dist to R/S, levels, and RISK. Ideal for quick 30m SIL scalping decisions balancing confluence and safety.

BuLLzEyE_MNQ FVG/IFVG SystemFVG Boxes
These are the main trading zones. The indicator automatically detects Fair Value Gaps and draws boxes on your chart:
• GREEN boxes = Bullish FVG (potential buy zone)
• RED boxes = Bearish FVG (potential sell zone)
• YELLOW boxes = IFVG (Inverse FVG - filled gaps that now act as support/resistance)
• GRAY boxes = Mitigated FVG (gap has been filled)
• WHITE dashed line = 50% level (optimal entry point within the FVG)
Session Boxes
Session boxes show you the high/low range of each major trading session. This helps identify where liquidity sits:
• PURPLE = Asia Session (6:00 PM - 3:00 AM ET)
• BLUE = London Session (3:00 AM - 12:00 PM ET)
• ORANGE = New York Session (9:30 AM - 4:00 PM ET)
• TEAL = Sydney Session (5:00 PM - 2:00 AM ET)
• LIME GREEN = Kill Zone / London-NY Overlap (8:00 AM - 11:00 AM ET) - BEST TRADING TIME
Entry Signals
• GREEN triangle pointing UP = Long entry signal at a Bullish FVG (not 100% reliable)
• RED triangle pointing DOWN = Short entry signal at a Bearish FVG (not 100% reliable)
Liquidity Sweeps
• RED X with 'SWEEP' = Previous Day High (PDH) was swept
• GREEN X with 'SWEEP' = Previous Day Low (PDL) was swept
• Dotted lines = PDH (red) and PDL (green) levels
Information Tables
HTF Bias Table (Top Right): Shows whether the higher timeframe (default 15m) is bullish or bearish, the number of active FVGs, and whether you're in the trading session.
Risk Calculator Table (Bottom Right): Shows your risk amount and calculates how many contracts you can trade for different stop loss sizes (5pt, 10pt, 15pt).
How It Works
What is a Fair Value Gap?
A Fair Value Gap (FVG) is a 3-candle pattern where aggressive buying or selling creates a price void. Specifically, it's when the wick of the first candle doesn't overlap with the wick of the third candle, leaving a gap in between. Price tends to return to these gaps to 'rebalance' before continuing in the original direction.
What is an Inverse FVG?
When an FVG gets filled (price returns and closes through the gap), it becomes an Inverse FVG (IFVG). These zones flip their polarity - a filled Bullish FVG becomes resistance, and a filled Bearish FVG becomes support. The indicator automatically converts mitigated FVGs to yellow IFVG boxes.
The 50% Entry Level
The dashed white line in each FVG represents the 50% level (also called Consequent Encroachment). This is considered the optimal entry point - it's the middle of the imbalance where price is most likely to react.
Suggested Trading Strategy
1. Check HTF Bias (top right table) - only trade in that direction
2. Wait for a liquidity sweep (SWEEP label appears)
3. Look for an FVG to form AFTER the sweep
4. Enter when price returns to the 50% level (dashed line)
5. Place stop loss below/above the FVG (add 2 ticks buffer)
6. Take profit at 1:2 or 1:3 risk-to-reward ratio
Settings Explained
FVG Settings
• Min FVG Size: Minimum gap size in points to be considered valid (default: 2.0)
• Max FVG Age: How many bars until an FVG is removed from chart (default: 50)
• Show 50% Entry Level: Toggle the dashed entry line on/off
Session Settings
• Show Session Boxes: Toggle all session boxes on/off
• Max Sessions to Show: How many historical sessions to display (default: 5)
• Individual Session Toggles: Turn each session (Asia/London/NY/Sydney/Kill Zone) on or off
Risk Calculator Settings
• Account Size: Your trading account balance
• Risk Per Trade: Percentage of account to risk per trade (default: 0.5%)
• Tick Value/Size: Contract specifications for MNQ ($0.50 per tick, 0.25 point tick size)
Tips for Best Results
1. Trade during the Kill Zone (8:00-11:00 AM ET) for best volatility and liquidity
2. Always align trades with HTF bias - don't fight the trend
3. Wait for liquidity sweeps before entering - this confirms smart money activity
4. Use the 50% level for entries - it offers the best risk-to-reward
5. Watch for IFVG zones as additional confluence for entries
6. Use the risk calculator to size positions properly - never risk more than you can afford
7. Session boxes help identify where stops are clustered - sweeps of these levels often precede reversals
Available Alerts
• New FVG Formed (Bullish or Bearish)
• Price Touching 50% Entry Level
• FVG Mitigated (gap filled)
• Long Entry Signal
• Short Entry Signal
• PDH/PDL Liquidity Sweep
─────────────────────────────────────
Created by BullyTrading
Designed for MNQ Prop Firm Trading

Responsive ADX (RADX)Introducing the new Responsive ADX (RADX), running with a (length = 9) and exactly how it differs from the standard built-in ADX you see on TradingView chart.
This indicator is still a true ADX at its core — it measures trend strength from 0 to 100 and uses the classic +DI and –DI lines to show direction — but it has been carefully "tuned" to react noticeably faster while staying smooth and usable. With the length set to 9, it is one of the most responsive versions you can run without turning into noise.
How it behaves differently from the normal (Wilder) ADX
Normal ADX is lagging, now this version gives you the same trend-strength reading 4–8 bars earlier than the built-in ADX. On a daily chart that can easily be 4–8 calendar days of earlier warning. On a 4-hour chart it’s 16–32 hours earlier. That head-start is the whole point.
The ADX line rises and falls much quicker.
When a new trend actually starts, you will often see this Fast ADX cross above 18–20 while the built-in ADX is still sleeping below 15. Conversely, when a trend dies, this version drops faster, so you’re not left holding a dead trade for an extra week.
The +DI and –DI lines are almost identical to the original, but lightly smoothed with a 5-period EMA (you can turn this off). This makes the DI crossovers cleaner and reduces whipsaws without adding meaningful lag.
The final ADX smoothing uses a lightweight Hull-style technique instead of Wilder’s very slow RMA. This is the main “secret sauce” that removes roughly half the lag while keeping the line smooth and readable.
Values are realistic and tradable.
With length 9 you will typically see:
– 0–18 = flat / chop
– 15–20 = emerging trend (background starts colouring)
– 20–50 = strong trend (most people take this as confirmation)
– above 50–60 only in very powerful moves (same as normal ADX)
The aqua / purple background only appears when both conditions are met: the correct DI is on top and Fast ADX is above your chosen “weak-to-trending” level (default 18).
This prevents the background from flashing on and off in sideways markets — exactly the same logic you liked in the original Trinity ADX, but now much earlier.
In very simple terms
Think of the normal built-in ADX as a diesel truck — reliable but slow to accelerate and slow to stop. Fast Responsive ADX with length 9 is the same truck with a turbocharger — same destination and same load capacity, but it gets up to speed twice as fast and brakes earlier when the road turns.
We would recommend people who switch to this version keep the (length 9–12) because the edge in timing is obvious on the chart.
That’s it — this is a new more responsive version, still-logical ADX!

Options Scalper v2 - SPY/QQQHere's a comprehensive description of the Options Scalper v2 strategy:
---
## Options Scalper v2 - SPY/QQQ
### Overview
A multi-indicator confluence-based scalping strategy designed for trading SPY and QQQ options on short timeframes (1-5 minute charts). The strategy uses a scoring system to generate high-probability CALL and PUT signals by requiring alignment across multiple technical indicators before triggering entries.
---
### Core Logic
The strategy operates on a **scoring system (0-9 points)** where both bullish (CALL) and bearish (PUT) conditions are evaluated independently. A signal only fires when:
1. A recent EMA crossover occurred (within the last 3 bars)
2. The direction's score meets the minimum threshold (default: 4 points)
3. The signal's score is higher than the opposite direction
4. Enough bars have passed since the last signal (cooldown period)
5. Price action occurs during valid trading sessions
---
### Indicators Used
| Indicator | Purpose | CALL Condition | PUT Condition |
|-----------|---------|----------------|---------------|
| **9/21 EMA Cross** | Primary trigger | Fast EMA crosses above slow | Fast EMA crosses below slow |
| **200 EMA** | Trend filter | Price above 200 EMA | Price below 200 EMA |
| **RSI (14)** | Momentum filter | RSI between 45-65 | RSI between 35-55 |
| **VWAP** | Institutional level | Price above VWAP | Price below VWAP |
| **MACD (12,26,9)** | Momentum confirmation | MACD line > Signal line | MACD line < Signal line |
| **Stochastic (14,3)** | Overbought/Oversold | Oversold or K > D | Overbought or K < D |
| **Volume** | Participation confirmation | Spike on green candle | Spike on red candle |
| **Price Structure** | Breakout detection | Higher high formed | Lower low formed |
---
### Scoring Breakdown
**CALL Score (Max 9 points):**
- Recent EMA cross up: +2 pts
- EMA alignment (fast > slow): +1 pt
- RSI in bullish range: +1 pt
- Above VWAP: +1 pt
- MACD bullish: +1 pt
- Volume spike on green candle: +1 pt
- Stochastic setup: +1 pt
- Above 200 EMA: +1 pt
- Breaking higher high: +1 pt
**PUT Score (Max 9 points):**
- Recent EMA cross down: +2 pts
- EMA alignment (fast < slow): +1 pt
- RSI in bearish range: +1 pt
- Below VWAP: +1 pt
- MACD bearish: +1 pt
- Volume spike on red candle: +1 pt
- Stochastic setup: +1 pt
- Below 200 EMA: +1 pt
- Breaking lower low: +1 pt
---
### Risk Management
The strategy uses **ATR-based dynamic stops and targets**:
| Parameter | Default | Description |
|-----------|---------|-------------|
| Stop Loss | 1.5x ATR | Distance below entry for longs, above for shorts |
| Take Profit | 2.0x ATR | Creates a 1:1.33 risk-reward ratio |
Positions are also closed on:
- Opposite direction signal (flip trade)
- Take profit or stop loss hit
---
### Session Filtering
Trades are restricted to high-liquidity periods by default:
- **Morning Session:** 9:30 AM - 11:00 AM EST
- **Afternoon Session:** 2:30 PM - 3:55 PM EST
This avoids choppy midday price action and captures the highest volume periods.
---
### Input Parameters
| Parameter | Default | Description |
|-----------|---------|-------------|
| Fast EMA | 9 | Fast moving average period |
| Slow EMA | 21 | Slow moving average period |
| Trend EMA | 200 | Long-term trend filter |
| RSI Length | 14 | RSI calculation period |
| RSI Overbought | 65 | Upper RSI threshold |
| RSI Oversold | 35 | Lower RSI threshold |
| Volume Multiplier | 1.2x | Volume spike detection threshold |
| Min Signal Strength | 4 | Minimum score required to trigger |
| Crossover Lookback | 3 | Bars to consider crossover "recent" |
| Min Bars Between Signals | 5 | Cooldown period between signals |
---
### Visual Elements
**Chart Plots:**
- Green line: 9 EMA (fast)
- Red line: 21 EMA (slow)
- Gray line: 200 EMA (trend)
- Purple dots: VWAP
**Signal Markers:**
- Green triangle up + "CALL" label: Buy call signal
- Red triangle down + "PUT" label: Buy put signal
- Small circles: EMA crossover reference points
**Info Table (Top Right):**
- Real-time CALL and PUT scores
- RSI, MACD, Stochastic values
- VWAP and 200 EMA position
- Recent crossover status
- Current signal state
---
### Alerts
| Alert Name | Trigger |
|------------|---------|
| CALL Entry | Standard call signal fires |
| PUT Entry | Standard put signal fires |
| Strong CALL | Call signal with score ≥ 6 |
| Strong PUT | Put signal with score ≥ 6 |
---
### Recommended Usage
| Setting | 0DTE Scalping | Intraday Swings |
|---------|---------------|-----------------|
| Timeframe | 1-2 min | 5 min |
| Min Signal Strength | 5-6 | 4 |
| ATR Stop Mult | 1.0 | 1.5 |
| ATR TP Mult | 1.5 | 2.0 |
| Option Delta | 0.40-0.50 | 0.30-0.40 |
---
### Key Improvements Over v1
1. **Requires actual crossover** - Eliminates false signals from simple trend continuation
2. **Balanced scoring** - Both directions evaluated equally, highest score wins
3. **Signal cooldown** - Prevents overtrading with minimum bar spacing
4. **Multi-indicator confluence** - 8 factors must align for signal generation
5. **Volume-candle alignment** - Volume spikes only count when matching candle direction
---
### Disclaimer
This strategy is for educational purposes. Backtest thoroughly before live trading. Options trading involves significant risk of loss. Past performance does not guarantee future results.

Multi-Condition Alert System d//@version=5
indicator("Multi-Condition Alert System", shorttitle="MC Alert", overlay=false)
// Timeframe check - Set to 10 minutes
isCorrectTF = timeframe.isintraday and timeframe.multiplier == 10
// EMA Calculations
ema9 = ta.ema(close, 9)
ema21 = ta.ema(close, 21)
ema50 = ta.ema(close, 50)
// MACD Calculations
= ta.macd(close, 12, 26, 9)
// RSI Calculations
rsiValue = ta.rsi(close, 14)
// Define RSI levels (you can adjust these based on your violet/yellow lines)
// Assuming violet is above 50 and yellow is below 50
rsiVioletLevel = 50 // Adjust based on your actual levels
rsiYellowLevel = 50 // Adjust based on your actual levels
// Conditions
emaCondition = ema9 > ema21 and ema9 > ema50
macdCondition = macdLine > signalLine
rsiCondition = rsiValue > rsiVioletLevel and rsiValue > rsiYellowLevel
// All conditions must be true
buySignal = emaCondition and macdCondition and rsiCondition and isCorrectTF
// Plotting for visualization
plot(ema9, color=color.blue, title="EMA 9")
plot(ema21, color=color.orange, title="EMA 21")
plot(ema50, color=color.red, title="EMA 50")
plot(macdLine, color=color.blue, title="MACD Line", style=plot.style_line)
plot(signalLine, color=color.orange, title="Signal Line", style=plot.style_line)
hline(rsiVioletLevel, "RSI Violet Level", color=color.purple)
hline(rsiYellowLevel, "RSI Yellow Level", color=color.yellow)
plot(rsiValue, color=color.white, title="RSI")
// Plot buy signals
plotshape(buySignal ? 1 : na, title="Buy Signal", location=location.bottom,
color=color.green, style=shape.triangleup, size=size.small)
// Alert condition
if buySignal
alert("BUY SIGNAL: EMA 9 > EMA 21 & 50, MACD blue > orange, RSI above levels", alert.freq_once_per_bar)
// Table display
var table signalTable = table.new(position.top_right, 1, 5, bgcolor=color.black,
border_width=1)
if barstate.islast
table.cell(signalTable, 0, 0, "10min TF Check:",
text_color=isCorrectTF ? color.green : color.red)
table.cell(signalTable, 0, 1, "EMA 9 > 21 & 50:",
text_color=emaCondition ? color.green : color.red)
table.cell(signalTable, 0, 2, "MACD Blue > Orange:",
text_color=macdCondition ? color.green : color.red)
table.cell(signalTable, 0, 3, "RSI Condition:",
text_color=rsiCondition ? color.green : color.red)
table.cell(signalTable, 0, 4, "BUY SIGNAL:",
text_color=buySignal ? color.green : color.red)

NY 9:30-9:35 High/Low Range📘 Script Description
This script automatically identifies and plots the high and low of the 5-minute candle formed between 9:30 AM and 9:35 AM New York time, which corresponds to the opening of the U.S. equity market.
The goal is to provide a clear reference level for intraday volatility, directional bias, and breakout levels.
🔍 Function Overview
■ 1. Detects the 9:30–9:35 NY Time Candle
The script converts chart timestamps into New York session time and automatically captures the 5-minute candle that forms between:
NY 9:30:00 → NY 9:35:00
■ 2. Automatically Draws Horizontal Lines
After identifying the high and low of this candle, the script draws:
High line → Red
Low line → Blue
Lines start exactly at the 9:30 timestamp
Lines extend 3 hours into the future (until NY 12:30)
Lines do not extend beyond 3 hours (prevents unwanted diagonal lines or lines from previous days)
■ 3. Label Display at NY 20:00
The script places a label at New York 20:00, marking:
“9:30 High” for the high line
“9:30 Low” for the low line
This allows you to instantly identify the key reference levels at the end of the trading day.
■ 4. Auto-Removal at NY 20:00
At NY 20:00, both the lines and the labels are automatically deleted.
No old lines remain on the chart, ensuring clarity and accuracy for each new trading day.
🎯 Purpose and Use Cases
This script is highly useful for:
Determining intraday direction after the NY open
Tracking volatility spikes at the U.S. equity market open
Identifying breakout levels
Using high/low as dynamic support and resistance throughout the day
Understanding market context during economic events or high-impact sessions
The 9:30–9:35 range is one of the most watched price zones in global markets, often serving as the day’s initial liquidity sweep.
📝 Key Features
Accurate New York time conversion
Clean horizontal lines (no previous-day diagonal lines)
Labels positioned clearly at NY 20:00
No unnecessary visuals—simple and effective
Lightweight script with minimal chart impact

FX OSINT — Institutional Midnight Intelligence For ForexFX OSINT — Institutional Midnight Intelligence For Forex
See Your FX Charts Like an Intelligence Briefing, Not a Guess
If you’ve ever stared at EURUSD or GBPJPY and thought:
Where is the real liquidity?
Is this move sponsored by smart money or just noise?
Am I buying into premium or discount?
…then FX OSINT is designed for you.
FX OSINT (Forex Open Source Intelligence) treats the FX market the way an analyst treats an investigation:
Collect open‑source signals from price, time, and volatility.
Map out liquidity, structure, and sessions in a repeatable way.
Present them in a clean, non‑cluttered dashboard so you can read context quickly.
No rainbow spaghetti. No 12 indicators stacked on top of each other. Just structured information, midnight visuals, and a clear read on what the market is doing right now.
Why FX OSINT Exists
Many FX traders run into the same problems:
Overloaded charts – multiple indicators fighting for space, none talking to each other.
Signals with no context – arrows that ignore structure, sessions, and liquidity.
Tools not tuned for FX – generic indicators that don’t care what pair you are on.
FX OSINT brings this together into one FX‑focused framework that:
Understands structure : BOS/CHOCH, swings, and trend across multiple timeframes.
Respects liquidity : sweeps, order blocks, and FVGs with controlled visibility.
Reads volatility & ADR : how far today’s range has developed.
Knows the clock : London, New York, and key killzones.
Scores confluence : a 0–100 engine that summarizes how much is lining up.
FX OSINT is built for traders who want structured, institutional‑style logic with a disciplined, midnight‑themed UI —not flashing buy/sell buttons.
1. Midnight Dashboard — Top‑Right Intelligence Panel
This panel acts as your compact “situation room”:
CONFLUENCE — 0–100 score blending trend alignment, volatility regime, sessions, liquidity events, order blocks, FVGs, and ADR context.
REGIME — Low / Building / Normal / Expansion / Extreme, driven by ATR relationships, so you know if you’re in chop, trend, or expansion.
HTF / MTF / LTF TREND — Higher‑, medium‑, and current‑timeframe bias in one place, so you see if you are trading with or against the larger flow.
ADR USED — How much of today’s typical range has already been consumed in percentage terms.
PIP VALUE — Approximate pip size per pair, including JPY‑style pairs.
Everything is bold, legible, and color‑coded, but the layout stays minimal so you can:
Look once → understand the context.
2. Structure, BOS, CHOCH — Smart‑Money‑Style Skeleton
FX OSINT tracks swing highs and lows, then shows how structure evolves:
Trend logic based on evolving swings, not just a moving average cross.
BOS (Break of Structure) when price expands in the direction of trend.
CHOCH (Change of Character) when behavior flips and the market structure changes.
Labels are selective, not spammy . You don’t get a tag on every minor wiggle—only when structure meaningfully shifts, so it’s easier to answer:
"Are we continuing the current leg, or did something actually change here?"
3. Liquidity Sweeps, Order Blocks & FVGs — The OSINT Layer
FX OSINT treats liquidity as a key information layer:
Liquidity sweeps — Detects when price spikes through recent highs/lows and then snaps back, flagging potential stop runs.
Order blocks — The last opposite candle before a displacement move, drawn as controlled boxes with limited lifespan to avoid clutter.
Fair Value Gaps (FVGs) — Three‑candle imbalances rendered as precise zones with a cap on how many can exist at once.
Under the hood, boxes are managed so your chart does not become a wall of old zones:
// Draw Order Blocks with overlap prevention
if isBullishOB and showOrderBlocks
if array.size(obBoxes) >= maxBoxes
oldBox = array.shift(obBoxes)
box.delete(oldBox)
newBox = box.new(bar_index , low , bar_index + obvLength, high ,
border_color = bullColor, bgcolor = bullColorTransp,
border_width = 2, extend = extend.none)
array.push(obBoxes, newBox)
Box limits keep the number of zones under control.
Borders and transparency are tuned so you still see price clearly.
You end up with a curated liquidity map , rather than a chart buried under every level price has ever touched.
4. Volatility, ADR & Sessions — Time and Range Intelligence
FX OSINT runs a Volatility Regime Analyzer and an ADR engine in the background:
Volatility regime — Five states (Low → Extreme) derived from fast vs. slow ATR.
ADR bands — Daily high/mid/low projected from the current daily open.
ADR used % — How far today’s move has traveled relative to its typical range.
On the time side:
Asia, London, New York sessions are softly highlighted with a single active background to avoid overlapping colors.
Killzones (e.g., London and New York opens) can be emphasized when you want to focus on where significant moves often begin.
Together, this helps you answer:
"What time is it in the trading day?"
"How stretched are we?"
"Is expansion just starting, or are we late to the move?"
5. ICT‑Style Add‑Ons — BOS/CHOCH, Premium/Discount, and Confluence
For modern FX / ICT‑inspired workflows, FX OSINT includes:
BOS / CHOCH labels — Clear structural shifts based on swings.
Premium / Discount zones — 25%, 50%, 75% levels of the daily range, so you know if you are buying discount in an uptrend or selling premium in a downtrend.
Confluence score — A single number summarizing how many conditions line up in the current context.
Instead of replacing your plan, FX OSINT compresses your checklist into the chart:
Structure
Liquidity
Session / Time
Volatility / ADR
Higher‑timeframe alignment
When these agree, the dashboard reflects it. When they don’t, it stays neutral and lets you see the conflict.
How To Use FX OSINT
FX OSINT is not a signal bot. It is an information engine that organizes context so you can apply your own plan.
A typical workflow might look like:
Start on higher timeframes (e.g., H4/D1) to form directional bias from structure, volatility regime, and ADR context.
Move to intraday timeframes (e.g., M15/H1) around your chosen sessions (London and/or New York).
Look for confluence :
HTF / MTF / LTF trends aligned.
Price in discount for longs or premium for shorts.
Recent liquidity sweep into a meaningful OB or FVG.
Confluence score at or above a level you consider significant.
Then refine entries using BOS/CHOCH on lower timeframes according to your own risk and execution rules.
FX OSINT aims to make sure you do not enter a trade without seeing:
Where you are in the day (ADR and sessions).
Where you are in the volatility cycle (regime).
Who currently appears in control (structure and trend).
Which liquidity was just targeted (sweeps and zones).
Design Choices and Scope
FX OSINT was designed around a few clear constraints:
FX‑focused — Logic and filters tuned for FX majors, minors, exotics, and metals. It is intended for FX markets, not for every possible asset class.
Open‑source — The full Pine Script code is available so you can read it, learn from it, and adapt it to your own workflow if needed.
Clear themes — Two main visual styles (e.g., dark institutional “midnight” and a lighter accent variant) with a focus on readability, not visual noise.
Chart‑friendly — Panels use fixed areas, session highlights avoid overlapping, and boxes are capped/pruned so the chart remains usable.
FX OSINT is for only Forex pairs, not anything else!
Hope you enjoyed and remember your Open Source Intelligence Matters 😉!
-officialjackofalltrades
