Reverse MACD IndicatorIntroducing the reverse MACD Indicator.
This is my Pinescript implementation of the reverse MACD indicator.
Much respect to Mr Johnny Dough the original creator of this idea.
Feel free to reuse this script, drop me a note below if you find this useful.
Investopedia defines the MACD as a trend-following momentum indicator that shows the relationship between two moving averages of a security’s price.
The MACD is calculated by subtracting the 26-period Exponential Moving Average ( EMA ) from the 12-period EMA .
The result of that calculation is the MACD line.
A nine-day EMA of the MACD called the "signal line," is then plotted on top of the MACD line, which can function as a trigger for buy and sell signals.
Traders may buy the security when the MACD crosses above its signal line and sell—or short—the security when the MACD crosses below the signal line.
Moving Average Convergence Divergence ( MACD ) indicators can be interpreted in several ways, but the more common methods are crossovers, divergences, and rapid rises/falls.
MACD triggers technical signals when it crosses above (to buy) or below (to sell) its signal line.
The speed of crossovers is also taken as a signal of a market is overbought or oversold.
MACD helps investors understand whether the bullish or bearish movement in the price is strengthening or weakening.
The MACD has a positive value (shown as the red line on the price chart ) whenever the 12-period EMA ( indicated by the blue line on the price chart) is above the 26-period EMA (the red line in the price chart) and a negative value when the 12-period EMA is below the 26-period EMA .
The more distant the MACD is above or below its baseline indicates that the distance between the two EMAs is growing.
The baseline here is the white line.
The Reverse function of the MACD provides value by letting the user know the specific price needed to expect a MACD cross over in the opposite direction.
This function can be used to designate risk parameters for a potential trade if using the MACD as their source of edge, letting the user know exactly where and how much their risk is for a potential trade which can be used to design an effective trading plan.
Pesquisar nos scripts por "12月4号是什么星座"
Percentage Volume Oscillator (PVO)The Percentage Volume Oscillator (PVO) is a momentum oscillator for volume. The PVO measures the difference between two volume-based moving averages as a percentage of the larger moving average. As with MACD and the Percentage Price Oscillator (PPO), it is shown with a signal line, a histogram and a centerline. The PVO is positive when the shorter volume EMA is above the longer volume EMA and negative when the shorter volume EMA is below. This indicator can be used to define the ups and downs for volume, which can then be used to confirm or refute other signals. Typically, a breakout or support break is validated when the PVO is rising or positive.
Generally speaking, volume is above average when the PVO is positive and below average when the PVO is negative. A negative and rising PVO indicates that volume levels are increasing. A positive and falling PVO indicates that volume levels are decreasing. Chartists can use this information to confirm or refute movements on the price chart.
Even though the PVO is based on a momentum oscillator formula, it is important to remember that moving averages lag. A 12-day EMA include 12 days of volume data, with newer data weighted more heavily. A 26-day EMA lags even more because it contains 26 days of data. This means that the PVO(12,26,9) can sometimes be out of sync with price action.
The Percentage Volume Oscillator (PVO) is a momentum indicator applied to volume. This oscillator can be quite choppy due to the fact that volume doesn't trend. Bullish and bearish divergences are not well suited for the PVO. Instead, chartists would be better off looking for signs of increasing volume with a move into positive territory and signs of decreasing volume with a move into negative territory. Increasing volume can validate a support or resistance break. Similarly, a surge or significant support break on low volume may be less robust. As with all technical indicators, it is important to use the Percentage Volume Oscillator (PVO) in conjunction with other aspects of technical analysis, such as chart patterns and momentum oscillators.

ETF / Stocks / Crypto - DCA Strategy v1Simple "benchmark" strategy for ETFs, Stocks and Crypto! Super-easy to implement for beginners, a DCA (dollar-cost-averaging) strategy means that you buy a fixed amount of an ETF / Stock / Crypto every several months. For instance, to DCA the S&P 500 (SPY), you could purchase $10,000 USD every 12 months, irrespective of the market price. Assuming the macro-economic conditions of the underlying country remain favourable, DCA strategies will result in capital gains over a period of many years, e.g. 10 years. DCA is the safest strategy that beginners can employ to make money in the markets, and all other types of strategies should be "benchmarked" against DCA; if your strategy cannot outperform DCA, then your strategy is useless.
Recommended Chart Settings:
Asset Class: ETF / Stocks / Crypto
Time Frame: H1 (Hourly) / D1 (Daily) / W1 (Weekly) / M1 (Monthly)
Necessary ETF Macro Conditions:
1. Country must have healthy demographics, good ratio of young > old
2. Country population must be increasing
3. Country must be experiencing price-inflation
Necessary Stock Conditions:
1. Growing revenue
2. Growing net income
3. Consistent net margins
4. Higher gross/net profit margin compared to its peers in the industry
5. Growing share holders equity
6. Current ratios > 1
7. Debt to equity ratio (compare to peers)
8. Debt servicing ratio < 30%
9. Wide economic moat
10. Products and services used daily, and will stay relevant for at least 1 decade
Necessary Crypto Conditions:
1. Honest founders
2. Competent technical co-founders
3. Fair or non-existent pre-mine
4. Solid marketing and PR
5. Legitimate use-cases / adoption
Default Robot Settings:
Contribution (USD): $10,000
Frequency (Months): 12
*Robot buys $10,000 worth of ETF, Stock, Crypto, regardless of the market price, every 12 months since its founding time.*
*Equity curve can be seen from the bottom panel*
Risk Warning:
This strategy is low-risk, however it assumes you have a long time horizon of at least 5 to 10 years. The longer your holding-period, the better your returns. The only thing the user has to keep-in-mind are the macro-economic conditions as stated above. If unsure, please stick to ETFs rather than buying individual stocks or cryptocurrencies.

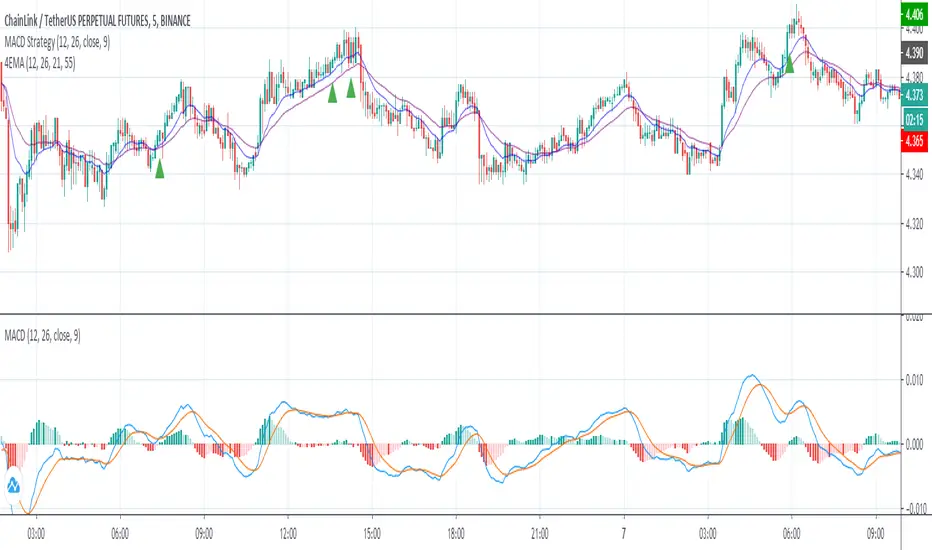
MACD StrategyThis script sends buy and sell signals as alerts to 3Commas (online software with trading bots in cryptocurreny)
It's based on 2 indicators:
- MACD
- 12 EMA and 26 EMA
When the 12 EMA and 26 EMA crossover, the MACD line crosses above 0. The goal here is to look for buy signals when the MACD and Signal are below 0, the histogram is positive, and there was or will be a 12 EMA and 26 EMA crossover.
I struggle with the following:
- There are multiple ways to use this as a crossover signal. I want to calculate the win rate of every posibility.
- What should be my take profit and my stoploss?
I think a 2:1 R/R,and a 60% win rate would make a great strategy! I could use some advice.
PowerX Strategy Bar Coloring [OFFICIAL VERSION]This script colors the bars according to the PowerX Strategy by Markus Heitkoetter:
The PowerX Strategy uses 3 indicators:
- RSI (7)
- Stochastics (14, 3, 3)
- MACD (12, 26 , 9)
The bars are colored GREEN if...
1.) The RSI (7) is above 50 AND
2.) The Stochastic (14, 3, 3) is above 50 AND
3.) The MACD (12, 26, 9) is above its Moving Average, i.e. MACD Histogram is positive.
The bars are colored RED if...
1.) The RSI (7) is below 50 AND
2.) The Stochastic (14, 3, 3) is below 50 AND
3.) The MACD (12, 26, 9) is below its Moving Average, i.e. MACD Histogram is negative.
If only 2 of these 3 conditions are met, then the bars are black (default color)
We highly recommend plotting the indicators mentioned above on your chart, too, so that you can see when bars are getting close to being "RED" or "GREEN", e.g. RSI is getting close to the 50 line.

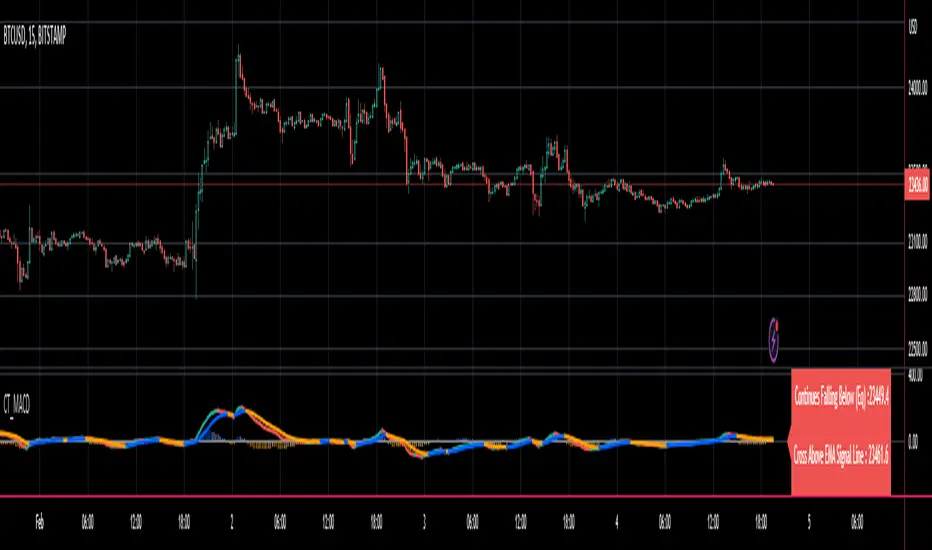
Price Action and 3 EMAs Momentum plus Sessions FilterThis indicator plots on the chart the parameters and signals of the Price Action and 3 EMAs Momentum plus Sessions Filter Algorithmic Strategy. The strategy trades based on time-series (absolute) and relative momentum of price close, highs, lows and 3 EMAs.
I am still learning PS and therefore I have only been able to write the indicator up to the Signal generation. I plan to expand the indicator to Entry Signals as well as the full Strategy.
The strategy works best on EURUSD in the 15 minutes TF during London and New York sessions with 1 to 1 TP and SL of 30 pips with lots resulting in 3% risk of the account per trade. I have already written the full strategy in another language and platform and back tested it for ten years and it was profitable for 7 of the 10 years with average profit of 15% p.a which can be easily increased by increasing risk per trade. I have been trading it live in that platform for over two years and it is profitable.
Contributions from experienced PS coders in completing the Indicator as well as writing the Strategy and back testing it on Trading View will be appreciated.
STRATEGY AND INDICATOR PARAMETERS
Three periods of 12, 48 and 96 in the 15 min TF which are equivalent to 3, 12 and 24 hours i.e (15 min * period / 60 min) are the foundational inputs for all the parameters of the PA & 3 EMAs Momentum + SF Algo Strategy and its Indicator.
3 EMAs momentum parameters and conditions
• FastEMA = ema of 12 periods
• MedEMA = ema of 48 periods
• SlowEMA = ema of 96 periods
• All the EMAs analyse price close for up to 96 (15 min periods) equivalent to 24 hours
• There’s Upward EMA momentum if price close > FastEMA and FastEMA > MedEMA and MedEMA > SlowEMA
• There’s Downward EMA momentum if price close < FastEMA and FastEMA < MedEMA and MedEMA < SlowEMA
PA momentum parameters and conditions
• HH = Highest High of 48 periods from 1st closed bar before current bar
• LL = Lowest Low of 48 periods from 1st closed bar from current bar
• Previous HH = Highest High of 84 periods from 12th closed bar before current bar
• Previous LL = Lowest Low of 84 periods from 12th closed bar before current bar
• All the HH & LL and prevHH & prevLL are within the 96 periods from the 1st closed bar before current bar and therefore indicative of momentum during the past 24 hours
• There’s Upward PA momentum if price close > HH and HH > prevHH and LL > prevLL
• There’s Downward PA momentum if price close < LL and LL < prevLL and HH < prevHH
Signal conditions and Status (BuySignal, SellSignal or Neutral)
• The strategy generates Buy or Sell Signals if both 3 EMAs and PA momentum conditions are met for each direction and these occur during the London and New York sessions
• BuySignal if price close > FastEMA and FastEMA > MedEMA and MedEMA > SlowEMA and price close > HH and HH > prevHH and LL > prevLL and timeinrange (LDN&NY) else Neutral
• SellSignal if price close < FastEMA and FastEMA < MedEMA and MedEMA < SlowEMA and price close < LL and LL < prevLL and HH < prevHH and timeinrange (LDN&NY) else Neutral
Entry conditions and Status (EnterBuy, EnterSell or Neutral)(NOT CODED YET)
• ENTRY IS NOT AT THE SIGNAL BAR but at the current bar tick price retracement to FastEMA after the signal
• EnterBuy if current bar tick price <= FastEMA and current bar tick price > prevHH at the time of the Buy Signal
• EnterSell if current bar tick price >= FastEMA and current bar tick price > prevLL at the time of the Sell Signal

Smart labelling - Candlestick FunctionOftentimes a single look at the candlestick configuration happens to be enough to understand what is going on. The chandlestick function is an experiment in smart labelling that produces candles for various time frames, not only for the fixed 1m, 3m , 5m, 15m, etc. ones, and helps in decision-making when eye-balling the chart. This function generates up to 12 last candlesticks , which is generally more than enough.
Mind that since this is an experiment, the function does not cover all possible combinations. In some time frames the produced candles overlap. This is a todo item for those who are unterested. For instance, the current version covers the following TFs:
Chart - TF in the script
1m - 1-20,24,30,32
3m - 1-10
5m - 1-4,6,9,12,18,36
15m - 1-4,6,12
Tested chart TFs: 1m, 3m ,5m,15m. Tested securities: BTCUSD , EURUSD

[astropark] Power Tools Overlay//******************************************************************************
// Power Tools Overlay
// Inner Version 1.2.1 13/12/2018
// Developer: iDelphi
// Developer: astropark (Ichimoku Cloud), SMA EMA & Cross tools
//------------------------------------------------------------------------------
// 21/11/2018 Added EMA SMA WMA
// 21/11/2018 Added SMA-EMA EMA-WMA WMA-SMA (Thanks to mariobros1 for the idea of the Simultaneous MA)
// 21/11/2018 Added Bollinger Bands
// 21/11/2018 Added Ichimoku Cloud (Thanks to astropark for all the code of the Ichimoku Cloud)
// 23/11/2018 Show all the indicator as default
// 23/11/2018 Added a cross when single Moving Averages crossing (Thanks to astropark for the idea)
// 24/11/2018 Descriptions Fix
// 24/11/2018 Added Option to enable/disable all Moving Averages
// 10/12/2018 Added EMAs and Crosses
// 13/12/2018 indicator number fixes
//******************************************************************************

[Delphi] Power Tools OscillatorsFEATURES
- RSI
- Stochastic
//******************************************************************************
// Power Tools Oscillators
// Inner Version 1.0 04/12/2018
// Developer: iDelphi
//------------------------------------------------------------------------------
// 04/12/2018 Added RSI
// 04/12/2018 Added Stochastic
//******************************************************************************

Multi SMA EMA WMA HMA BB (4x3 MAs Bollinger Bands) Pro MTF - RRBMulti SMA EMA WMA HMA 4x3 Moving Averages with Bollinger Bands Pro MTF by RagingRocketBull 2018
Version 1.0
This indicator shows multiple MAs of any type SMA EMA WMA HMA etc with BB and MTF support, can show MAs as dynamically moving levels.
There are 4 MA groups + 1 BB group. You can assign any type/timeframe combo to a group, for example:
- EMAs 50,100,200 x H1, H4, D1, W1 (4 TFs x 3 MAs x 1 type)
- EMAs 8,13,21,55,100,200 x M15, H1 (2 TFs x 6 MAs x 1 type)
- D1 EMAs and SMAs 12,26,50,100,200,400 (1 TF x 6 MAs x 2 types)
- H1 WMAs 7,77,231; H4 HMAs 50,100,200; D1 EMAs 144,169,233; W1 SMAs 50,100,200 (4 TFs x 3 MAs x 4 types)
- +1 extra MA type/timeframe for BB
compile time: 25-30 sec
full redraw time after parameter change in UI: 3 sec
There are several versions: Simple, MTF, Pro MTF, Advanced MTF and Ultimate MTF. This is the Pro MTF version. The Differences are listed below. All versions have BB
- Simple: you have 2 groups of MAs that can be assigned any type (5+5)
- MTF: +2 custom Timeframes for each group (2x5 MTF)
- Pro MTF: +4 custom Timeframes for each group (4x3 MTF), MA levels and show max bars back options
- Advanced MTF: +2 extra MAs/group (4x5 MTF), custom Ticker/Symbol, backreferences for type, TF and MA lengths in UI
- Ultimate MTF: +individual settings for each MA, custom Ticker/Symbols
Features:
- 4x3 = 12 MAs of any type including Hull Moving Average (HMA)
- 4x MTF groups with step line smoothing
- BB +1 extra TF/type for BB MAs
- 12 MA levels with adjustable group offsets, indents and shift
- show max bars back
- you can show/hide both groups of MAs/levels and individual MAs
Notes:
1. based on 3EmaBB, uses plot*, barssince and security functions
2. you can't set certain constants from input due to Pinescript limitations - change the code as needed, recompile and use as a private version
3. Levels = trackprice implementation
4. Show Max Bars Back = show_last implementation
5. uses timeframe textbox instead of input resolution to allow for 120 240 and other custom TFs. Also supports TFs in hours: 2H or H2
6. swma has a fixed length = 4, alma and linreg have additional offset and smoothing params
7. Smoothing is applied by default for visual aesthetics on MTF. To use exact ma mtf values (lines with stair stepping) - disable it
MTF Notes:
- uses simple timeframe textbox instead of input resolution dropdown to allow for 120, 240 and other custom TFs, also supports timeframes in H: 2H, H2
- Groups that are not assigned a Custom TF will use Current Timeframe (0).
- MTF will work for any MA type assigned to the group
- MTF works both ways: you can display a higher TF MA/BB on a lower TF or a lower TF MA/BB on a higher TF.
- MTF MA values are normally aligned at the boundary of their native timeframe. This produces stair stepping when a higher TF MA is viewed on a lower TF.
Therefore X Y Point Density/Smoothing is applied by default on MA MTF for visual aesthetics. Set both to 0 to disable and see exact ma mtf values (lines with stair stepping and original mtf alignment).
- Smoothing is disabled for BB MTF bands because fill doesn't work with smoothed MAs after duplicate values are replaced with na.
- MTF MA Value fluctuation is possible on the current bar due to default security lookahead
Smoothing:
- X,Y == 0 - X,Y smoothing disabled (stair stepping on high TFs)
- X == 0, Y > 0 - X,Y smoothing applied to all TFs
- Y == 0, X > 0 - X smoothing applied to all TFs < deltaX_max_tf, Y smoothing disabled
- X > 0, Y > 0 - Y smoothing applied to all TFs, then X smoothing applied to all TFs < deltaX_max_tf
X Smoothing with Y == 0 - shows only every deltaX-th point starting from the first bar.
X Smoothing with Y > 0 - shows only every deltaX-th point starting from the last shown Y point, essentially filling huge gaps remaining after Y Smoothing with points and preserving the curve's general shape
X Smoothing on high TFs with already scarce points produces weird curve shapes, it works best only on high density lower TFs
Y Smoothing reduces points on all TFs, removes adjacent points with prices within deltaY, while preserving the smaller curve details.
A combination of X,Y produces the most accurate smoothing. Higher delta value - larger range, more points removed.
Show Max Bars Back:
- can't set plot show_last from input -> implemented using a timenow based range check
- you can't delete/modify history once plotted, so essentially it just sets a start point for plotting (from num_bars bars back) that works only in realtime mode (not in replay)
Levels:
You can plot current MA value using plot trackprice=true or by checking Show Price Line in Style. Problem is:
- you can only change color (not the dashed line style, width), have both ma + price line (not just the line), and it's full screen wide
- you can't set plot trackprice from input => implemented using plotshape/plotchar with fixed text labels serving as levels
- there's no other way of creating a dynamic level: hline, plot, offset - nothing else works.
- you can't plot a text var - all text strings must be constants, so you can't change the style, width and text labels without recompiling.
- from input you can only adjust offset, indent and shift for each level group, and change color
- the dot below each level line is the exact MA value. If you want just the line swap plotshape with plotchar, recompile and save as your private version, adjust Y shift.
To speed up redraw times: reduce last_bars to ~2000, recompile and use as your own private version
Pinescript is a rudimentary language (should be called Painscript instead) that can basically only plot data. You can't do much else. Please see the code for tips and hints.
Certain things just can't be done or require shady workarounds and weeks of testing trying to resolve weird node.js compiler errors.
Feel free to learn from/reuse/change the code as needed and use as your own private version. See comments in code. Good Luck!

ChronoPulse MS-MACD Resonance StrategyChronoPulse MS-MACD Resonance Strategy
A systematic trading strategy that combines higher-timeframe market structure analysis with dual MACD momentum confirmation, ATR-based risk management, and real-time quality assurance monitoring.
Core Principles
The strategy operates on the principle of multi-timeframe confluence, requiring agreement between:
Market structure breaks (CHOCH/BOS) on a higher timeframe
Dual MACD momentum confirmation (classic and crypto-tuned profiles)
Trend alignment via directional EMAs
Volatility and volume filters
Quality score composite threshold
Strategy Components
Market Structure Engine : Detects Break of Structure (BOS) and Change of Character (CHOCH) events using confirmed pivots on a configurable higher timeframe. Default structure timeframe is 240 minutes (4H).
Dual MACD Fusion : Requires agreement between two MACD configurations:
Classic MACD: 12/26/9 (default)
Fusion MACD: 8/21/5 (default, optimized for crypto volatility)
Both must agree on direction before trade execution. This can be disabled to use single MACD confirmation.
Trend Alignment : Uses two EMAs for directional bias:
Directional EMA: 55 periods (default)
Execution Trend Guide: 34 periods (default)
Both must align with trade direction.
ATR Risk Management : All risk parameters are expressed in ATR multiples:
Stop Loss: 1.5 × ATR (default)
Take Profit: 3.0 × ATR (default)
Trail Activation: 1.0 × ATR profit required (default)
Trail Distance: 1.5 × ATR behind price (default)
Volume Surge Filter : Optional gate requiring current volume to exceed a multiple of the volume SMA. Default threshold is 1.4× the 20-period volume SMA.
Quality Score Gate : Composite score (0-1) combining:
Structure alignment (0.0-1.0)
Momentum strength (0.0-1.0)
Trend alignment (0.0-1.0)
ATR volatility score (0.0-1.0)
Volume intensity (0.0-1.0)
Default threshold: 0.62. Trades only execute when quality score exceeds this threshold.
Execution Discipline : Trade budgeting system:
Maximum trades per session: 6 (default)
Cooldown bars between entries: 5 (default)
Quality Assurance Console : Real-time monitoring panel displaying:
Structure status (pass/fail)
Momentum confirmation (pass/fail)
Volatility readiness (pass/fail)
Quality score (pass/fail)
Discipline compliance (pass/fail)
Performance metrics (win rate, profit factor)
Net PnL
Certification requires: Win Rate ≥ 40%, Profit Factor ≥ 1.4, Minimum 25 closed trades, and positive net profit.
Integrity Suite : Optional validation panel that audits:
Configuration sanity checks
ATR data readiness
EMA hierarchy validity
Performance realism checks
Strategy Settings
strategy(
title="ChronoPulse MS-MACD Resonance Strategy",
shorttitle="ChronPulse",
overlay=true,
max_labels_count=500,
max_lines_count=500,
initial_capital=100000,
currency=currency.USD,
pyramiding=0,
commission_type=strategy.commission.percent,
commission_value=0.015,
slippage=2,
default_qty_type=strategy.percent_of_equity,
default_qty_value=2.0,
calc_on_order_fills=true,
calc_on_every_tick=true,
process_orders_on_close=true
)
Key Input Parameters
Structure Timeframe : 240 (4H) - Higher timeframe for structure analysis
Structure Pivot Left/Right : 3/3 - Pivot confirmation periods
Structure Break Buffer : 0.15% - Buffer for structure break confirmation
MACD Fast/Slow/Signal : 12/26/9 - Classic MACD parameters
Fusion MACD Fast/Slow/Signal : 8/21/5 - Crypto-tuned MACD parameters
Directional EMA Length : 55 - Primary trend filter
Execution Trend Guide : 34 - Secondary trend filter
ATR Length : 14 - ATR calculation period
ATR Stop Multiplier : 1.5 - Stop loss in ATR units
ATR Target Multiplier : 3.0 - Take profit in ATR units
Trail Activation : 1.0 ATR - Profit required before trailing
Trail Distance : 1.5 ATR - Distance behind price
Volume Threshold : 1.4× - Volume surge multiplier
Quality Threshold : 0.62 - Minimum quality score (0-1)
Max Trades Per Session : 6 - Daily trade limit
Cooldown Bars : 5 - Bars between entries
Win-Rate Target : 40% - Minimum for QA certification
Profit Factor Target : 1.4 - Minimum for QA certification
Minimum Trades for QA : 25 - Required closed trades
Signal Generation Logic
A trade signal is generated when ALL of the following conditions are met:
Higher timeframe structure shows bullish (CHOCH/BOS) or bearish structure break
Both MACD profiles agree on direction (if fusion enabled)
Price is above both EMAs for longs (below for shorts)
ATR data is ready and above minimum threshold
Volume exceeds threshold × SMA (if volume gate enabled)
Quality score ≥ quality threshold
Trade budget available (under max trades per day)
Cooldown period satisfied
Risk Management
Stop loss and take profit are set immediately on entry
Trailing stop activates after 1.0 ATR of profit
Trailing stop maintains 1.5 ATR distance behind highest profit point
Position sizing uses 2% of equity per trade (default)
No pyramiding (single position per direction)
Limitations and Considerations
The strategy requires sufficient historical data for higher timeframe structure analysis
Quality gate may filter out many potential trades, reducing trade frequency
Performance metrics are based on historical backtesting and do not guarantee future results
Commission and slippage assumptions (0.015% + 2 ticks) may vary by broker
The strategy is optimized for trending markets with clear structure breaks
Choppy or ranging markets may produce false signals
Crypto markets may require different parameter tuning than traditional assets
Optimization Notes
The strategy includes several parameters that can be tuned for different market conditions:
Quality Threshold : Lower values (0.50-0.60) allow more trades but may reduce average quality. Higher values (0.70+) are more selective but may miss opportunities.
Structure Timeframe : Use 240 (4H) for intraday trading, Daily for swing trading, Weekly for position trading
Volume Gate : Disable for low-liquidity pairs or when volume data is unreliable
Dual MACD Fusion : Disable for mean-reverting markets where single MACD may be more responsive
Trade Discipline : Adjust max trades and cooldown based on your risk tolerance and market volatility
Non-Repainting Guarantee
All higher timeframe data requests use lookahead=barmerge.lookahead_off to prevent repainting. Pivot detection waits for full confirmation before registering structure breaks. All visual elements (tables, labels) update only on closed bars.
Alerts
Three alert conditions are available:
ChronoPulse Long Setup : Fires when all long entry conditions are met
ChronoPulse Short Setup : Fires when all short entry conditions are met
ChronoPulse QA Certification : Fires when Quality Assurance console reaches CERTIFIED status
Configure alerts with "Once Per Bar Close" delivery to match the non-repainting design.
Visual Elements
Structure Labels : CHOCH↑, CHOCH↓, BOS↑, BOS↓ markers on structure breaks
Directional EMA : Orange line showing trend bias
Trailing Stop Lines : Green (long) and red (short) trailing stop levels
Dashboard Panel : Real-time status display (structure, MACD, ATR, quality, PnL)
QA Console : Quality assurance monitoring panel
Integrity Suite Panel : Optional validation status display
Recommended Usage
Forward test with paper trading before live deployment
Monitor the QA console until it reaches CERTIFIED status
Adjust parameters based on your specific market and timeframe
Respect the trade discipline limits to avoid over-trading
Review quality scores and adjust threshold if needed
Use appropriate commission and slippage settings for your broker
Technical Implementation
The strategy uses Pine Script v6 with the following key features:
Multi-timeframe data requests with lookahead protection
Confirmed pivot detection for structure analysis
Dynamic trailing stop management
Real-time quality score calculation
Trade budgeting and cooldown enforcement
Comprehensive dashboard and monitoring panels
All source code is open and available for review and modification.
Disclaimer
This script is for educational and informational purposes only. It is not intended as financial, investment, or trading advice. Past performance does not guarantee future results. Trading involves substantial risk of loss and is not suitable for all investors. Always conduct your own research and consult with a qualified financial advisor before making any trading decisions. The author and TradingView are not responsible for any losses incurred from using this strategy.

Session VWAPs [cryptalent]This indicator provides a more granular and timely analysis of market structure compared to traditional daily Volume Weighted Average Price (VWAP). It splits the 24-hour trading day into four distinct, customizable sessions (T1, T2, T3, T4), calculating an independent Session VWAP and Standard Deviation Bands for each segment.
🌟 Key Features and Functionality
1. Segmented VWAP Calculation
Purpose: To track the true Volume Weighted Average Price (Fair Value) specific to the participants and trading activities within different global market sessions (e.g., Asian, European, US sessions).
Design: By default, the 24 hours (based on UTC time) are divided into T1 (00:00-06:00), T2 (06:00-12:00), T3 (12:00-20:00), and T4 (20:00-00:00).
Mechanism: The VWAP calculation resets at the start of each designated session, offering a clearer, segment-specific view of market consensus and volume absorption.
2. Standard Deviation Bands
Calculation: Each Session VWAP line is accompanied by upper and lower standard deviation bands.
Control: The width of these bands is controlled by the user input "Band Multiplier" (default is 1.0, representing one standard deviation).
Application: These bands measure the Volume-Weighted Volatility and define the expected "normal" trading range for the current session.
- Price within the bands suggests consolidation or a normal auction process.
- Price breaking out of the bands indicates strong directional momentum or an extreme/overbought/oversold condition for that specific session.
3. High Customization (User Inputs)
Session Timing: All four session start and end times (in UTC) are customizable, allowing traders to align the indicator with specific market hours or individual trading strategies.
Price Source: The source price used for the VWAP calculation is selectable (default is close).
💡 Trading Applications
1. Fair Value Identification: The VWAP line serves as the "Fair Value" or "Volume-Weighted Consensus Cost" for the active session.
Price above VWAP: Buyers are in control during that session.
Price below VWAP: Sellers are in control during that session.
2. Dynamic Support & Resistance: Both the VWAP and the Standard Deviation Bands often act as reliable dynamic support and resistance levels.
3. Volatility Assessment: The width of the bands reflects the volume-weighted volatility of the current session. Narrow bands suggest range-bound trading; wide bands imply strong directional activity.
4. Trend Strength: Sustained price action outside of the standard deviation bands is a key measure of the strength and commitment behind a current trend.

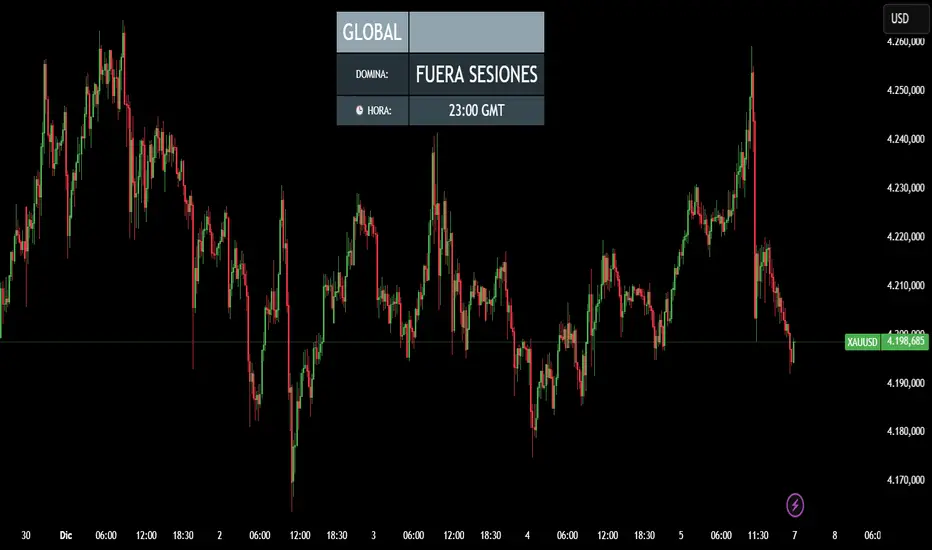
CRR - Reloj Sesiones & DominioIt uses simple rules:
00:00 – 07:00 → Tokyo / ASIA
07:00 – 12:00 → London / EUROPE
12:00 – 21:00 → New York / AMERICA
21:00 – 24:00 → Outside main sessions
Each session is assigned a color:
Tokyo → Blue
London → Yellow
New York → Green
Outside → Gray
2. Displays the current time in GMT format
Example: 14:32 GMT
3. Minimalist on-screen display (HUD)
The top center of the screen shows:
Continent (ASIA / EUROPE / AMERICA)
Which session is currently dominant (TOKYO / LONDON / NEW YORK)
The GMT time
All in a sleek table with dynamic colors based on the session.
🧠 In short:
A smart clock that tells you which session is dominant, which continent you're in, and what time it is in GMT, with a nice on-screen HUD.
🟡 GOLD 4H HUD v12 — Time-Safe Nuclear Edition🟡 GOLD 4H HUD v12 — Time-Safe Nuclear Edition
A full–scale Smart Money Concepts (SMC) analytics engine designed exclusively for XAUUSD on the 4-Hour timeframe.
This script combines market structure, liquidity, displacement, order blocks, imbalance, volume profile, SMT divergence, and institutional behavior modeling into a single unified HUD.
Built with a time-safe architecture, all structural elements (OB/FVG/Sweep) are stored by timestamp to minimize repainting and preserve event integrity.
📌 Core Features (12 Modules + Full HUD)
1 — Market Structure Engine
Automatically detects:
HH / HL / LH / LL
BOS (Break of Structure)
MSS (Market Structure Shift)
CHOCH (Change of Character)
Real swing pivots & trend state
2 — Sweep Engine (Liquidity Grab Detection)
Identifies institutional liquidity grabs:
Break + reclaim of highs/lows
ATR-filtered invalidation
Displacement-backed sweeps
3 — Time-Safe FVG Engine
Detects Bullish/Bearish Fair Value Gaps
ATR-tolerant FVG logic
Automatic right-extension
Auto-delete when filled or invalid
4 — Time-Safe Order Block Engine
Demand & Supply OB detection
Strength classification (Weak vs Strong)
FVG-overlap confirmation
Timestamp-locked (non-repainting)
5 — Volume Profile Engine (HVN / LVN / POC)
Real-time micro-profile:
High Volume Node (HVN)
Low Volume Node (LVN)
Point of Control (POC)
6 — SMT Engine (Gold vs DXY Divergence)
Smart Money Divergence built-in:
Bullish SMT
Bearish SMT
Directional confirmation with zero lag
7 — Displacement Engine
Measures institutional impulse:
Body-based impulse detection
Multi-leg continuation signals
FVG continuation moves
Generates displacement score
8 — Premium / Discount Model
Auto-classifies price into:
Discount (Buy zone)
Premium (Sell zone)
9 — SMC Trend Engine (Score-Based)
Combines 10+ factors:
Structure
FVG
OB power
Displacement
POC positioning
SMT conditions
Outputs:
BULL / BEAR / RANGE
Full scoring system
10 — Institutional Imbalance Model (IMB Engine)
Combines:
PD zones
Sweep direction
Displacement
SMT
OB strength
CHOCH/MSS
A complete institutional bias filter.
11 — Entry Engine (Signal Fusion Model)
Entry conditions fuse:
Sweep
CHOCH
Displacement
OB strength
FVG alignment
SMT confirmation
Also outputs:
Suggested SL/TP
Entry score
12 — Trendline Engine
Auto-draws:
HL → HL bullish trendlines
LH → LH bearish trendlines
+ Full Nuclear HUD
Displays:
Market structure
Trend direction
SMT / CHOCH / MSS
FVG / OB zones
HVN / LVN / POC
Liquidity strength
Entry model
Liquidity Magnet direction
SL/TP map
A complete institutional dashboard in one place.
⚠ Usage Requirement
This script is designed ONLY for the 4H timeframe.
✨ Summary
GOLD 4H HUD v12 — Time-Safe Nuclear Edition
is not just an indicator.
It is a full institutional-grade SMC analysis system, built specifically for Gold.
If you trade XAUUSD on the 4H timeframe —
this is your complete market intelligence HUD

Impulse Reactor RSI-SMA Trend Indicator [ApexLegion]Impulse Reactor RSI-SMA Trend Indicator
Introduction and Theoretical Background
Design Rationale
Standard indicators frequently generate binary 'BUY' or 'SELL' signals without accounting for the broader market context. This often results in erratic "Flip-Flop" behavior, where signals are triggered indiscriminately regardless of the prevailing volatility regime.
Impulse Reactor was engineered to address this limitation by unifying two critical requirements: Quantitative Rigor and Execution Flexibility.
The Solution
Composite Analytical Framework This script is not a simple visual overlay of existing indicators. It is an algorithmic synthesis designed to function as a unified decision-making engine. The primary objective was to implement rigorous quantitative analysis (Volatility Normalization, Structural Filtering) directly within an alert-enabled framework. This architecture is designed to process signals through strict, multi-factor validation protocols before generating real-time notifications, allowing users to focus on structurally validated setups without manual monitoring.
How It Works
This is not a simple visual mashup. It utilizes a cross-validation algorithm where the Trend Structure acts as a gatekeeper for Momentum signals:
Logic over Lag: Unlike simple moving average crossovers, this script uses a 15-layer Gradient Ribbon to detect "Laminar Flow." If the ribbon is knotted (Compression), the system mathematically suppresses all signals.
Volatility Normalization: The core calculation adapts to ATR (Average True Range). This means the indicator automatically expands in volatile markets and contracts in quiet ones, maintaining accuracy without constant manual tweaking.
Adaptive Signal Thresholding: It incorporates an 'Anti-Greed' algorithm (Dynamic Thresholding) that automatically adjusts entry criteria based on trend duration. This logic aims to mitigate the risk of entering positions during periods of statistical trend exhaustion.
Why Use It?
Market State Decoding: The gradient Ribbon visualizes the underlying trend phase in real-time.
◦ Cyan/Blue Flow: Strong Bullish Trend (Laminar Flow).
◦ Magenta/Pink Flow: Strong Bearish Trend.
◦ Compressed/Knotted: When the ribbon lines are tightly squeezed or overlapping, it signals Consolidation. The system filters signals here to avoid chop.
Noise Reduction: The goal is not to catch every pivot, but to isolate high-confidence setups. The logic explicitly filters out minor fluctuations to help maintain position alignment with the broader trend.
⚖️ Chapter 1: System Architecture
Introduction: Composite Analytical Framework
System Overview
Impulse Reactor serves as a comprehensive technical analysis engine designed to synthesize three distinct market dimensions—Momentum, Volatility, and Trend Structure—into a unified decision-making framework. Unlike traditional methods that analyze these metrics in isolation, this system functions as a central processing unit that integrates disparate data streams to construct a coherent model of market behavior.
Operational Objective
The primary objective is to transition from single-dimensional signal generation to a multi-factor assessment model. By fusing data from the Impulse Core (Volatility), Gradient Oscillator (Momentum), and Structural Baseline (Trend), the system aims to filter out stochastic noise and identify high-probability trade setups grounded in quantitative confluence.
Market Microstructure Analysis: Limitations of Conventional Models
Extensive backtesting and quantitative analysis have identified three critical inefficiencies in standard oscillator-based strategies:
• Bounded Oscillator Limitations (The "Oscillation Trap"): Traditional indicators such as RSI or Stochastics are mathematically constrained between fixed values (0 to 100). In strong trending environments, these metrics often saturate in "overbought" or "oversold" zones. Consequently, traders relying on static thresholds frequently exit structurally valid positions prematurely or initiate counter-trend trades against prevailing momentum, resulting in suboptimal performance.
• Quantitative Blindness to Quality: Standard moving averages and trend indicators often fail to distinguish the qualitative nature of price movement. They treat low-volume drift and high-velocity expansion identically. This inability to account for "Volatility Quality" leads to delayed responsiveness during critical market events.
• Fractal Dissonance (Timeframe Disconnect): Financial markets exhibit fractal characteristics where trends on lower timeframes may contradict higher timeframe structures. Manual integration of multi-timeframe analysis increases cognitive load and susceptibility to human error, often resulting in conflicting biases at the point of execution.
Core Design Principles
To mitigate the aforementioned systemic inefficiencies, Impulse Reactor employs a modular architecture governed by three foundational principles:
Principle A:
Volatility Precursor Analysis Market mechanics demonstrate that volatility expansion often functions as a leading indicator for directional price movement. The system is engineered to detect "Volatility Deviation" — specifically, the divergence between short-term and long-term volatility baselines—prior to its manifestation in price action. This allows for entry timing aligned with the expansion phase of market volatility.
Principle B:
Momentum Density Visualization The system replaces singular momentum lines with a "Momentum Density" model utilizing a 15-layer Simple Moving Average (SMA) Ribbon.
• Concept: This visualization represents the aggregate strength and consistency of the trend.
• Application: A fully aligned and expanded ribbon indicates a robust trend structure ("Laminar Flow") capable of withstanding minor counter-trend noise, whereas a compressed ribbon signals consolidation or structural weakness.
Principle C:
Adaptive Confluence Protocols Signal validity is strictly governed by a multi-dimensional confluence logic. The system suppresses signal generation unless there is synchronized confirmation across all three analytical vectors:
1. Volatility: Confirmed expansion via the Impulse Core.
2. Momentum: Directional alignment via the Hybrid Oscillator.
3. Structure: Trend validation via the Baseline. This strict filtering mechanism significantly reduces false positives in non-trending (choppy) environments while maintaining sensitivity to genuine breakouts.
🔍 Chapter 2: Core Modules & Algorithmic Logic
Module A: Impulse Core (Normalized Volatility Deviation)
Operational Logic The Impulse Core functions as a volatility-normalized momentum gauge rather than a standard oscillator. It is designed to identify "Volatility Contraction" (Squeeze) and "Volatility Expansion" phases by quantifying the divergence between short-term and long-term volatility states.
Volatility Z-Score Normalization
The formula implements a custom normalization algorithm. Unlike standard oscillators that rely on absolute price changes, this logic calculates the Z-Score of the Volatility Spread.
◦ Numerator: (atr_f - atr_s) captures the raw momentum of volatility expansion.
◦ Denominator: (std_f + 1e-6) standardizes this value against historical variance.
◦ Result: This allows the indicator scales consistently across assets (e.g., Bitcoin vs. Euro) without manual recalibration.
f_impulse() =>
atr_f = ta.atr(fastLen) // Fast Volatility Baseline
atr_s = ta.atr(slowLen) // Slow Volatility Baseline
std_f = ta.stdev(atr_f, devLen) // Volatility Standard Deviation
(atr_f - atr_s) / (std_f + 1e-6) // Normalized Differential Calculation
Algorithmic Framework
• Differential Calculation: The system computes the spread between a Fast Volatility Baseline (ATR-10) and a Slow Volatility Baseline (ATR-30).
• Normalization Protocol: To standardize consistency across diverse asset classes (e.g., Forex vs. Crypto), the raw differential is divided by the standard deviation of the volatility itself over a 30-period lookback.
• Signal Generation:
◦ Contraction (Squeeze): When the Fast ATR compresses below the Slow ATR, it registers a potential volatility buildup phase.
◦ Expansion (Release): A rapid divergence of the Fast ATR above the Slow ATR signals a confirmed volatility expansion, validating the strength of the move.
Module B: Gradient Oscillator (RSI-SMA Hybrid)
Design Rationale To mitigate the "noise" and "false reversal" signals common in single-line oscillators (like standard RSI), this module utilizes a 15-Layer Gradient Ribbon to visualize momentum density and persistence.
Technical Architecture
• Ribbon Array: The system generates 15 sequential Simple Moving Averages (SMA) applied to a volatility-adjusted RSI source. The length of each layer increases incrementally.
• State Analysis:
Momentum Alignment (Laminar Flow): When all 15 layers are expanded and parallel, it indicates a robust trend where buying/selling pressure is distributed evenly across multiple timeframes. This state helps filter out premature "overbought/oversold" signals.
• Consolidation (Compression): When the distance between the fastest layer (Layer 1) and the slowest layer (Layer 15) approaches zero or the layers intersect, the system identifies a "Non-Tradable Zone," preventing entries during choppy market conditions.
// Laminar Flow Validation
f_validate_trend() =>
// Calculate spread between Ribbon layers
ribbon_spread = ta.stdev(ribbon_array, 15)
// Only allow signals if Ribbon is expanded (Laminar Flow)
is_flowing = ribbon_spread > min_expansion_threshold
// If compressed (Knotted), force signal to false
is_flowing ? signal : na
Module C: Adaptive Signal Filtering (Behavioral Bias Mitigation)
This subsystem, operating as an algorithmic "Anti-Greed" Mechanism, addresses the statistical tendency for signal degradation following prolonged trends.
Dynamic Threshold Adjustment
• Win Streak Detection: The algorithm internally tracks the outcome of closed trade cycles.
• Sensitivity Multiplier: Upon detecting consecutive successful signals in the same direction, a Penalty_Factor is applied to the entry logic.
• Operational Impact: This effectively raises the Required_Slope threshold for subsequent signals. For example, after three consecutive bullish signals, the system requires a 30% steeper trend angle to validate a fourth entry. This enforces stricter discipline during extended trends to reduce the probability of entering at the point of trend exhaustion.
Anti-Greed Logic: Dynamic Threshold Calculation
f_adjust_threshold(base_slope, win_streak) =>
// Adds a 10% penalty to the difficulty for every consecutive win
penalty_factor = 0.10
risk_scaler = 1 + (win_streak * penalty_factor)
// Returns the new, harder-to-reach threshold
base_slope * risk_scaler
Module D: Trend Baseline (Triple-Smoothed Structure)
The Trend Baseline serves as the structural filter for all signals. It employs a Triple-Smoothed Hybrid Algorithm designed to balance lag reduction with noise filtration.
Smoothing Stages
1. Volatility Banding: Utilizes a SuperTrend-based calculation to establish the upper and lower boundaries of price action.
2. Weighted Filter: Applies a Weighted Moving Average (WMA) to prioritize recent price data.
3. Exponential Smoothing: A final Exponential Moving Average (EMA) pass is applied to create a seamless baseline curve.
Functionality
This "Heavy" baseline resists minor intraday volatility spikes while remaining responsive to sustained structural shifts. A signal is only considered valid if the price action maintains structural integrity relative to this baseline
🚦 Chapter 3: Risk Management & Exit Protocols
Quantitative Risk Management (TP/SL & Trailing)
Foundational Architecture: Volatility-Adjusted Geometry Unlike strategies relying on static nominal values, Impulse Reactor establishes dynamic risk boundaries derived from quantitative volatility metrics. This design aligns trade invalidation levels mathematically with the current market regime.
• ATR-Based Dynamic Bracketing:
The protocol calculates Stop-Loss and Take-Profit levels by applying Fibonacci coefficients (Default: 0.786 for SL / 1.618 for TP) to the Average True Range (ATR).
◦ High Volatility Environments: The risk bands automatically expand to accommodate wider variance, preventing premature exits caused by standard market noise.
◦ Low Volatility Environments: The bands contract to tighten risk parameters, thereby dynamically adjusting the Risk-to-Reward (R:R) geometry.
• Close-Validation Protocol ("Soft Stop"):
Institutional algorithms frequently execute liquidity sweeps—driving prices briefly below key support levels to accumulate inventory.
◦ Mechanism: When the "Soft Stop" feature is enabled, the system filters out intraday volatility spikes. The stop-loss is conditional; execution is triggered only if the candle closes beyond the invalidation threshold.
◦ Strategic Advantage: This logic distinguishes between momentary price wicks and genuine structural breakdowns, preserving positions during transient volatility.
• Step-Function Trailing Mechanism:
To protect unrealized PnL while allowing for normal price breathing, a two-phase trailing methodology is employed:
◦ Phase 1 (Activation): The trailing function remains dormant until the price advances by a pre-defined percentage threshold.
◦ Phase 2 (Dynamic Floor): Once armed, the stop level creates a moving floor, adjusting relative to price action while maintaining a volatility-based (ATR) buffer to systematically protect unrealized PnL.
• Algorithmic Exit Protocols (Dynamic Liquidity Analysis)
◦ Rationale: Inefficiencies of Static Targets Static "Take Profit" levels often result in suboptimal exits. They compel traders to close positions based on arbitrary figures rather than evolving market structure, potentially capping upside during significant trends or retaining positions while the underlying trend structure deteriorates.
◦ Solution: Structural Integrity Assessment The system utilizes a Dynamic Liquidity Engine to continuously audit the validity of the position. Instead of targeting a specific price point, the algorithm evaluates whether the trend remains statistically robust.
Multi-Factor Exit Logic (The Tri-Vector System)
The Smart Exit protocol executes only when specific algorithmic invalidation criteria are met:
• 1. Momentum Exhaustion (Confluence Decay): The system monitors a 168-hour rolling average of the Confluence Score. A significant deviation below this historical baseline indicates momentum exhaustion, signaling that the driving force behind the trend has dissipated prior to a price reversal. This enables preemptive exits before a potential drawdown.
• 2. Statistical Over-Extension (Mean Reversion): Utilizing the core volatility logic, the system identifies instances where price deviates beyond 2.0 standard deviations from the mean. While the trend may be technically bullish, this statistical anomaly suggests a high probability of mean reversion (elastic snap-back), triggering a defensive exit to capitalize on peak valuation.
• 3. Oscillator Rejection (Immediate Pivot): To manage sudden V-shaped volatility, the system monitors RSI pivots. If a sharp "Pivot High" or divergence is detected, the protocol triggers an immediate "Peak Exit," bypassing standard trend filters to secure liquidity during high-velocity reversals.
🎨 Chapter 4: Visualization Guide
Gradient Oscillator Ribbon
The 15-layer SMA ribbon visualized via plot(r1...r15) represents the "Momentum Density" of the market.
• Visuals:
◦ Cyan/Blue Ribbon: Indicates Bullish Momentum.
◦ Pink/Magenta Ribbon: Indicates Bearish Momentum.
• Interpretation:
◦ Laminar Flow: When the ribbon expands widely and flows in parallel, it signifies a robust trend where momentum is distributed evenly across timeframes. This is the ideal state for trend-following.
◦ Compression (Consolidation): If the ribbon becomes narrow, twisted, or knotted, it indicates a "Non-Tradable Zone" where the market lacks a unified direction. Traders are advised to wait for clarity.
◦ Over-Extension: If the top layer crosses the Overbought (85) or Oversold (15) lines, it visually warns of potential market overheating.
Trend Baseline
The thick, color-changing line plotted via plot(baseline) represents the Structural Backbone of the market.
• Visuals: Changes color based on the trend direction (Blue for Bullish, Pink for Bearish).
• Interpretation:
Structural Filter: Long positions are statistically favored only when price action sustains above this baseline, while short positions are favored below it.
Dynamic Support/Resistance: The baseline acts as a dynamic support level during uptrends and resistance during downtrends.
Entry Signals & Labels
Text labels ("Long Entry", "Short Entry") appear when the system detects high-probability setups grounded in quantitative confluence.
• Visuals: Labeled signals appear above/below specific candles.
• Interpretation:
These signals represent moments where Volatility (Expansion), Momentum (Alignment), and Structure (Trend) are synchronized.
Smart Exit: Labels such as "Smart Exit" or "Peak Exit" appear when the system detects momentum exhaustion or structural decay, prompting a defensive exit to preserve capital.
Dynamic TP/SL Boxes
The semi-transparent colored zones drawn via fill() represent the risk management geometry.
• Visuals: Colored boxes extending from the entry point to the Take Profit (TP) and Stop Loss (SL) levels.
• Function:
Volatility-Adjusted Geometry: Unlike static price targets, these boxes expand during high volatility (to prevent wicks from stopping you out) and contract during low volatility (to optimize Risk-to-Reward ratios).
SAR + MACD Glow
Small glowing shapes appearing above or below candles.
• Visuals: Triangle or circle glows near the price bars.
• Interpretation:
This visual indicates a secondary confirmation where Parabolic SAR and MACD align with the main trend direction. It serves as an additional confluence factor to increase confidence in the trade setup.
Support/Resistance Table
A small table located at the bottom-right of the chart.
• Function: Automatically identifies and displays recent Pivot Highs (Resistance) and Pivot Lows (Support).
• Interpretation: These levels can be used as potential targets for Take Profit or invalidation points for manual Stop Loss adjustments.
🖥️ Chapter 5: Dashboard & Operational Guide
Integrated Analytics Panel (Dashboard Overview)
To facilitate rapid decision-making without manual calculation, the system aggregates critical market dimensions into a unified "Heads-Up Display" (HUD). This panel monitors real-time metrics across multiple timeframes and analytical vectors.
A. Intermediate Structure (12H Trend)
• Function: Anchors the intraday analysis to the broader market structure using a 12-hour rolling window.
• Interpretation:
◦ Bullish (> +0.5%): Indicates a positive structural bias. Long setups align with the macro flow.
◦ Bearish (< -0.5%): Indicates structural weakness. Short setups are statistically favored.
◦ Neutral: Represents a ranging environment where the Confluence Score becomes the primary weighting factor.
B. Composite Confluence Score (Signal Confidence)
• Definition: A probability metric derived from the synchronization of Volatility (Impulse Core), Momentum (Ribbon), and Trend (Baseline).
• Grading Scale:
Strong Buy/Sell (> 7.0 / < 3.0): Indicates full alignment across all three vectors. Represents a "Prime Setup" eligible for standard position sizing.
Buy/Sell (5.0–7.0 / 3.0–5.0): Indicates a valid trend but with moderate volatility confirmation.
Neutral: Signals conflicting data (e.g., Bullish Momentum vs. Bearish Structure). Trading is not recommended ("No-Trade Zone").
C. Statistical Deviation Status (Mean Reversion)
• Logic: Utilizes Bollinger Band deviation principles to quantify how far price has stretched from the statistical mean (20 SMA).
• Alert States:
Over-Extended (> 2.0 SD): Warning that price is statistically likely to revert to the mean (Elastic Snap-back), even if the trend remains technically valid. New entries are discouraged in this zone.
Normal: Price is within standard distribution limits, suitable for trend-following entries.
D. Volatility Regime Classification
• Metric: Compares current ATR against a 100-period historical baseline to categorize the market state.
• Regimes:
Low Volatility (Lvl < 1.0): Market Compression. Often precedes volatility expansion events.
Mid Volatility (Lvl 1.0 - 1.5): Standard operating environment.
High Volatility (Lvl > 1.5): Elevated market stress. Risk parameters should be adjusted (e.g., reduced position size) to account for increased variance.
E. Performance Telemetry
• Function: Displays the historical reliability of the Trend Baseline for the current asset and timeframe.
• Operational Threshold: If the displayed Win Rate falls below 40%, it suggests the current market behavior is incoherent (choppy) and does not respect trend logic. In such cases, switching assets or timeframes is recommended.
Operational Protocols & Signal Decoding
Visual Interpretation Standards
• Laminar Flow (Trade Confirmation): A valid trend is visually confirmed when the 15-layer SMA Ribbon is fully expanded and parallel. This indicates distributed momentum across timeframes.
• Consolidation (No-Trade): If the ribbon appears twisted, knotted, or compressed, the market lacks a unified directional vector.
• Baseline Interaction: The Triple-Smoothed Baseline acts as a dynamic support/resistance filter. Long positions remain valid only while price sustains above this structure.
System Calibration (Settings)
• Adaptive Signal Filtering (Prev. Anti-Greed): Enabled by default. This logic automatically raises the required trend slope threshold following consecutive wins to mitigate behavioral bias.
• Impulse Sensitivity: Controls the reactivity of the Volatility Core. Higher settings capture faster moves but may introduce more noise.
⚙️ Chapter 6: System Configuration & Alert Guide
This section provides a complete breakdown of every adjustable setting within Impulse Reactor to assist you in tailoring the engine to your specific needs.
🌐 LANGUAGE SETTINGS (Localization)
◦ Select Language (Default: English):
Function: Instantly translates all chart labels, dashboard texts into your preferred language.
Supported: English, Korean, Chinese, Spanish
⚡ IMPULSE CORE SETTINGS (Volatility Engine)
◦ Deviation Lookback (Default: 30): The period used to calculate the standard deviation of volatility.
Role: Sets the baseline for normalizing momentum. Higher values make the core smoother but slower to react.
◦ Fast Pulse Length (Default: 10): The short-term ATR period.
Role: Detects rapid volatility expansion.
◦ Slow Pulse Length (Default: 30): The long-term ATR baseline.
Role: Establishes the background volatility level. The core signal is derived from the divergence between Fast and Slow pulses.
🎯 TP/SL SETTINGS (Risk Management)
◦ SL/TP Fibonacci (Default: 0.786 / 1.618): Selects the Fibonacci ratio used for risk calculation.
◦ SL/TP Multiplier (Default: 1.5 / 2): Applies a multiplier to the ATR-based bands.
Role: Expands or contracts the Take Profit and Stop Loss boxes. Increase these values for higher volatility assets (like Altcoins) to avoid premature stop-outs.
◦ ATR Length (Default: 14): The lookback period for calculating the Average True Range used in risk geometry.
◦ Use Soft Stop (Close Basis):
Role: If enabled, Stop Loss alerts only trigger if a candle closes beyond the invalidation level. This prevents being stopped out by wick manipulations.
🔊 RIBBON SETTINGS (Momentum Visualization)
◦ Show SMA Ribbon: Toggles the visibility of the 15-layer gradient ribbon.
◦ Ribbon Line Count (Default: 15): The number of SMA lines in the ribbon array.
◦ Ribbon Start Length (Default: 2) & Step (Default: 1): Defines the spread of the ribbon.
Role: Controls the "thickness" of the momentum density visualization. A wider step creates a broader ribbon, useful for higher timeframes.
📎 DISPLAY OPTIONS
◦ Show Entry Lines / TP/SL Box / Position Labels / S/R Levels / Dashboard: Toggles individual visual elements on the chart to reduce clutter.
◦ Show SAR+MACD Glow: Enables the secondary confirmation shapes (triangles/circles) above/below candles.
📈 TREND BASELINE (Structural Filter)
◦ Supertrend Factor (Default: 12) & ATR Period (Default: 90): Controls the sensitivity of the underlying Supertrend algorithm used for the baseline calculation.
◦ WMA Length (40) & EMA Length (14): The smoothing periods for the Triple-Smoothed Baseline.
◦ Min Trend Duration (Default: 10): The minimum number of bars the trend must be established before a signal is considered valid.
🧠 SMART EXIT (Dynamic Liquidity)
◦ Use Smart Exit: Enables the momentum exhaustion logic.
◦ Exit Threshold Score (Default: 3): The sensitivity level for triggering a Smart Exit. Lower values trigger earlier exits.
◦ Average Period (168) & Min Hold Bars (5): Defines the rolling window for momentum decay analysis and the minimum duration a trade must be held before Smart Exit logic activates.
🛡️ TRAILING STOP (Step)
◦ Use Trailing Stop: Activates the step-function trailing mechanism.
◦ Step 1 Activation % (0.5) & Offset % (0.5): The price must move 0.5% in your favor to arm the first trail level, which sets a stop 0.5% behind price.
◦ Step 2 Activation % (1) & Offset % (0.2): Once price moves 1%, the trail tightens to 0.2%, securing the position.
🌀 SAR & MACD SETTINGS (Secondary Confirmation)
◦ SAR Start/Increment/Max: Standard Parabolic SAR parameters.
◦ SAR Score Scaling (ATR): Adjusts how much weight the SAR signal has in the overall confluence score.
◦ MACD Fast/Slow/Signal: Standard MACD parameters used for the "Glow" signals.
🔄 ANTI-GREED LOGIC (Behavioral Bias)
◦ Strict Entry after Win: Enables the negative feedback loop.
◦ Strict Multiplier (Default: 1.1): Increases the entry difficulty by 10% after each win.
Role: Prevents overtrading and entering at the top of an extended trend.
🌍 HTF FILTER (Multi-Timeframe)
◦ Use Auto-Adaptive HTF Filter: Automatically selects a higher timeframe (e.g., 1H -> 4H) to filter signals.
◦ Bypass HTF on Steep Trigger: Allows an entry even against the HTF trend if the local momentum slope is exceptionally steep (catch powerful reversals).
📉 RSI PEAK & CHOPPINESS
◦ RSI Peak Exit (Instant): Triggers an immediate exit if a sharp RSI pivot (V-shape) is detected.
◦ Choppiness Filter: Suppresses signals if the Choppiness Index is above the threshold (Default: 60), indicating a flat market.
📐 SLOPE TRIGGER LOGIC
◦ Force Entry on Steep Slope: Overrides other filters if the price angle is extremely vertical (high velocity).
◦ Slope Sensitivity (1.5): The angle required to trigger this override.
⛔ FLAT MARKET FILTER (ADX & ATR)
◦ Use ADX Filter: Blocks signals if ADX is below the threshold (Default: 20), indicating no trend.
◦ Use ATR Flat Filter: Blocks signals if volatility drops below a critical level (dead market).
🔔 Alert Configuration Guide
Impulse Reactor is designed with a comprehensive suite of alert conditions, allowing you to automate your trading or receive real-time notifications for specific market events.
How to Set Up:
Click the "Alert" (Clock) icon in the TradingView toolbar.
Select "Impulse Reactor " from the Condition dropdown.
Choose one of the specific trigger conditions below:
🚀 Entry Signals (Trend Initiation)
Long Entry:
Trigger: Fires when a confirmed Bullish Setup is detected (Momentum + Volatility + Structure align).
Usage: Use this to enter new Long positions.
Short Entry:
Trigger: Fires when a confirmed Bearish Setup is detected.
Usage: Use this to enter new Short positions.
🎯 Profit Taking (Target Levels)
Long TP:
Trigger: Fires when price hits the calculated Take Profit level for a Long trade.
Usage: Automate partial or full profit taking.
Short TP:
Trigger: Fires when price hits the calculated Take Profit level for a Short trade.
Usage: Automate partial or full profit taking.
🛡️ Defensive Exits (Risk Management)
Smart Exit:
Trigger: Fires when the system detects momentum decay or statistical exhaustion (even if the trend hasn't fully reversed).
Usage: Recommended for tightening stops or closing positions early to preserve gains.
Overbought / Oversold:
Trigger: Fires when the ribbon extends into extreme zones.
Usage: Warning signal to prepare for a potential reversal or pullback.
💡 Secondary Confirmation (Confluence)
SAR+MACD Bullish:
Trigger: Fires when Parabolic SAR and MACD align bullishly with the main trend.
Usage: Ideal for Pyramiding (adding to an existing winning position).
SAR+MACD Bearish:
Trigger: Fires when Parabolic SAR and MACD align bearishly.
Usage: Ideal for adding to short positions.
⚠️ Chapter 7: Conclusion & Risk Disclosure
Methodological Synthesis
Impulse Reactor represents a shift from reactive price tracking to proactive energy analysis. By decomposing market activity into its atomic components — Volatility, Momentum, and Structure — and reconstructing them into a coherent decision model, the system aims to provide a quantitative framework for market engagement. It is designed not to predict the future, but to identify high-probability conditions where kinetic energy and trend structure align.
Disclaimer & Risk Warnings
◦ Educational Purpose Only
This indicator, including all associated code, documentation, and visual outputs, is provided strictly for educational and informational purposes. It does not constitute financial advice, investment recommendations, or a solicitation to buy or sell any financial instruments.
◦ No Guarantee of Performance
Past performance is not indicative of future results. All metrics displayed on the dashboard (including "Win Rate" and "P&L") are theoretical calculations based on historical data. These figures do not account for real-world trading factors such as slippage, liquidity gaps, spread costs, or broker commissions.
◦ High-Risk Warning
Trading cryptocurrencies, futures, and leveraged financial products involves a substantial risk of loss. The use of leverage can amplify both gains and losses. Users acknowledge that they are solely responsible for their trading decisions and should conduct independent due diligence before executing any trades.
◦ Software Limitations
The software is provided "as is" without warranty. Users should be aware that market data feeds on analysis platforms may experience latency or outages, which can affect signal generation accuracy.

RSI + MACD Day Trading Toolkit//@version=6
indicator("RSI + MACD Day Trading Toolkit", overlay = true)
//──────────────────────────────────────────────────────────────────────────────
// 1. INPUTS
//──────────────────────────────────────────────────────────────────────────────
// RSI settings
rsiLength = input.int(14, "RSI Length")
rsiOverbought = input.float(70, "RSI Overbought Level", minval = 50, maxval = 100)
rsiOversold = input.float(30, "RSI Oversold Level", minval = 0, maxval = 50)
// MACD settings (classic 12 / 26 / 9)
macdFastLength = input.int(12, "MACD Fast Length")
macdSlowLength = input.int(26, "MACD Slow Length")
macdSignalLength = input.int(9, "MACD Signal Length")
// Risk model selection
riskModel = input.string("ATR", "Risk Model", options = )
// ATR-based SL/TP
atrLength = input.int(14, "ATR Length")
atrSLMult = input.float(1.5, "SL ATR Multiplier", minval = 0.1, step = 0.1)
atrTPMult = input.float(2.5, "TP ATR Multiplier", minval = 0.1, step = 0.1)
// Percent-based SL/TP (for scalping on very tight spreads)
slPercent = input.float(0.5, "SL % (when Risk Model = Percent)", minval = 0.05, step = 0.05)
tpPercent = input.float(1.0, "TP % (when Risk Model = Percent)", minval = 0.05, step = 0.05)
// Visual / styling
showSLTPLines = input.bool(true, "Plot Stop Loss / Take Profit Lines")
//──────────────────────────────────────────────────────────────────────────────
// 2. CORE INDICATORS: RSI & MACD
//──────────────────────────────────────────────────────────────────────────────
rsiValue = ta.rsi(close, rsiLength)
// Manual MACD calculation (avoids tuple unpacking issues)
macdFastEMA = ta.ema(close, macdFastLength)
macdSlowEMA = ta.ema(close, macdSlowLength)
macdValue = macdFastEMA - macdSlowEMA
macdSignal = ta.ema(macdValue, macdSignalLength)
macdHist = macdValue - macdSignal
atrValue = ta.atr(atrLength)
// Hide internal plots from price scale (still accessible if you change display)
plot(rsiValue, "RSI", display = display.none)
plot(macdValue, "MACD", display = display.none)
plot(macdSignal, "MACD Sig", display = display.none)
plot(macdHist, "MACD Hist", display = display.none)
//──────────────────────────────────────────────────────────────────────────────
// 3. SIGNAL LOGIC (ENTRY CONDITIONS)
//──────────────────────────────────────────────────────────────────────────────
//
// Idea:
// - LONG bias: RSI emerges from oversold AND MACD crosses above signal below zero
// - SHORT bias: RSI falls from overbought AND MACD crosses below signal above zero
//
// Combines momentum (RSI) with trend confirmation (MACD).
//──────────────────────────────────────────────────────────────────────────────
// RSI events
rsiBullCross = ta.crossover(rsiValue, rsiOversold) // RSI crosses UP out of oversold
rsiBearCross = ta.crossunder(rsiValue, rsiOverbought) // RSI crosses DOWN from overbought
// MACD crossover with trend filter
macdBullCross = ta.crossover(macdValue, macdSignal) and macdValue < 0 // Bullish cross below zero-line
macdBearCross = ta.crossunder(macdValue, macdSignal) and macdValue > 0 // Bearish cross above zero-line
// Raw (ungated) entry signals
rawLongSignal = rsiBullCross and macdBullCross
rawShortSignal = rsiBearCross and macdBearCross
//──────────────────────────────────────────────────────────────────────────────
// 4. STATE MANAGEMENT (SIMULATED POSITION TRACKING)
//──────────────────────────────────────────────────────────────────────────────
//
// position: 1 = long
// -1 = short
// 0 = flat
//
// We track entry price and SL/TP levels as if this were a strategy.
// This is still an indicator – it just computes and plots the logic.
//──────────────────────────────────────────────────────────────────────────────
var int position = 0
var float longEntryPrice = na
var float shortEntryPrice = na
var float longSL = na
var float longTP = na
var float shortSL = na
var float shortTP = na
// Per-bar flags (for plotting / alerts)
var bool longEntrySignal = false
var bool shortEntrySignal = false
var bool longExitSignal = false
var bool shortExitSignal = false
// Reset per-bar flags each bar
longEntrySignal := false
shortEntrySignal := false
longExitSignal := false
shortExitSignal := false
//──────────────────────────────────────────────────────────────────────────────
// 5. EXIT LOGIC (STOP LOSS / TAKE PROFIT / OPPOSITE SIGNAL)
//──────────────────────────────────────────────────────────────────────────────
//
// Exits are evaluated BEFORE new entries on each bar.
//──────────────────────────────────────────────────────────────────────────────
// Stop-loss / take-profit hits for existing positions
longStopHit = position == 1 and not na(longSL) and low <= longSL
longTakeHit = position == 1 and not na(longTP) and high >= longTP
shortStopHit = position == -1 and not na(shortSL) and high >= shortSL
shortTakeHit = position == -1 and not na(shortTP) and low <= shortTP
// Opposite signals can also close positions
reverseToShort = position == 1 and rawShortSignal
reverseToLong = position == -1 and rawLongSignal
// Combine exit conditions
longExitNow = longStopHit or longTakeHit or reverseToShort
shortExitNow = shortStopHit or shortTakeHit or reverseToLong
// Register exits and flatten position
if longExitNow and position == 1
longExitSignal := true
position := 0
longEntryPrice := na
longSL := na
longTP := na
if shortExitNow and position == -1
shortExitSignal := true
position := 0
shortEntryPrice := na
shortSL := na
shortTP := na
//──────────────────────────────────────────────────────────────────────────────
// 6. ENTRY LOGIC WITH RISK MODEL (SL/TP CALCULATION)
//──────────────────────────────────────────────────────────────────────────────
//
// Only take a new trade when flat.
// SL/TP are calculated relative to entry price using either ATR or Percent.
//──────────────────────────────────────────────────────────────────────────────
if position == 0
// Long entry
if rawLongSignal
position := 1
longEntryPrice := close
if riskModel == "ATR"
longSL := longEntryPrice - atrValue * atrSLMult
longTP := longEntryPrice + atrValue * atrTPMult
else // Percent model
longSL := longEntryPrice * (1.0 - slPercent / 100.0)
longTP := longEntryPrice * (1.0 + tpPercent / 100.0)
longEntrySignal := true
// Short entry
else if rawShortSignal
position := -1
shortEntryPrice := close
if riskModel == "ATR"
shortSL := shortEntryPrice + atrValue * atrSLMult
shortTP := shortEntryPrice - atrValue * atrTPMult
else // Percent model
shortSL := shortEntryPrice * (1.0 + slPercent / 100.0)
shortTP := shortEntryPrice * (1.0 - tpPercent / 100.0)
shortEntrySignal := true
//──────────────────────────────────────────────────────────────────────────────
// 7. PLOTTING: ENTRIES, EXITS, STOPS & TARGETS
//──────────────────────────────────────────────────────────────────────────────
// Entry markers
plotshape(longEntrySignal, title = "Long Entry", style = shape.triangleup, location = location.belowbar, color = color.new(color.lime, 0), size = size.small, text = "LONG")
plotshape(shortEntrySignal, title = "Short Entry", style = shape.triangledown, location = location.abovebar, color = color.new(color.red, 0), size = size.small, text = "SHORT")
// Exit markers (generic exits: SL, TP or reversal)
plotshape(longExitSignal, title = "Long Exit", style = shape.xcross, location = location.abovebar, color = color.new(color.orange, 0), size = size.tiny, text = "LX")
plotshape(shortExitSignal, title = "Short Exit", style = shape.xcross, location = location.belowbar, color = color.new(color.orange, 0), size = size.tiny, text = "SX")
// Optional: show SL/TP levels on chart while in position
plot(showSLTPLines and position == 1 ? longSL : na, title = "Long Stop Loss", style = plot.style_linebr, color = color.new(color.red, 0), linewidth = 1)
plot(showSLTPLines and position == 1 ? longTP : na, title = "Long Take Profit", style = plot.style_linebr, color = color.new(color.lime, 0), linewidth = 1)
plot(showSLTPLines and position == -1 ? shortSL : na, title = "Short Stop Loss", style = plot.style_linebr, color = color.new(color.red, 0), linewidth = 1)
plot(showSLTPLines and position == -1 ? shortTP : na, title = "Short Take Profit", style = plot.style_linebr, color = color.new(color.lime, 0), linewidth = 1)
//──────────────────────────────────────────────────────────────────────────────
// 8. ALERT CONDITIONS
//──────────────────────────────────────────────────────────────────────────────
//
// Configure TradingView alerts using these conditions.
//──────────────────────────────────────────────────────────────────────────────
// Entry alerts
alertcondition(longEntrySignal, title = "Long Entry (RSI+MACD)", message = "RSI+MACD: Long entry signal")
alertcondition(shortEntrySignal, title = "Short Entry (RSI+MACD)", message = "RSI+MACD: Short entry signal")
// Exit alerts (by type: SL vs TP vs reversal)
alertcondition(longStopHit, title = "Long Stop Loss Hit", message = "RSI+MACD: Long STOP LOSS hit")
alertcondition(longTakeHit, title = "Long Take Profit Hit", message = "RSI+MACD: Long TAKE PROFIT hit")
alertcondition(shortStopHit, title = "Short Stop Loss Hit", message = "RSI+MACD: Short STOP LOSS hit")
alertcondition(shortTakeHit, title = "Short Take Profit Hit", message = "RSI+MACD: Short TAKE PROFIT hit")
alertcondition(reverseToShort, title = "Long Exit by Reverse Signal", message = "RSI+MACD: Long exit by SHORT reverse signal")
alertcondition(reverseToLong, title = "Short Exit by Reverse Signal", message = "RSI+MACD: Short exit by LONG reverse signal")
//──────────────────────────────────────────────────────────────────────────────
// 9. QUICK USAGE NOTES
//──────────────────────────────────────────────────────────────────────────────
//
// - Indicador, não estratégia: ele simula posição, SL/TP e sinais de saída.
// - Para backtest/auto, basta portar a mesma lógica para um script `strategy()`
// usando `strategy.entry` e `strategy.exit`.
// - Em day trade, teste ATR vs Percent e ajuste os multiplicadores ao ativo.
//──────────────────────────────────────────────────────────────────────────────

All Macro LevelsA comprehensive overlay indicator that displays key macro-level support and resistance zones using widely-followed moving averages across multiple timeframes.
Features
Bull Market Support Band (BMSB)
- Weekly 20 SMA and 21 EMA with customizable fill
- A popular indicator for identifying bull market trends - price holding above the band typically signals strength
Daily 12/21/25 EMA Bands
- Three daily EMAs (12, 21, 25) with fill between the outer bands
- Useful for tracking short-term momentum and trend direction
Long-Term Weekly Moving Averages
- 100-Week MA - Intermediate cycle support
- 200-Week MA - Major cycle support level
- 300-Week MA - Deep value zone
- Each MA can be configured as SMA or EMA
Customization
- Toggle each indicator group on/off independently
- Full color customization for lines, fills, and labels
- Adjustable line widths
- Optional custom symbol input to display levels from a different asset
- Real-time labels showing current values at chart edge
Use Cases
- Identify macro support/resistance levels
- Spot potential buy zones during corrections
- Confirm bull/bear market conditions
- Multi-timeframe analysis on a single chart

Helix Protocol 7HELIX PROTOCOL 7
Overview
Helix Protocol 7 is an advanced trend-adaptive signal engine that dynamically adjusts its buy/sell thresholds based on real-time market regime detection. Unlike static indicators that use fixed overbought/oversold levels, Helix 7 recognizes that optimal entry and exit points shift dramatically depending on whether the market is trending strongly, ranging, or reversing.
The indicator fuses multiple analytical frameworks—momentum oscillators, trend strength metrics, volatility analysis, volume confirmation, and price structure—into a unified signal system that adapts to changing market conditions in real-time.
Core Philosophy
"Don't fight the trend—adapt to it."
In a strong uptrend, you want to buy dips early (before extreme oversold) and let winners run longer
In a downtrend, you want to sell bounces quickly and only buy true capitulation
In a neutral/ranging market, standard overbought/oversold levels apply
Helix Protocol 7 automatically detects which regime you're in and applies the appropriate thresholds.
Key Features
🔄 Trend-Adaptive Signal Thresholds
The indicator classifies markets into four states and adjusts Fisher Transform and RSI thresholds accordingly:
Trend StateDetection CriteriaBUY TriggersSELL TriggersSTRONG UPTRENDADX rising, ADX > 25, +DI > -DIFisher < 1.0, RSI < 50Fisher > 2.5, RSI > 70STRONG DOWNTRENDADX rising, ADX > 25, -DI > +DIFisher < -2.5, RSI < 25Fisher > 1.5, RSI > 60WEAK DOWNTRENDADX falling, -DI > +DIFisher < -2.5, RSI < 25Fisher > 1.5, RSI > 60NEUTRALDefault fallbackFisher < -2.0, RSI < 30Fisher > 2.0, RSI > 65
📊 Dynamic Envelope Bands
Adaptive bands that expand and contract based on:
ATR (Average True Range) - Base volatility measure
ADX (Trend Strength) - Bands widen in strong trends
Chaikin Oscillator - Volume-weighted band adjustment
🎯 Multi-Trigger Signal System
Signals can fire from multiple sources:
Trend-Based Signals - Fisher + RSI thresholds met for current regime
Band Touch Signals - Price touches upper/lower band (support/resistance)
EXTREME Signals - Price penetrates band by significant amount (bypasses cooldown)
⚡ Extreme Move Detection
When price makes an explosive move that penetrates the band by more than 30% of ATR (configurable), the signal fires with EXTREME priority and bypasses the normal cooldown period. This ensures you never miss major reversal opportunities.
📈 GXS Scoring System
A proprietary multi-factor scoring system (-1.0 to +1.0) that weighs:
Trend Strength (30%) - ADX direction and magnitude
Momentum (25%) - RSI, MACD, Stochastic, CCI, ROC consensus
Volume (20%) - OBV trend and volume surge detection
Price Structure (15%) - Band position and volatility percentile
Price Action (10%) - Bullish/bearish candle ratio
🔀 RSI Divergence Detection
Automatically detects and displays:
Regular Bullish Divergence - Price lower low + RSI higher low (reversal up)
Regular Bearish Divergence - Price higher high + RSI lower high (reversal down)
Hidden Bullish Divergence - Trend continuation signal (uptrend)
Hidden Bearish Divergence - Trend continuation signal (downtrend)
📉 BBWP Volatility Meter
Bollinger Band Width Percentile measures current volatility relative to historical norms:
LOW (< 30%) - Volatility compression, breakout imminent
MEDIUM (30-70%) - Normal market conditions
HIGH (> 70%) - Extended volatility, potential exhaustion
Visual Components
Money Line
A dynamic centerline (Linear Regression or Weighted EMA) colored by slope:
🟢 Green - Rising (bullish momentum)
🔴 Red - Falling (bearish momentum)
🟡 Yellow - Flat (consolidation)
Envelope Cloud
Shaded region between upper and lower bands, colored by Money Line slope direction for instant trend visualization.
Signal Labels
Clear entry/exit labels showing:
Price level
Trigger type (UPTREND DIP, CAPITULATION, BAND TOUCH, EXTREME, etc.)
Color coding (Green=Buy, Red=Sell, Lime=Extreme Buy, Fuchsia=Extreme Sell)
ADX Trend Bar
Bottom indicator showing trend state:
🟢 Lime - Strong Uptrend
🔴 Red - Downtrend
🟠 Orange - Weak/Transitional (ADX 15-24)
⚪ White - Ranging (ADX < 15)
🔵 Blue - Strong trend, neutral direction
Info Panel
Real-time dashboard displaying:
Current trend state
GXS Score
Active divergences
Volatility level (BBWP)
ADX value and direction
DI Spread
Fisher Transform value
RSI value
Context-sensitive BUY/SELL thresholds for current regime
Alert System
JSON Webhook Alerts (Bot-Ready)
json{
"action": "BUY",
"symbol": "BTC/USDT",
"price": "93500.00",
"trigger": "EXTREME",
"rsi": "28.5",
"fisher": "-2.31",
"adx": "32.4",
"trend_state": "STRONG DOWN"
}
Available Alert Conditions
Buy Signal / Sell Signal
Lower Band Touch / Upper Band Touch
EXTREME Lower Band / EXTREME Upper Band
Strong Uptrend Started
Downtrend Started
Neutral Trend Started
Trend State Change
Recommended Settings
Scalping (1m-5m)
Signal Cooldown: 3-5 bars
Extreme Penetration: 0.2 (more sensitive)
ADX Length: 10-12
Swing Trading (15m-4H)
Signal Cooldown: 5-8 bars
Extreme Penetration: 0.3 (default)
ADX Length: 14 (default)
Position Trading (Daily+)
Signal Cooldown: 8-12 bars
Extreme Penetration: 0.4-0.5 (less sensitive)
ADX Length: 14-20
Input Parameters
Core Settings
Money Line Type (Linear Regression / Weighted EMA)
Money Line Length
RSI Period
Fisher Period
Dynamic Bands
ATR Period & Multiplier
Adaptive Bands toggle
Chaikin Weight
Extreme Band Penetration threshold
Trend Detection
ADX Length & Slope Lookback
Strong Trend ADX Threshold
DI Spread for Neutral detection
Signal Thresholds (by Trend State)
Fully customizable Fisher/RSI/ADX levels for each regime
Separate BUY and SELL parameters
Display Options
Toggle bands, cloud, labels, panels
Cooldown period
Debug panel for troubleshooting
Best Practices
Confirm with price action - Signals are high-probability setups, not guarantees
Respect the trend state - The panel shows current thresholds for a reason
Watch for EXTREME signals - These indicate significant reversals
Use divergences as confluence - Especially powerful at band touches
Monitor volatility - Low BBWP often precedes big moves
Version: 7.0
Author: ralis24

Advanced ICC Multi-Timeframe 1.0Advanced ICC Multi-Timeframe Trading System
A comprehensive implementation and interpretation of the Indication, Correction, Continuation (ICC) trading methodology made popular by Trades by Sci, enhanced with advanced multi-timeframe analysis and automation features.
⚠️ CRITICAL TRADING WARNINGS:
DO NOT blindly follow BUY/SELL signals from this indicator
This indicator shows potential entry points but YOU must validate each trade
PAPER TRADE EXTENSIVELY before risking real capital
BACKTEST THOROUGHLY on your chosen instruments and timeframes
The ICC methodology requires understanding and discretion - automated signals are guidance only
This tool aids analysis but does not replace proper trade planning, risk management, or trader judgment
⚠️ Important Disclaimers:
This indicator is not endorsed by or affiliated with Trades by Sci
This is an early implementation and interpretation of the ICC methodology
May not work exactly as Trades by Sci executes his trades and entries
Requires further debugging, backtesting, and real-world validation
Completely free to use - no purchase required
I'm just one person obsessed with this method and wanted some better visualization of the chart/entries
About ICC:
The ICC method identifies complete market cycles through three phases: Indication (breakout), Correction (pullback), and Continuation (entry). This indicator automates the identification of these phases and adds powerful features for modern traders.
Key Features:
Multi-Timeframe Capabilities:
Automatic timeframe detection with optimized settings for 5m, 15m, 30m, 1H, 4H, and Daily charts
Higher timeframe overlay to view HTF ICC levels on lower timeframe charts for precise entry timing
Smart defaults that adjust swing length and consolidation detection based on your timeframe
Advanced Phase Tracking:
Complete ICC cycle tracking: Indication, Correction, Consolidation, Continuation, and No Setup phases
Live structure detection shows potential peaks/troughs before full confirmation
Intelligent invalidation logic detects failed setups when market structure reverses
Dynamic phase backgrounds for instant visual confirmation
Three Types of Entry Signals:
Traditional Entries - Price crosses back through the original indication level (strongest signals)
"BUY" (green) / "SELL" (red)
Breakout Entries - Price breaks out of consolidation range in the same direction
"BUY" (green) / "SELL" (red)
Reversal Entries (Optional, can be toggled off) - Price breaks consolidation in opposite direction, indicating failed setup
"⚠ BUY" (yellow) / "⚠ SELL" (orange)
More aggressive, counter-trend signals
Can be disabled for more conservative trading
Professional Features:
Volatility-based support/resistance zones (ATR-adjusted) that adapt to market conditions
Historical zone tracking (0-3 configurable) with visual hierarchy
Comprehensive real-time info table displaying all key metrics
Full alert system for entries, indications, and consolidation detection
Visual distinction between high-confidence trend entries and cautionary reversal entries
📖 USAGE GUIDE
Entry Signal Types:
The indicator provides three types of entry signals with visual distinction:
Strong Entries (High Confidence):
"BUY" (bright green) / "SELL" (bright red)
Includes traditional entries (crossing back through indication level) and breakout entries (breaking consolidation in trend direction)
These are trend continuation or breakout signals with higher probability
Recommended for all traders
Reversal Entries (Caution - Counter-Trend):
"⚠ BUY" (yellow) / "⚠ SELL" (orange)
Triggered when price breaks out of correction/consolidation in the OPPOSITE direction
Indicates a failed setup and potential trend reversal
More aggressive, counter-trend plays
Can be toggled off in settings for more conservative trading
Recommended only for experienced traders or after thorough backtesting
Swing Length Settings:
The swing length determines how many bars on each side are needed to confirm a swing high/low. This is the most important setting for tuning the indicator to your style.
Auto Mode (Recommended for beginners): Toggle "Use Auto Timeframe Settings" ON
5-minute: 30 bars
15-minute: 20 bars
30-minute: 12 bars
1-hour: 7 bars
4-hour: 5 bars
Daily: 3 bars
Manual Mode: Toggle "Use Auto Timeframe Settings" OFF
Lower values (3-7): More aggressive, detects smaller swings
Pros: More signals, faster entries, catches smaller moves
Cons: More noise, more false signals, requires tighter stops
Best for: Scalping, active day trading, volatile markets
Higher values (12-20): More conservative, only major swings
Pros: More reliable signals, fewer false breakouts, clearer structure
Cons: Fewer signals, delayed entries, might miss smaller opportunities
Best for: Swing trading, position trading, trending markets
Default Manual Setting: 7 bars (balanced for 1H charts)
Minimum: 3 bars
Consolidation Bars Setting:
Determines how many bars without new structure are needed before flagging consolidation.
Lower values (3-10): Faster detection, catches brief pauses, more sensitive
Best for: Lower timeframes, volatile markets, avoiding any chop
Higher values (20-40): More reliable, only flags true extended consolidation
Best for: Higher timeframes, trending markets, patient traders
Current defaults scale with timeframe (more bars needed on shorter timeframes)
Historical S/R Zones:
Shows previous support and resistance levels to provide context.
Default: 2 historical zones (shows current + 2 previous)
Range: 0-3 zones
Visual Hierarchy: Older zones are more transparent with dashed borders
Usage: Higher numbers (2-3) show more historical context but can clutter the chart. Start with 2 and adjust based on your preference.
Live Structure Feature (Yellow Warning ⚠):
Provides early warning of potential structure changes before full confirmation.
What it does: Detects potential swing highs/lows after just 2 bars instead of waiting for full swing_length confirmation
Live Peak: Shows when a high is followed by 2 lower closes (potential top forming)
Live Trough: Shows when a low is followed by 2 higher closes (potential bottom forming)
Important: These are UNCONFIRMED - they may be invalidated if price reverses
Use case: Get early awareness of potential reversals while waiting for confirmation
Displayed in: Info table only (no visual markers on chart to reduce clutter)
Only shows: Peaks higher than last swing high, or troughs lower than last swing low (filters out noise)
Higher Timeframe (HTF) Analysis:
View higher timeframe ICC structure while trading on lower timeframes.
How to enable: Toggle "Show Higher Timeframe ICC" ON
Setup: Set "Higher Timeframe" to your reference timeframe
Example: Trading on 15-minute? Set HTF to 240 (4-hour) or 60 (1-hour)
Example: Trading on 5-minute? Set HTF to 60 (1-hour) or 15 (15-minute)
What it shows:
HTF indication levels displayed as dashed lines
Blue = HTF Bullish Indication
Purple = HTF Bearish Indication
HTF phase and levels shown in info table
Trading workflow:
Check HTF phase for overall market direction
Wait for HTF correction phase
Drop to lower timeframe to find precise entries
Enter when lower TF shows continuation in alignment with HTF
Best practice: HTF should be 3-4x your trading timeframe for best results
Reversal Entries Toggle:
Default: ON (shows all signal types)
Toggle OFF for more conservative trading (only trend continuation signals)
Recommended: Backtest with both settings to see which works better for your style
New traders should consider disabling reversal entries initially
Volatility-Based Zones:
When enabled, support/resistance zones automatically adjust their height based on ATR (Average True Range).
More volatile = wider zones
Less volatile = tighter zones
Toggle OFF for fixed-width zones
Community Feedback Welcome:
This is an evolving project and your input is valuable! Please share:
Bug reports and issues you encounter
Feature requests and suggestions for improvement
Results from your backtesting and live trading experience
Feedback on the reversal entry feature (too aggressive? working well?)
Ideas for better aligning with the ICC methodology
Perfect for traders learning or implementing the ICC methodology with the benefit of modern automation, multi-timeframe analysis, and flexible entry signal options.
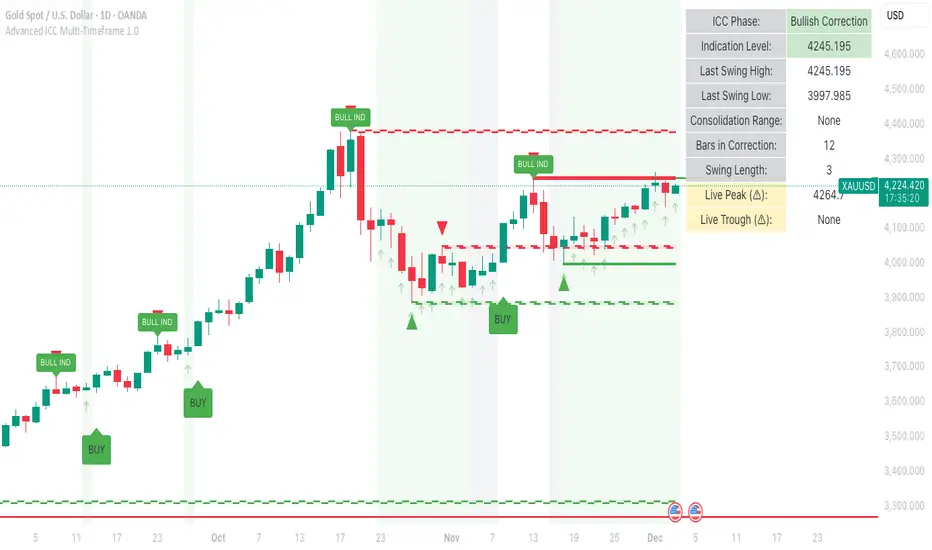
One for AllOne for All (OFA) - Complete ICT Analysis Suite
Version 3.3.0 by theCodeman
📊 Overview
One for All (OFA) is a comprehensive TradingView indicator designed for traders who follow Inner Circle Trader (ICT) concepts. This all-in-one tool combines essential ICT analysis features—sessions, kill zones, previous period levels, and higher timeframe candles with Fair Value Gaps (FVGs) and Volume Imbalances (VIs)—into a single, highly customizable indicator. Whether you're a beginner learning ICT concepts or an experienced trader refining your edge, OFA provides the visual structure needed for precise market analysis and execution.
✨ Key Features
- 🏷️ Customizable Watermark**: Display your trading identity with customizable titles, subtitles, symbol info, and full style control
- 🌍 Trading Sessions**: Visualize Asian, London, and New York sessions with high/low lines, range boxes, and open/close markers
- 🎯 Kill Zones**: Highlight 5 critical ICT kill zones with precise timing and visual boxes
- 📈 Previous Period H/L**: Track Daily, Weekly, and Monthly highs/lows with customizable styles and lookback periods
- 🕐 Higher Timeframe Candles**: Display up to 5 HTF timeframes with OHLC trace lines, timers, and interval labels
- 🔍 FVG & VI Detection**: Automatically detect and visualize Fair Value Gaps and Volume Imbalances on HTF candles
- ⚙️ Universal Timezone Support**: Works globally with GMT-12 to GMT+14 timezone selection
- 🎨 Full Customization**: Control colors, styles, visibility, and layout for every feature
🚀 How to Use
Watermark Setup
The watermark overlay helps you identify your charts and maintain focus on your trading principles:
1. Enable/disable watermark via "Show Watermark" toggle
2. Customize the title (default: "Name") to display your trading name or account identifier
3. Set up to 3 subtitles (default: "Patience", "Confidence", "Execution") as trading reminders
4. Choose position (9 locations available), size, color, and transparency
5. Toggle symbol and timeframe display as needed
Use Case: Display your trading principles or account name for multi-monitor setups or content creation.
Trading Sessions Analysis
Sessions define market character and liquidity availability:
1. Enable "Show All Sessions" to visualize all three sessions
2. Adjust timezone to match your local market (default: UTC-5 for EST)
3. Customize session times if needed (defaults cover standard hours)
4. Enable session range boxes to see consolidation zones
5. Use session high/low lines to identify key levels for the current session
6. Enable open/close markers to track session transitions
Use Case: Identify which session you're trading in, track session highs/lows for liquidity, and anticipate session transition volatility.
Kill Zones Trading
Kill zones are ICT's high-probability trading windows:
1. Enable individual kill zones or use "Show All Kill Zones"
2. **Asian Kill Zone** (2000-0000 GMT): Early positioning and smart money accumulation
3. **London Kill Zone** (0300-0500 GMT): European market opening volatility
4. **NY AM Kill Zone** (0930-1100 EST): Post-NYSE open expansion
5. **NY Lunch Kill Zone** (1200-1300 EST): Midday consolidation or manipulation
6. **NY PM Kill Zone** (1330-1600 EST): Afternoon positioning and closes
7. Customize colors and times to match your trading style
8. Set max days display to control historical visibility (default: 30 days)
Use Case: Focus entries during high-probability windows. Watch for liquidity sweeps at kill zone openings and institutional positioning.
Previous Period High/Low Levels
Previous period levels act as magnetic price targets and support/resistance:
1. Enable Daily (PDH/PDL), Weekly (PWH/PWL), or Monthly (PMH/PML) levels individually
2. Set lookback period (how many previous periods to display)
3. Choose line style: Solid (current emphasis), Dashed (standard), or Dotted (subtle)
4. Customize colors per timeframe for visual hierarchy
5. Adjust line width (1-5) for visibility preference
6. Enable gradient effect to fade older periods
7. Position labels left or right based on chart layout
8. Customize label text for your preferred notation
Use Case: Identify key levels where price is likely to react. Daily levels work on intraday timeframes, Weekly on daily charts, Monthly for swing trading.
Higher Timeframe (HTF) Candles
HTF candles reveal the larger market context while trading lower timeframes:
1. Enable up to 5 HTF slots simultaneously (default: 5m, 15m, 1H, 4H, Daily)
2. Choose display mode: "Below Chart" (stacked rows) or "Right Side" (compact column)
3. Customize timeframe, colors (bull/bear), and titles for each slot
4. **OHLC Trace Lines**: Visual lines connecting HTF candle levels to chart bars
5. **HTF Timer**: Countdown showing time remaining until HTF candle close
6. **Interval Labels**: Display day of week (Daily+) or time (intraday) on each candle
7. For Daily candles: Choose open time (Midnight, 8:30, 9:30) to match your market structure preference
Use Case: Trade lower timeframes while respecting higher timeframe structure. Watch for HTF candle closes to confirm directional bias.
FVG & VI Detection
Fair Value Gaps and Volume Imbalances highlight inefficiencies that price often revisits:
1. **Fair Value Gaps (FVGs)**: Detected when HTF candle wicks don't overlap between 3 consecutive candles
- Bullish FVG: Gap between candle 1 high and candle 3 low (green box by default)
- Bearish FVG: Gap between candle 1 low and candle 3 high (red box by default)
2. **Volume Imbalances (VIs)**: Similar detection but focuses on body gaps
- Bullish VI: Gap between candle 1 close and candle 3 open
- Bearish VI: Gap between candle 1 open and candle 3 close
3. Enable FVG/VI detection per HTF slot individually
4. Customize colors and transparency for each imbalance type
5. Boxes appear on chart at formation and remain visible as retracement targets
**Use Case**: Identify high-probability retracement zones. Price often returns to fill FVGs and VIs before continuing the trend. Use as entry zones or profit targets.
🎨 Customization
OFA is built for flexibility. Every feature includes extensive customization options:
Visual Customization
- **Colors**: Independent color control for every element (sessions, kill zones, lines, labels, FVGs, VIs)
- **Transparency**: Adjust box and label transparency (0-100%) for clean charts
- **Line Styles**: Choose Solid, Dashed, or Dotted for previous period lines
- **Sizes**: Control text size, line width, and box borders
- **Positions**: Place watermark in 9 positions, labels left/right
Layout Control
- **HTF Display Mode**: "Below Chart" for detailed analysis, "Right Side" for space efficiency
- **Drawing Limits**: Set max days for sessions/kill zones to manage chart clutter
- **Lookback Periods**: Control how many previous periods to display (1-10)
- **Gradient Effects**: Enable fading for older previous period lines
Timing Adjustments
- **Timezone**: Universal GMT offset selector (-12 to +14) for global markets
- **Session Times**: Customize each session's start/end times
- **Kill Zone Times**: Adjust kill zone windows to match your market's characteristics
- **Daily Open**: Choose Midnight, 8:30, or 9:30 for Daily HTF candle open time
💡 Best Practices
1. Start Simple: Enable one feature at a time to learn how each element affects your analysis
2. Match Your Timeframe: Use Daily levels on intraday charts, Weekly on daily charts, HTF candles one or two levels above your trading timeframe
3. Kill Zone Focus: Concentrate your trading activity during kill zones for higher probability setups
4. HTF Confirmation: Wait for HTF candle closes before committing to directional bias
5. FVG/VI Entries: Look for price to return to unfilled FVGs/VIs for entry opportunities with favorable risk/reward
6. Customize Colors: Use a consistent color scheme that matches your chart theme and reduces visual fatigue
7. Reduce Clutter: Disable features you're not actively using in your current trading plan
8. Session Context: Understand which session controls the market—trade with session direction or anticipate reversals at session transitions
⚙️ Settings Guide
OFA organizes settings into logical groups for easy navigation:
- **═══ WATERMARK ═══**: Title, subtitles, position, style, symbol/timeframe display
- **═══ SESSIONS ═══**: Enable/disable sessions, times, colors, high/low lines, boxes, markers
- **═══ KILL ZONES ═══**: Individual kill zone toggles, times, colors, max days display
- **═══ PREVIOUS H/L - DAILY ═══**: Daily high/low lines, style, color, lookback, labels
- **═══ PREVIOUS H/L - WEEKLY ═══**: Weekly high/low lines, style, color, lookback, labels
- **═══ PREVIOUS H/L - MONTHLY ═══**: Monthly high/low lines, style, color, lookback, labels
- **═══ HTF CANDLES ═══**: Global display mode, layout settings
- **═══ HTF SLOT 1-5 ═══**: Individual HTF configuration (timeframe, colors, title, FVG/VI detection, trace lines, timer, interval labels)
Each setting includes tooltips explaining its function. Hover over any input for detailed guidance.
📝 Final Notes
One for All (OFA) represents a complete ICT analysis toolkit in a single indicator. By combining watermark customization, session visualization, kill zone highlighting, previous period levels, and higher timeframe candles with FVG/VI detection, OFA eliminates the need for multiple indicators cluttering your chart.
**Version**: 3.3.0
**Author**: theCodeman
**Pine Script**: v6
**License**: Mozilla Public License 2.0
Start with default settings to learn the indicator's structure, then customize extensively to match your personal trading style. Remember: tools provide information, but your edge comes from disciplined execution of a proven strategy.
Happy Trading! 📈

67 2.0Major Market Trading Hours
New York Stock Exchange (NYSE)
Open: 9:30 AM (ET)
Close: 4:00 PM (ET)
Pre-Market: 4:00 AM – 9:30 AM (ET)
After Hours: 4:00 PM – 8:00 PM (ET)
Nasdaq
Open: 9:30 AM (ET)
Close: 4:00 PM (ET)
Pre-Market: 4:00 AM – 9:30 AM (ET)
After Hours: 4:00 PM – 8:00 PM (ET)
London Stock Exchange (LSE)
Open: 8:00 AM (GMT)
Close: 4:30 PM (GMT)
Tokyo Stock Exchange (TSE)
Open: 9:00 AM (JST)
Lunch Break: 11:30 AM – 12:30 PM (JST)
Close: 3:00 PM (JST)
Hong Kong Stock Exchange (HKEX)
Open: 9:30 AM (HKT)
Lunch Break: 12:00 PM – 1:00 PM (HKT)
Close: 4:00 PM (HKT)

Trend Trader//@version=6
indicator("Trend Trader", shorttitle="Trend Trader", overlay=true)
// User-defined input for moving averages
shortMA = input.int(10, minval=1, title="Short MA Period")
longMA = input.int(100, minval=1, title="Long MA Period")
// User-defined input for the instrument selection
instrument = input.string("US30", title="Select Instrument", options= )
// Set target values based on selected instrument
target_1 = instrument == "US30" ? 50 :
instrument == "NDX100" ? 25 :
instrument == "GER40" ? 25 :
instrument == "GOLD" ? 5 : 5 // default value
target_2 = instrument == "US30" ? 100 :
instrument == "NDX100" ? 50 :
instrument == "GER40" ? 50 :
instrument == "GOLD" ? 10 : 10 // default value
// User-defined input for the start and end times with default values
startTimeInput = input.int(12, title="Start Time for Session (UTC, in hours)", minval=0, maxval=23)
endTimeInput = input.int(17, title="End Time Session (UTC, in hours)", minval=0, maxval=23)
// Convert the input hours to minutes from midnight
startTime = startTimeInput * 60
endTime = endTimeInput * 60
// Function to convert the current exchange time to UTC time in minutes
toUTCTime(exchangeTime) =>
exchangeTimeInMinutes = exchangeTime / 60000
// Adjust for UTC time
utcTime = exchangeTimeInMinutes % 1440
utcTime
// Get the current time in UTC in minutes from midnight
utcTime = toUTCTime(time)
// Check if the current UTC time is within the allowed timeframe
isAllowedTime = (utcTime >= startTime and utcTime < endTime)
// Calculating moving averages
shortMAValue = ta.sma(close, shortMA)
longMAValue = ta.sma(close, longMA)
// Plotting the MAs
plot(shortMAValue, title="Short MA", color=color.blue)
plot(longMAValue, title="Long MA", color=color.red)
// MACD calculation for 15-minute chart
= request.security(syminfo.tickerid, "15", ta.macd(close, 12, 26, 9))
macdColor = macdLine > signalLine ? color.new(color.green, 70) : color.new(color.red, 70)
// Apply MACD color only during the allowed time range
bgcolor(isAllowedTime ? macdColor : na)
// Flags to track if a buy or sell signal has been triggered
var bool buyOnce = false
var bool sellOnce = false
// Tracking buy and sell entry prices
var float buyEntryPrice_1 = na
var float buyEntryPrice_2 = na
var float sellEntryPrice_1 = na
var float sellEntryPrice_2 = na
if not isAllowedTime
buyOnce :=false
sellOnce :=false
// Logic for Buy and Sell signals
buySignal = ta.crossover(shortMAValue, longMAValue) and isAllowedTime and macdLine > signalLine and not buyOnce
sellSignal = ta.crossunder(shortMAValue, longMAValue) and isAllowedTime and macdLine <= signalLine and not sellOnce
// Update last buy and sell signal values
if (buySignal)
buyEntryPrice_1 := close
buyEntryPrice_2 := close
buyOnce := true
if (sellSignal)
sellEntryPrice_1 := close
sellEntryPrice_2 := close
sellOnce := true
// Apply background color for entry candles
barcolor(buySignal or sellSignal ? color.yellow : na)
/// Creating buy and sell labels
if (buySignal)
label.new(bar_index, low, text="BUY", style=label.style_label_up, color=color.green, textcolor=color.white, yloc=yloc.belowbar)
if (sellSignal)
label.new(bar_index, high, text="SELL", style=label.style_label_down, color=color.red, textcolor=color.white, yloc=yloc.abovebar)
// Creating labels for 100-point movement
if (not na(buyEntryPrice_1) and close >= buyEntryPrice_1 + target_1)
label.new(bar_index, high, text=str.tostring(target_1), style=label.style_label_down, color=color.green, textcolor=color.white, yloc=yloc.abovebar)
buyEntryPrice_1 := na // Reset after label is created
if (not na(buyEntryPrice_2) and close >= buyEntryPrice_2 + target_2)
label.new(bar_index, high, text=str.tostring(target_2), style=label.style_label_down, color=color.green, textcolor=color.white, yloc=yloc.abovebar)
buyEntryPrice_2 := na // Reset after label is created
if (not na(sellEntryPrice_1) and close <= sellEntryPrice_1 - target_1)
label.new(bar_index, low, text=str.tostring(target_1), style=label.style_label_up, color=color.red, textcolor=color.white, yloc=yloc.belowbar)
sellEntryPrice_1 := na // Reset after label is created
if (not na(sellEntryPrice_2) and close <= sellEntryPrice_2 - target_2)
label.new(bar_index, low, text=str.tostring(target_2), style=label.style_label_up, color=color.red, textcolor=color.white, yloc=yloc.belowbar)
sellEntryPrice_2 := na // Reset after label is created
