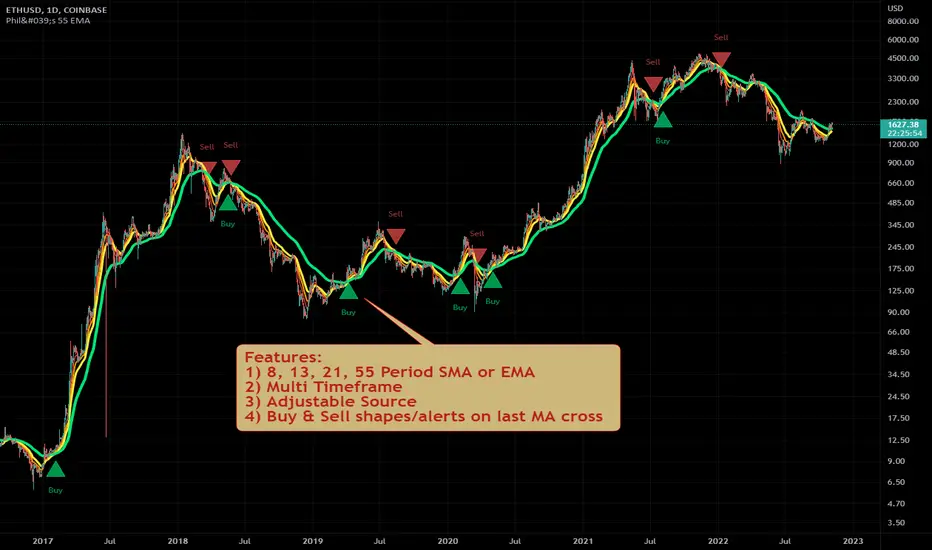
Philakone 55 EMA Swing Trading StrategyThis strategy was inspired by Philkone Crypto's "Lesson 12: Let's Learn Advanced 55 EMA Strategy" video.
steemit.com
Supports Buy and Sell Condition alerts and displays arrows on the chart.
Pesquisar nos scripts por "12月4号是什么星座"
Ichimoku Kinko Hyo + HULL-MA_X + MacDThe Ichimoku Kinko Hyo system includes five kinds of signal, of which this strategy uses the most recent of ones i.e. Tenkan Sen / Kijun Sen Cross and price crosses the Kijun Sen. As the Chikou Span, Senkou Span A and Senkou Span B are shifted into the past/future, the trigger signals will be only be used for visual confirmation and not part of the strategy.
The Tenkan Sen, also known as the Turning or Conversion line, is a moving average of the highest high and lowest low over the last 9 periods in this strategy.
The Kijun Sen, also known as the Standard or Base line, is a moving average of the highest high and lowest low over the last 24 periods in this strategy.
The Chikou Span, also known as the Lagging line, is the closing price plotted 24 periods behind in this strategy.
The Senkou Span A, also known as the 1st leading line, is a moving average of the Tenkan Sen and Kijun Sen and is plotted 24 periods ahead in this strategy.
The Senkou Span B, also known as the 2nd leading line, is a moving average of the highest high and lowest low over the last 51 trading days is plotted 24 periods ahead in this strategy.
Moving average convergence divergence (MaCD) is a trend-following momentum indicator that shows the relationship between two moving averages of prices. The MaCD is calculated in this strategy by subtracting the 24-day exponential moving average (EMA) from the 12-day EMA. A nine-day EMA of the MACD, called the "signal line", aMaCD in this case, is then plotted on top of the MaCD. In this strategy, MaCD/ aMaCD Cross is functioning as a trigger for buy and sell signals.
As with most technical analysis methods, Ichimoku is likely to produce frequent conflicting signals in non-trending markets, So in addition to Ichimoku Kinko Hyo, the Hull MA is popular amongst some day traders, as the indicator which in combination with MaCD attempts to give an accurate signal by eliminating lags and improving the smoothness of the line.
Alan Hull, developed this moving average indicator and hence it’s called the Hull MA.
Now, let’s dissect how the Hull moving average is calculated.
The Hull MA involves the weighted moving average (WMA) in its calculation.
First, calculate the WMA with period (n / 2) and multiply this by 2. Remember ‘n’ is the time period configurable based on the trader’s requirement. The default setting is 12 periods in this strategy, fast Hull MA crossing slow Hull MA will generate a circle on charts.
Second, calculate the WMA for period “n” and subtract if from the first step. Thirdly, calculate the weighted moving average with period sqrt (n) using the data from the second step. You can take a look at the below formula:
Hull MA= WMA (2*WMA (n/2) − WMA (n)), sqrt (n))
The Hull MA Cross in combination with Tenkan Sen / Kijun Sen Cross and MaCD tries to give an accurate signal by eliminating lags and improve the smoothness of price activity. Please note that price trends can and do change often, so your readings of the charts and this trading system should be probabilistic, rather than predictive.

Pullback Trading Tool R5-65 by JustUncleLBy request this is an updated version of the "PullBack Trading Tool": removes experimental "OCC" channel, added option to display ribbons or just single moving average lines, added alert arrows for "PB" exits, added alertcondition for TV alarm subsystem, added some extract options for Pivot points and general cleanup of code.
Description:
This project incorporates the majority of the indicators needed to analyse and trade Trends for Pullbacks, swings and reversals.
Incorporated within this tool are the following indicators:
1. Major industry (Banks) recognised important EMAs in an EMA Ribbon:
Lime = EMA5 (Optional Display)
DodgerBlue = EMA12 (Optional Display)
Red = EMA36 (Optional display)
Green = EMA89
Blue = EMA200
Black = EMA633
2. The 5 EMA (default) High/Low/Close Price Action Channel (PAC), the PAC channel display is disabled by default.
3. Optionally display Fractals and optional Fractal levels
4. Optional HH, LH, LL, HL finder.
5. Optional Buy/Sell "PB" exit Alerts with Optional 200EMA filter.
6. Coloured coded Bar high lighting based on the PAC:
blue = bar closed above PAC
red = bar closed below PAC
gray = bar closed inside PAC
7. Alert condition sent to TradingView's Alarm subsystem for PB exits.
8. Pivot points with optional labels.
9. EMA5-12 Ribbon is displayed by default.
10.EMA12-36 Ribbon is displayed by default
Set up and hints:
I am unable to provide a full description here, as Pullback Trading incorporates a full trading Methodology, there are a number of articles and books written on the subject.
Set the chart to Heikin Ashi Candles (optional).
I also add a "Sweetspot Gold R3" indicator to the chart as well to help with support and resistance finding and shows where the important "00" lines are.
First on a weekly basis say Sunday night or Monday morning, analyse the Daily and Weekly charts to establish overall trends, and support/resistant levels. Draw significant mini trend lines (2/3 TL), vertical trend lines (VTL) and S/R levels. Can use the Pivots points to guide VTL drawing and Fractals to help guide 2/3 TL drawing.
Once the trend direction and any potential major reversals highlighted, drop down to lower timeframe chart and draw appropriate mini Trend line (2/3 TL) matching the established momentum direction. Take note of potential pull backs from and of the EMAs, in particular the EMA5-12 ribbon, EMA12-36 Ribbon and the 200EMA. Can use the Pivots and/or Fractals points to guide your 2/3 TL drawing.
Set a TradingView alarm on the "PBTOOL alert", with the default settings this normally occurs before or during the Break of the manually drawn TL lines.
Once alerted check to see if the TL is broken and is returning to trend away from the EMA lines, this is indicated by bar colour change to trend directional colour.
You can trade that alert or drop down to even lower time frames and perform the same TL analysis there to find trades at the lower TF. Trading at lower TF you will allow tighter Stop loss settings.
Other than the "SweetSpot Gold R3" indicator, you should not need any other indicator to successfully trade trends for Pullbacks and reversals. If you really want another indicator I suggest a momentum one for example: AO ( Awesome Oscillator ), MACD or Squeeze Momentum.

Spartan Trader FX IndicatorUnofficial (I am not affiliated to www.spartantraderfx.com in any way) combo indicator providing all the indicators needed for their trading system (default coloring as presented in the materials):
EMA 12 line
EMA 36 line
EMA 200 line
EMA 633 line
EMA 200 and EMA 633 volatility zone
EMA 12/36 crossover arrows
heiken ashi color overlay(helpful when trying to see true open and close of candles using regular candlesticks)

Scalping Swing Trading Tool R1-4 by JustUncleLDescription:
This study project is a "Scalping Swing trading Tool" and is an alternative to the "Scalping Pullback Tool R1". It is designed for a two pane TradingView chart layout :
the first pane set to 15min Time Frame;
the second pane set to 1min Time Frame(TF).
The tools incorporates the majority of the indicators needed to analyse and scalp Trends for Swings, PullBacks and reversals on 15min charts and 1min charts.
Incorporated within this tool are the following indicators:
1. The following EMAs are drawn automatically:
Green = EMA89 (15min TF) = EMA75 (1min TF)
Blue = EMA200 (15min TF) = EMA180 (1min TF)
Black = EMA633 (15min TF) = EMA540 (1min TF)
2. The 10EMA (default) High/Low+Close Price Action Channel (PAC), the PAC channel
display is disabled by default.
3. Optionally display Fractals and optional Fractal levels
4. Optional HH, LH, LL, HL finder.
5. Coloured coded Bar high lighting based on the PAC:
blue = bar closed above PAC
red = bar closed below PAC
gray = bar closed inside PAC
lime Line = EMA10 of bar close
6. Pivot points (disables Fractals automatically when selected) with optional labels.
7. EMA5-12 Channel is displayed by default.
8. EMA12-36 Ribbon is displayed by default
9. Optionally display EMA36 and PAC instead of EMA12-36 Ribbon.
Set up and hints:
I am unable to provide a full description here, as Pullback Trading incorporates a full trading Methodology, there are a number of articles and books written on the subject.
Set to two pane TradingView chart, set first pane to 15Min and second to 1min.
Set the chart to Heikin Ashi Candles (optional).
I also add a "Sweetspot Gold2" indicator to the chart as well to help with support and resistance finding and shows where the important "00" lines are.
Use the EMA200 on the 15min pane as the anchor. So when prices above EMA200 we only trade long (buy) and when prices below the EMA200 we only trade short (sell).
On the 15min chart draw any obvious Vertical Trend Lines (VTL), use Pivots point as a guide.
On the 15min chart what we’re looking for price to Pullback into the EMA5-12 Channel or EMA12-36 ribbon, we draw Trendlines uitilising the Pivot points or Fractals to guide your TL drawing.
On the 15min chart look for the trend to resume and break through the drawn TL. The bar color needs to change back to the trend direction colour to confirm as a break.
Now this break can be traded as a 15min trade or now look to the 1min chart.
On the 1min chart draw any Pullback into any of the EMAs.
On the 1min chart look for the trend to resume and break through the drawn TL. The bar color needs to change back to the trend direction colour to confirm as a break.
Now this break can be traded as a 1min trade.
There is also an option to select Pristine (ie Ideal) filtered Fractals, which look like tents or V shape 5-candle patterns. These are actually used to calculate the Pivot points as well.
Other than the "SweetSpot Gold2" indicator, you should not need any other indicator to successfully trade trends for Pullbacks and reversals. If you really want another indicator use the AO (Awesome Oscillator) as it is momentum based.

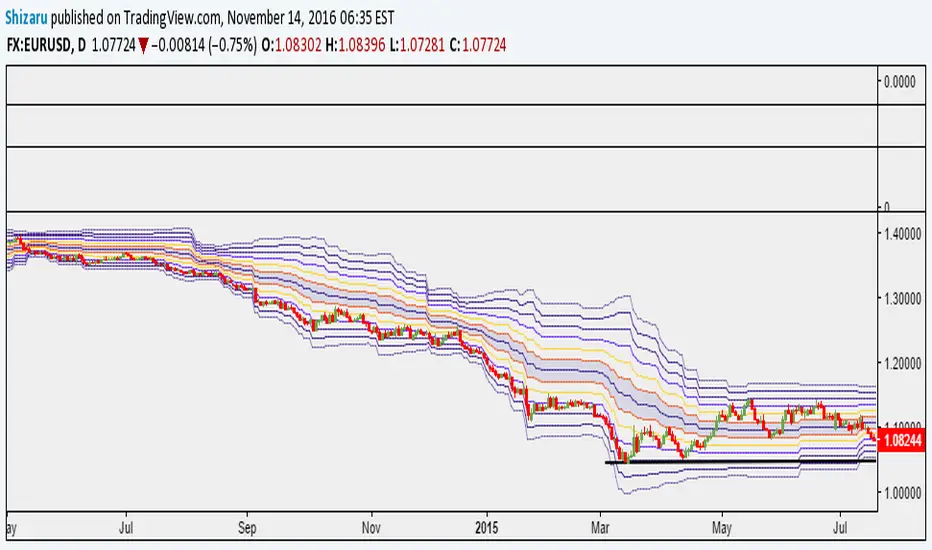
Murray Math LevelsThe original script was posted on ProRealCode by user supertiti.
The Murray Math lines levels are determined within some principles of Gann levels and candlesticks formations. The Murray Math levels act pretty much like pivot and support/resistance areas.
1. Line 8/8 - 0/8 (Ultimate Support and Ultimate Resistance).
Those lines are the most strong concerning Support and resistance.
2. Line 7/8 (Weak, Place to Stop and Reverse).
This line is weak. If suddenly the price was going too fast and too far and stops around this line it means the price will reverse down very soon. If the price did not stop near this line this price will continue the movement to the line 8/8.
3. Line 1/8 (Weak, Place to Stop and Reverse).
This line is weak. If suddenly the price was going too fast and too far and stops around this line it means the price will reverse up very soon. If the price did not stop near this line this price will continue the movement down to the line 0/8.
4. Line 2/8 and 6/8 (Pivot, Reverse)
Those two lines yield the line 4/8 only to the strength to reverse the price movement.
5. Line 5/8 (Top of Trading Range)
The price is spending the about 40% of the time on the movement between the lines 5/8 and 3/8. If the price is moving near line 5/8 and stopping near the line during the 10 - 12 days so it means that it is necessary to sell in this "bonus zone" (some people are doing like this) but if the price is keeping the tendency to stay above 5/8 line, so it means that the price will be above. But if the price is droping below 5/8 line it means that the price will continue falling to the next level of resistance.
6. Line 3/8 (Bottom of Trading Range).
If the price is below this line and in uptrend it means that it will be very difficult for the price to break this level. If the price broke this line during the uptrend and staying above during the 10- 12 days it means that the price will be above this line during the 40% of its time moving between this line and 5/8 line.
7. Line 4/8 (Major Support/Resistance Line).
It is the major line concerning support and resistance. This level is the better for the new sell or buy. It is the strong level of support of the price is above 4/8. It is the fine resistance line if the price is below this 4/8 line.
Candlestick Trend Indicator v0.5 by JustUncleLRequested Update to this Indicator alert project. In this update I have added the option to be able select which Price Action candles you want included in the display and the generated alarm Alert. Other changes also included in this update:
Also added a Price Action candle for "Last Fractal S/R Break", this also a good continuation indication.
Added option to select a different moving average types for directional MA line.
Modified some default settings, using HullMA instead of Zero Lag EMA and standard MACD settings(12,26,9).
Description:
This is a trend following indicator and alert for Binary Options based on Candlestick patterns and trend line -
NOTE: original system was a forex trading system.
This code combines a number of indicators to create an overall trading strategy.
The indicator recognises and displays some useful candle named defined patterns that are used to support trend continuation:
Bearish + Bullish PinBars
Dark Cloud Cover
Piecing Line
Bullish + Bearish Harami
Bullish + Bearish Engulfing Candle
Bullish + Bearish Last Fractal S/R break
Also recognises main Price Action candles from ChrisMoody (CM), the four(4) price action patterns are colored coded bars:
Yellow = Inside Bar - breakout/continuance
Orange = Outside Bar - breakout/continuance
Aqua/Fuschia = Up/Down Shaved Bars - Buying/Selling pressure
Red/Green = Possible reversal PinBars - Reverse Down / reverse Up
The highlighted candles (maroon and darker green) represent the defined PA patterns that have been confirmed following the current trend direction that is indicated by the Hull MA(20) line (can select a different type of MA, or even disable) and confirmed by MACD direction (can be disabled). The confirmed Alerts are indication by green (buy) and red (sell) dots at the bottom of the chart. An alert is generated from this selection for the alert condition of the alarming system.
The fractal upper/lower break lines are also draw, if the (optional) last fractal break line is broken by a highlighted bar then this indicates a stronger trend conformation.
The MACD indicator MACD DEUTER 2 colour(12,26,9) you can visually see the MACD histogram colours with MACD direction - needs "MACD DEUTER 2 colour" indicator.
This multi-indicator set up is suitable for 1hr, 4hr and daily charts with 1-4 candle expiry.
References and Inspiration from:
Fractal Levels by RicardoSantos
Almost Zero Lag EMA
Candlestick Patterns With EMA by rmwaddelljr
CM_Price-Action-Bars by ChrisMoody
www.forexstrategiesresources.com
"Scalp Jockey - MTF MA Cross Visual Strategizer by JayRogers"

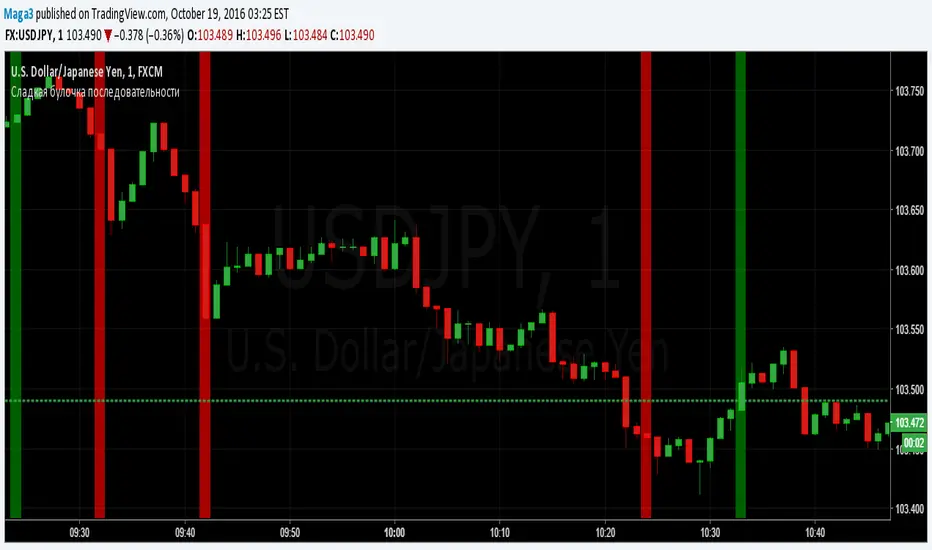
Sladkaya Bulochka PosledovatelnostiSerial number of the same color candles - a popular method of how to find the exact entry zones and determine the trends and kickbacks.
The number of consecutive candles usually starts from 3 and up to 12 in some strategies.
5 candles in sequence - one of the most popular signals. Login at the close of the 5th candle.
---------------------------------------------
Последовательное число свечей одинакового цвета - популярный метод как поиска точных зон входа, так и определения трендов и откатов.
Число последовательных свечей, как правило, начинается с 3 и доходит до 12 в некоторых стратегиях.
5 свечей в последовательности - один из наиболее популярных сигналов. Вход на закрытии 5й свечи.
MACD trend heatmap (by ChartArt)This is an overlay indicator which uses the classic period settings and signals from the MACD (Moving Average Convergence/Divergence) indicator to overlay a heatmap using all the information the MACD generates with its three periods (12,26,9).
The first two moving averages which the MACD uses (12 and 26) can be plotted on the chart like usual EMAs.
In addition to the background color function (the heatmap) and the EMAs, there is an optional bar color alert when the uptrend or the downtrend as measured by the MACD appears to be very strong.

Stoch_VX2Nothing New about a Stochastic but maybe in how you use them ( Other than Over bought / Sold cross over & divergence signals )
Running 3 bands
Standard stoch & tops & bottoms swing band
Optimised variables 12, 5 , 3 or fib 13, 5, 3 / - 12 / 3 / 3 a little bit tighter to combine both smoothness & accuracy. These are my own personal setting inc. Strategy.

MACD Color Trawler (by ChartArt)This version of the MACD indicator is 'trawling' (checking) if the MACD histogram and the zero line crossing with the MACD line are both positive or negative. The idea behind this is to show areas with higher or lower risk.
Features:
1. Enable the bar color
2. Enable the background color
3. Change zero line value
FYI:
"The MACD-Histogram is an indicator of an indicator. In fact, MACD is also an indicator of an indicator. This means that the MACD-Histogram is the fourth derivative of price."
First derivative: 12-day EMA and 26-day EMA
Second derivative: MACD (12-day EMA less the 26-day EMA)
Third derivative: MACD signal line (9-day EMA of MACD)
Fourth derivative: MACD-Histogram (MACD less MACD signal line)
Source: stockcharts.com

RS Rating Multi-TimeframeRS Rating Multi-Timeframe (IBD-Style Relative Strength)
Short Description:
IBD-style Relative Strength Rating (1-99) comparing any stock's performance vs the S&P 500 across multiple timeframes.
Full Description:
Overview
This indicator calculates an IBD-style Relative Strength (RS) Rating that measures a stock's price performance relative to the S&P 500 over the past 12 months. The rating scale ranges from 1 (weakest) to 99 (strongest), telling you how a stock ranks against all other stocks in terms of relative performance.
How It Works
The RS Rating uses a weighted formula based on quarterly performance:
Last 63 days (1 quarter): 40% weight
Last 126 days (2 quarters): 20% weight
Last 189 days (3 quarters): 20% weight
Last 252 days (4 quarters): 20% weight
This weighting emphasizes recent performance while still accounting for longer-term strength.
Rating Interpretation
90-99 (Elite): Top 10% of all stocks - exceptional relative strength
80-89 (Excellent): Top 20% - strong leadership candidates
50-79 (Average): Middle of the pack
30-49 (Below Average): Underperforming the market
1-29 (Weak): Bottom 30% - avoid or consider shorting
Features
Multi-Timeframe: Works on any timeframe from 1-hour to weekly (always uses daily data for calculation)
Moving Average: Optional EMA or SMA of the RS Rating to smooth signals
Visual Zones: Color-coded zones for quick identification of strength/weakness
Signal Markers: Triangles appear when RS crosses key levels (80 and 30)
Info Table: Displays current RS Rating, change, MA value, and raw score
Alerts: Built-in alerts for key crossover events
Settings
Show Moving Average: Toggle MA line on/off
MA Length: Period for the moving average (default: 10)
MA Type: Choose between EMA or SMA
Benchmark Index: Change the comparison index (default: SP:SPX)
Show Rating Table: Toggle the info table on/off
How To Use
Buy candidates: Look for stocks with RS Rating above 80, ideally rising
Avoid: Stocks with RS Rating below 30 or falling rapidly
Confirmation: Use RS above its moving average as additional confirmation
Divergence: Watch for RS making new highs before price (bullish) or new lows before price (bearish)
Credits
RS Rating calculation methodology inspired by Investor's Business Daily (IBD) and adapted from Fred6724's RS Rating script. Percentile calibration based on analysis of ~6,600 US stocks.
Tags: relative strength, RS rating, IBD, momentum, CAN SLIM, benchmark, SPX, market leaders, stock ranking
Category: Relative Strength

Market X-Ray Dashboard: Trend, Momentum & Volume [THF]This script is designed to solve a common problem for traders: "Analysis Paralysis." Instead of cluttering the chart with multiple oscillators and indicators, the Market X-Ray Dashboard aggregates key market data into a clean, scannable table. It provides a real-time confluence check by combining Trend, Momentum, and Volume analysis.
How it Works (The Logic)
The dashboard monitors four distinct technical factors and assigns a status based on specific thresholds. Here is the mathematical breakdown of the components:
1. RSI (Relative Strength Index)
Period: 14 (Default)
Logic: Measures the speed and change of price movements.
Overbought (>70): High probability of reversal (Bearish).
Bullish Zone (<45): Indicates potential upside room.
Oversold (<30): Strong potential for a bounce.
2. MACD (Moving Average Convergence Divergence)
Settings: 12, 26, 9
Logic: Used for trend following.
Buy Signal: MACD Line crosses above Signal Line + Histogram is increasing.
Sell Signal: MACD Line crosses below Signal Line + Histogram is decreasing.
3. Stochastic RSI
Settings: 14, 14, 3, 3
Logic: A more sensitive momentum indicator to catch short-term pivots.
Uses smoothed K and D lines to filter out noise.
Identifies "Strong Buy" zones when the oscillator is below 20 and "Strong Sell" when above 80.
4. Volume Analysis (New Feature)
Logic: Volume is the fuel of the market. This component compares the current volume bar against a 20-period Simple Moving Average (SMA).
High Vol Alert: If the current volume exceeds the average by 1.5x (customizable), it triggers a "High Vol 🔥" alert.
Color Coding: The volume cell adapts to the candle color. High volume on a green candle suggests strong buying pressure, while high volume on a red candle suggests strong selling pressure.
The "Overall" Confluence Algorithm
The final row provides an algorithmic summary based on the confluence of the above indicators:
Uptrend 🚀: Triggered when at least 2 out of 3 momentum indicators (RSI, MACD, Stoch) align on a Buy signal.
Downtrend 🔻: Triggered when at least 2 out of 3 indicators align on a Sell signal.
Neutral/Ranging: When signals are conflicting (e.g., RSI is overbought but MACD is bullish).
Features & Settings
Fully Customizable Colors: Users can change the colors for Strong Buy, Buy, Neutral, Sell, and Strong Sell to fit their chart theme (Dark/Light mode).
Adjustable Thresholds: All lengths (RSI, MACD, Volume SMA) are adjustable in the settings menu.
Volume Multiplier: Users can define what constitutes "High Volume" (default is 1.5x the average).
How to Use This Tool
This dashboard should be used as a confirmation tool.
Trend Confirmation: Do not trade blindly. If the "Overall" status says "Uptrend," look for price action setups (like support bounces) to go long.
Volume Validation: Use the Volume row to validate breakouts. A breakout with "Low Vol" is likely a fake-out.
Divergence Spotting: If the price is making a new high but the Dashboard shows RSI entering "Strong Sell," be cautious of a reversal.
Disclaimer:
This tool is for informational purposes only and does not guarantee profits. Technical analysis works best when combined with risk management and fundamental analysis.

2 MACD VISUEL — 4H / 1H / 15M + CONFIRMATION 5M//@version=6
indicator("MTF MACD VISUEL — 4H / 1H / 15M + CONFIRMATION 5M", overlay=true, max_labels_count=500)
// ─────────────────────────────
// Fonction MACD Histogram
// ─────────────────────────────
f_macd(src) =>
fast = ta.ema(src, 12)
slow = ta.ema(src, 26)
macd = fast - slow
signal = ta.ema(macd, 9)
hist = macd - signal
hist
// ─────────────────────────────
// MTF MACD HISTOGRAM
// ─────────────────────────────
h4 = request.security(syminfo.tickerid, "240", f_macd(close))
h1 = request.security(syminfo.tickerid, "60", f_macd(close))
h15 = request.security(syminfo.tickerid, "15", f_macd(close))
h5 = request.security(syminfo.tickerid, "5", f_macd(close))
// Signes
s4 = h4 > 0 ? 1 : h4 < 0 ? -1 : 0
s1 = h1 > 0 ? 1 : h1 < 0 ? -1 : 0
s15 = h15 > 0 ? 1 : h15 < 0 ? -1 : 0
s5 = h5 > 0 ? 1 : h5 < 0 ? -1 : 0
// Conditions
three_same = (s4 == s1) and (s1 == s15) and (s4 != 0)
five_same = three_same and (s5 == s4)
// BUY / SELL logiques
isBUY = five_same and s4 == 1
isSELL = five_same and s4 == -1
// ─────────────────────────────
// DASHBOARD VISUEL (en haut du graphique)
// ─────────────────────────────
var table dash = table.new(position.top_right, 4, 2, border_color=color.black)
table.cell(dash, 0, 0, "4H", bgcolor = s4 == 1 ? color.green : s4 == -1 ? color.red : color.gray)
table.cell(dash, 1, 0, "1H", bgcolor = s1 == 1 ? color.green : s1 == -1 ? color.red : color.gray)
table.cell(dash, 2, 0, "15M", bgcolor = s15 == 1 ? color.green : s15 == -1 ? color.red : color.gray)
table.cell(dash, 3, 0, "5M", bgcolor = s5 == 1 ? color.green : s5 == -1 ? color.red : color.gray)
table.cell(dash, 0, 1, s4 == 1 ? "↑" : s4 == -1 ? "↓" : "·", bgcolor=color.new(color.black, 0), text_color=color.white)
table.cell(dash, 1, 1, s1 == 1 ? "↑" : s1 == -1 ? "↓" : "·", bgcolor=color.new(color.black, 0), text_color=color.white)
table.cell(dash, 2, 1, s15 == 1 ? "↑" : s15 == -1 ? "↓" : "·", bgcolor=color.new(color.black, 0), text_color=color.white)
table.cell(dash, 3, 1, s5 == 1 ? "↑" : s5 == -1 ? "↓" : "·", bgcolor=color.new(color.black, 0), text_color=color.white)
// ─────────────────────────────
// SIGNES VISUELS SUR LE GRAPHIQUE
// ─────────────────────────────
plotshape(isBUY, title="BUY", style=shape.triangleup, location=location.belowbar, color=color.green, size=size.large, text="BUY")
plotshape(isSELL, title="SELL", style=shape.triangledown, location=location.abovebar, color=color.red, size=size.large, text="SELL")
// Histogramme du MACD 5M en couleur tendance
plot(h5, title="MACD Hist 5M", color = h5 >= 0 ? color.green : color.red, style=plot.style_columns)
// ─────────────────────────────
// Alerte Webhook (message constant OBLIGATOIRE)
// ─────────────────────────────
alertcondition(isBUY, title="Signal BUY Confirmé", message="MTF_MACD_BUY")
alertcondition(isSELL, title="Signal SELL Confirmé", message="MTF_MACD_SELL")

1MTF MACD Alignement XAUUSD - Webhook v6//@version=6
indicator("MTF MACD Alignement XAUUSD - Webhook v6", overlay=false)
// ===== Paramètres utilisateur =====
fast_len = input.int(12, "Fast Length")
slow_len = input.int(26, "Slow Length")
signal_len = input.int(9, "Signal Length")
repl_secret = input.string(title="Webhook secret (doit matcher WEBHOOK_SECRET)", defval="Covid-19@2020")
// ===== Fonction MACD histogramme =====
f_macd_hist(src) =>
macd = ta.ema(src, fast_len) - ta.ema(src, slow_len)
signal = ta.ema(macd, signal_len)
hist = macd - signal
hist
// ===== Récupération multi-timeframe =====
hist4h = request.security(syminfo.tickerid, "240", f_macd_hist(close), lookahead=barmerge.lookahead_off)
hist1h = request.security(syminfo.tickerid, "60", f_macd_hist(close), lookahead=barmerge.lookahead_off)
hist15m = request.security(syminfo.tickerid, "15", f_macd_hist(close), lookahead=barmerge.lookahead_off)
hist5m = request.security(syminfo.tickerid, "5", f_macd_hist(close), lookahead=barmerge.lookahead_off)
// ===== Signes de MACD =====
s4 = hist4h > 0 ? 1 : (hist4h < 0 ? -1 : 0)
s1 = hist1h > 0 ? 1 : (hist1h < 0 ? -1 : 0)
s15 = hist15m > 0 ? 1 : (hist15m < 0 ? -1 : 0)
s5 = hist5m > 0 ? 1 : (hist5m < 0 ? -1 : 0)
// ===== Vérification alignement TF supérieurs =====
three_same = (s4 != 0) and (s4 == s1) and (s1 == s15)
// ===== Confirmation 5M =====
five_in_same = three_same and (s5 == s4)
// ===== Préparation du JSON pour webhook =====
signal_type = s4 == 1 ? "BUY" : (s4 == -1 ? "SELL" : "NEUTRAL")
alert_json = '{"secret":"'+repl_secret+'","symbol":"'+syminfo.ticker+'","signal":"'+signal_type+'","time":"'+str.tostring(time, "yyyy-MM-dd HH:mm:ss")+'","aligned": }'
// ===== Alertcondition compilable =====
// v6 n’accepte pas message dynamique, donc on met un message fixe
alertcondition(five_in_same and ta.change(five_in_same), title="MACD Align + 5M confirm", message="MACD alignement détecté")
// ===== Affichage optionnel des histogrammes =====
plot(hist4h, title="hist 4H", color=color.new(color.green, 0), linewidth=1)
plot(hist1h, title="hist 1H", color=color.new(color.blue, 0), linewidth=1)
plot(hist15m, title="hist 15M", color=color.new(color.orange, 0), linewidth=1)
plot(hist5m, title="hist 5M", color=color.new(color.purple, 0), linewidth=1)

MACD_RDMACD_RD - Moving Average Convergence Divergence (Ryan DeBraal)
This indicator plots a standard MACD along with a color-adaptive histogram and
integrated momentum-shift alerts. It preserves the normal MACD structure while
improving visual clarity and signal recognition.
FEATURES
-----------------------------------------------------------------------------
• Standard MACD Calculation
- Fast MA (12 by default)
- Slow MA (26)
- Signal line (9)
- Choice between SMA/EMA for both MACD and Signal smoothing
• Color-Changing Histogram
- Green shades for positive momentum
- Red shades for negative momentum
- Lighter/darker tones depending on whether momentum is increasing or fading
- 50% opacity for improved readability
• Crossover-Based MACD Line Coloring
- MACD line turns green on bullish cross (MACD > Signal)
- MACD line turns red on bearish cross (MACD < Signal)
- Default blue when no crossover occurs
• Momentum-Shift Alerts
- Alerts when histogram flips direction
PURPOSE
-----------------------------------------------------------------------------
This MACD version emphasizes momentum shifts and trend transitions by
highlighting subtle histogram changes and providing clean crossover visuals.
Ideal for:
• Identifying early momentum reversals
• Filtering breakout/trend setups
• Confirming trend continuation vs exhaustion

Price Channel Breakout Strategy — Long & ShortThis strategy is a dual-direction Price Channel breakout system designed for high-volatility indices such as US30, NAS100, and XAUUSD.
It enters long when price breaks above the highest high of the past N bars, and enters short when price breaks below the lowest low.
A key feature is the use of fixed dollar-based take-profit and stop-loss, making the strategy adaptive across symbols with different tick values.
Core Logic
Long entry when price breaks the N-bar high
Short entry when price breaks the N-bar low
Dollar-based TP and SL (converted to ticks automatically)
Suitable for trending and breakout-friendly markets
Backtest Notes (US30 Example)
Sharpe Ratio: 2.7
Profit Factor: 2.111
Total Return (12-month backtest): +46.89%
Max Drawdown: 0.26%
Trades: 3,666
This strategy performs well in sustained volatility environments and is particularly effective for intraday momentum bursts on US30.

Hash SupertrendHash Supertrend is a visually enhanced Supertrend-based indicator designed by Hash Capital Research, tuned specifically for crypto trend trading on Solana (SOL) and Bitcoin (BTC). It combines institutional-style color coding, an optional session time filter, and production-ready alerts for systematic and discretionary traders alike.
What This Indicator Is
Hash Supertrend is a trend-following volatility band indicator built on TradingView’s native ta.supertrend() function.
It’s optimized and visually styled for:
High-volatility crypto pairs (especially SOL/USDT, SOL/USD, BTC/USDT, BTC/USD)
Timeframes typically used by crypto traders (from 5m scalping to 4H swing and 1D trend following)
The script is an indicator, not a strategy:
It does not place trades or show backtest results.
It provides clear trend states, flips, and alerts that you can plug into your own execution stack or manual trading.
Key Features
✅ Tuned for Crypto (Solana & Bitcoin)
Parameters are chosen to respond well to the volatility profile of SOL and BTC, reducing noise while still catching strong moves.
✅ Non-repainting Supertrend Core
Uses TradingView’s built-in ta.supertrend — values may move intrabar as the bar forms, but once a bar closes, the historical line and signals do not repaint.
✅ Fluorescent Trend Visualization
Bright green for bullish phases
Bright red for bearish phases
Adaptive color intensity based on user setting
✅ Glow Layer & Trend Zones
Glow effect around the Supertrend line for instant visual recognition
Optional filled zones between price and line for “trend cloud” style visualization
✅ Time Filter (Session Control)
Option to only mark signals during specific hours for those wanting to integrate with webhooks
Designed for traders who avoid certain sessions (e.g., low-liquidity hours)
✅ Signal Dots & Alerts
Tiny green dots for bullish flips
Tiny red dots for bearish flips
Professional, preconfigured alerts for:
Long Entry
Short Entry
Any Trend Change
Filtered signals outside trading hours (for monitoring only)
The core logic is built on:
ATR Length (ATR Length) Default: 16
Lower values (7–10): more sensitive, more signals, more noise
Higher values (12–20): smoother, fewer but stronger trend signals
Factor (Factor) Default: 3.11
Lower values (1.5–2.5): tighter bands, earlier entries, higher whipsaws
Higher values (3.0–4.0+): wider bands, later entries, stronger trend confirmation
The indicator reads direction from ta.supertrend and classifies:
Bullish Trend: direction < 0
Bearish Trend: direction > 0
A trend flip happens when direction changes sign:
longSignal: Supertrend flips from above price to below price (bearish → bullish)
shortSignal: Supertrend flips from below price to above price (bullish → bearish)

Buffett Quality Filter (TTM)//@version=6
indicator("Buffett Quality Filter (TTM)", overlay = true, max_labels_count = 500)
// 1. Get financial data (TTM / FY / FQ)
// EPS (TTM) for P/E
eps = request.financial(syminfo.tickerid, "EARNINGS_PER_SHARE_BASIC", "TTM")
// Profitability & moat (annual stats)
roe = request.financial(syminfo.tickerid, "RETURN_ON_EQUITY", "FY")
roic = request.financial(syminfo.tickerid, "RETURN_ON_INVESTED_CAPITAL", "FY")
// Margins (TTM – rolling 12 months)
grossMargin = request.financial(syminfo.tickerid, "GROSS_MARGIN", "TTM")
netMargin = request.financial(syminfo.tickerid, "NET_MARGIN", "TTM")
// Balance sheet safety (quarterly)
deRatio = request.financial(syminfo.tickerid, "DEBT_TO_EQUITY", "FQ")
currentRat = request.financial(syminfo.tickerid, "CURRENT_RATIO", "FQ")
// Growth (1-year change, TTM)
epsGrowth1Y = request.financial(syminfo.tickerid, "EARNINGS_PER_SHARE_BASIC_ONE_YEAR_GROWTH", "TTM")
revGrowth1Y = request.financial(syminfo.tickerid, "REVENUE_ONE_YEAR_GROWTH", "TTM")
// Free cash flow (TTM) and shares to build FCF per share for P/FCF
fcf = request.financial(syminfo.tickerid, "FREE_CASH_FLOW", "TTM")
sharesOut = request.financial(syminfo.tickerid, "TOTAL_SHARES_OUTSTANDING", "FQ")
fcfPerShare = (not na(fcf) and not na(sharesOut) and sharesOut != 0) ? fcf / sharesOut : na
// 2. Valuation ratios from price
pe = (not na(eps) and eps != 0) ? close / eps : na
pFcf = (not na(fcfPerShare) and fcfPerShare > 0) ? close / fcfPerShare : na
// 3. Thresholds (Buffett-style, adjustable)
minROE = input.float(15.0, "Min ROE %")
minROIC = input.float(12.0, "Min ROIC %")
minGM = input.float(30.0, "Min Gross Margin %")
minNM = input.float(8.0, "Min Net Margin %")
maxDE = input.float(0.7, "Max Debt / Equity")
minCurr = input.float(1.3, "Min Current Ratio")
minEPSG = input.float(8.0, "Min EPS Growth 1Y %")
minREVG = input.float(5.0, "Min Revenue Growth 1Y %")
maxPE = input.float(20.0, "Max P/E")
maxPFCF = input.float(20.0, "Max P/FCF")
// 4. Individual conditions
cROE = not na(roe) and roe > minROE
cROIC = not na(roic) and roic > minROIC
cGM = not na(grossMargin) and grossMargin > minGM
cNM = not na(netMargin) and netMargin > minNM
cDE = not na(deRatio) and deRatio < maxDE
cCurr = not na(currentRat) and currentRat > minCurr
cEPSG = not na(epsGrowth1Y) and epsGrowth1Y > minEPSG
cREVG = not na(revGrowth1Y) and revGrowth1Y > minREVG
cPE = not na(pe) and pe < maxPE
cPFCF = not na(pFcf) and pFcf < maxPFCF
// 5. Composite “Buffett Score” (0–10) – keep it on ONE line to avoid line-continuation errors
score = (cROE ? 1 : 0) + (cROIC ? 1 : 0) + (cGM ? 1 : 0) + (cNM ? 1 : 0) + (cDE ? 1 : 0) + (cCurr ? 1 : 0) + (cEPSG ? 1 : 0) + (cREVG ? 1 : 0) + (cPE ? 1 : 0) + (cPFCF ? 1 : 0)
// Strictness
minScoreForPass = input.int(7, "Min score to pass (0–10)", minval = 1, maxval = 10)
passes = score >= minScoreForPass
// 6. Visuals
bgcolor(passes ? color.new(color.green, 80) : na)
plot(score, "Buffett Score (0–10)", color = color.new(color.blue, 0))
// Info label on last bar
var label infoLabel = na
if barstate.islast
if not na(infoLabel)
label.delete(infoLabel)
infoText = str.format(
"Buffett score: {0}\nROE: {1,number,#.0}% | ROIC: {2,number,#.0}%\nGM: {3,number,#.0}% | NM: {4,number,#.0}%\nP/E: {5,number,#.0} | P/FCF: {6,number,#.0}\nD/E: {7,number,#.00} | Curr: {8,number,#.00}",
score, roe, roic, grossMargin, netMargin, pe, pFcf, deRatio, currentRat)
infoLabel := label.new(bar_index, high, infoText,
style = label.style_label_right,
color = color.new(color.black, 0),
textcolor = color.white,
size = size.small)

Reversal_Detector//@version=6
indicator("상승 반전 탐지기 (Reversal Detector)", overlay=true)
// ==========================================
// 1. 설정 (Inputs)
// ==========================================
rsiLen = input.int(14, title="RSI 길이")
lbR = input.int(5, title="다이버전스 확인 범위 (오른쪽)")
lbL = input.int(5, title="다이버전스 확인 범위 (왼쪽)")
rangeUpper = input.int(60, title="RSI 과매수 기준")
rangeLower = input.int(30, title="RSI 과매도 기준")
// ==========================================
// 2. RSI 상승 다이버전스 계산 (핵심 로직)
// ==========================================
osc = ta.rsi(close, rsiLen)
// 피벗 로우(Pivot Low) 찾기: 주가의 저점
plFound = na(ta.pivotlow(osc, lbL, lbR)) ? false : true
// 다이버전스 조건 확인
// 1) 현재 RSI 저점이 이전 RSI 저점보다 높아야 함 (상승)
// 2) 현재 주가 저점이 이전 주가 저점보다 낮아야 함 (하락)
showBull = false
if plFound
// 이전 피벗 지점 찾기
oscLow = osc
priceLow = low
// 과거 데이터를 탐색하여 직전 저점과 비교
for i = 1 to 60
if not na(ta.pivotlow(osc, lbL, lbR) ) // 이전에 저점이 있었다면
prevOscLow = osc
prevPriceLow = low
// 다이버전스 조건: 가격은 더 떨어졌는데(Lower Low), RSI는 올랐을 때(Higher Low)
if priceLow < prevPriceLow and oscLow > prevOscLow and oscLow < rangeLower
showBull := true
break // 하나 찾으면 루프 종료
// ==========================================
// 3. 보조 조건 (MACD 골든크로스 & 이평선)
// ==========================================
= ta.macd(close, 12, 26, 9)
macdCross = ta.crossover(macdLine, signalLine) // MACD 골든크로스
ma5 = ta.sma(close, 5)
ma20 = ta.sma(close, 20)
maCross = ta.crossover(ma5, ma20) // 5일선이 20일선 돌파
// ==========================================
// 4. 시각화 (Plotting)
// ==========================================
// 1) 상승 다이버전스 발생 시 (강력한 바닥 신호)
plotshape(showBull,
title="상승 다이버전스",
style=shape.labelup,
location=location.belowbar,
color=color.red,
textcolor=color.white,
text="Bull Div\n(바닥신호)",
size=size.small,
offset=-lbR) // 과거 시점에 표시
// 2) MACD 골든크로스 (추세 확인용)
plotshape(macdCross and macdLine < 0, // 0선 아래에서 골든크로스 날 때만
title="MACD 골든크로스",
style=shape.triangleup,
location=location.belowbar,
color=color.yellow,
size=size.tiny,
text="MACD")
// 3) 이동평균선
plot(ma5, color=color.blue, title="5일선")
plot(ma20, color=color.orange, title="20일선")
// 알림 설정
alertcondition(showBull, title="상승 다이버전스 포착", message="상승 다이버전스 발생! 추세 반전 가능성")

MACD Momentum Structure & Volume Profile Sniper [MTF]**Description and Methodology**
This script offers a unique approach to Market Structure by moving away from traditional fractal-based highs and lows (which can be noisy). Instead, it utilizes **MACD Momentum Swings** to identify significant structural points, combined with an automated Fixed Range Volume Profile to pinpoint high-probability entry zones.
**1. Why MACD Structure? (The Core Concept)**
Traditional "ZigZag" or Fractal indicators rely solely on price action, often leading to fake-outs during low-volume consolidation.
* This script defines a "Swing High" only when the MACD Histogram crosses below zero (Momentum shifts Bearish).
* This script defines a "Swing Low" only when MACD crosses above zero (Momentum shifts Bullish).
By linking structure to momentum, we filter out weak price movements and focus on the true "heartbeat" of the trend.
**2. The "Mashup" Synergy: Structure + Volume + Logic**
This is not a random combination of indicators. Each component serves a specific step in the trading execution sequence:
* **Step 1 (Structure):** The script identifies a Change of Character (CHoCH) based on the MACD peaks described above.
* **Step 2 (Liquidity/Value):** When a CHoCH occurs, the script *automatically* draws a **Fixed Range Volume Profile (FRVP)** specifically covering the impulse leg that caused the break. This reveals the "Point of Control" (POC)—the hidden price level where the most volume occurred during the move.
* **Step 3 (The Sniper Entry):** The script creates a "Zone" around that POC. It then waits for Price to retrace into this zone.
* **Step 4 (Confirmation):** Once the zone is touched, the script monitors a lower timeframe (User selectable, default M1) for a fresh MACD crossover to trigger the final entry signal.
**Features**
* **Multi-Timeframe Dashboard:** Monitor the MACD Trend direction across 4 different timeframes simultaneously.
* **Dynamic Trendlines:** Automatically connects confirmed MACD peaks to visualize trend integrity.
* **Fibo Time Zones:** Projects potential future pivot points based on the duration of the previous swing.
* **Alert System:** Integrated alerts for Zone Touches and "Sniper" entries (Zone Touch + LTF Momentum Confirmation).
**How to Use**
1. **Identify Trend:** Look for the CHoCH labels. Green indicates a shift to Bullish, Red to Bearish.
2. **Wait for Pullback:** Do not chase the break. Wait for price to return to the Yellow POC Zone generated by the Volume Profile.
3. **Entry Trigger:** Watch for the "BUY" or "SELL" marks. These appear only when price hits the zone AND the lower-timeframe momentum aligns with the trade direction.
**Settings & Inputs**
* **Global MACD:** Adjust the sensitivity of the swing detection (Default 12, 26, 9).
* **Sniper Entry:** Select the timeframe used for the final confirmation (e.g., use M1 confirmation for an H1 chart structure).
* **VP Settings:** Customize how the Volume Profile looks on the chart.
*Disclaimer: This script is intended for educational purposes and market analysis. It does not provide financial advice.*

Grok/Claude Quantum Signal Pro * Enhanced v2# QSig Pro+ v2 — Dynamic RSI Enhancement
## Release: Quantum Signal Pro Enhanced v2
**Author:** ralis24 (with Claude assistance)
**Version:** 2.0
**Platform:** TradingView (Pine Script v6)
---
## Overview
Version 2 introduces **Trend-Adaptive RSI Thresholds** — a significant enhancement that dynamically adjusts buy and sell levels based on real-time trend strength. This allows the indicator to more effectively capture dips in uptrends and sell bounces in downtrends, rather than waiting for extreme oversold/overbought conditions that rarely occur during strong directional moves.
---
## The Problem v2 Solves
In the original QSig Pro+, RSI thresholds were fixed at 30 (oversold) and 70 (overbought). While these levels work well in ranging markets, they create issues in trending conditions:
- **Strong Uptrends:** Price rarely drops to RSI 30. Pullbacks typically bottom around RSI 40-50, causing missed buy opportunities.
- **Strong Downtrends:** Relief rallies rarely push RSI above 70. Bounces often exhaust around RSI 55-65, causing missed sell opportunities.
The v2 solution: **Let the market's trend strength dictate the appropriate RSI levels.**
---
## New Feature: Dynamic RSI Thresholds
### How It Works
The indicator now detects three distinct market states and applies corresponding RSI thresholds:
| Market State | Detection Criteria | RSI Buy Level | RSI Sell Level |
|--------------|-------------------|---------------|----------------|
| **Strong Uptrend** | +DI > -DI, ADX > 24, ADX rising | < 40 | > 80 |
| **Strong Downtrend** | -DI > +DI, ADX > 24, ADX rising | < 20 | > 60 |
| **Neutral/Ranging** | ADX < 24 or ADX falling | < 30 | > 70 |
### Trend State Detection Logic
```
Strong Uptrend = (+DI > -DI) AND (ADX > threshold) AND (ADX > ADX )
Strong Downtrend = (-DI > +DI) AND (ADX > threshold) AND (ADX > ADX )
Neutral = Neither condition met
```
### Anti-Whipsaw Protection
To prevent rapid switching between threshold sets during choppy transitions, a **confirmation buffer** requires the trend state to persist for a configurable number of bars (default: 2) before the indicator switches regimes.
---
## New Input Parameters
A new input group "**Dynamic RSI Thresholds**" has been added with the following settings:
| Parameter | Default | Range | Description |
|-----------|---------|-------|-------------|
| Enable Trend-Adaptive RSI Levels | ON | toggle | Master switch for the feature |
| ADX Strong Trend Threshold | 24 | 15-40 | ADX must exceed this to qualify as "strong" trend |
| ADX Rising Lookback (bars) | 3 | 1-10 | ADX must be higher than N bars ago to confirm rising |
| Trend Confirmation Bars | 2 | 1-5 | Bars trend must persist before switching thresholds |
| RSI Buy Level (Strong Uptrend) | 40 | 30-55 | Oversold threshold during confirmed uptrends |
| RSI Sell Level (Strong Uptrend) | 80 | 70-90 | Overbought threshold during confirmed uptrends |
| RSI Buy Level (Strong Downtrend) | 20 | 10-30 | Oversold threshold during confirmed downtrends |
| RSI Sell Level (Strong Downtrend) | 60 | 50-70 | Overbought threshold during confirmed downtrends |
| RSI Buy Level (Neutral/Ranging) | 30 | 20-40 | Standard oversold threshold |
| RSI Sell Level (Neutral/Ranging) | 70 | 60-80 | Standard overbought threshold |
---
## Enhanced Info Panel
The information panel now displays two new rows:
1. **Trend State** — Shows current regime: "STRONG UP" (green), "STRONG DOWN" (red), or "NEUTRAL" (gray)
2. **RSI Levels** — Displays the currently active thresholds (e.g., "40 / 80" during uptrends)
Additionally, the **ADX row** now includes a directional arrow (↑ or ↓) indicating whether ADX is rising or falling.
---
## Enhanced Signal Labels
Buy and sell labels on the chart now include contextual information:
**Before (v1):**
```
BUY: 97,234.50
```
**After (v2):**
```
BUY: 97,234.50
STRONG UP | RSI<40
```
This provides immediate visual confirmation of which threshold regime triggered the signal.
---
## Enhanced Alert System
### New Alert Conditions
Three new alerts have been added for trend state changes:
- **🔼 Strong Uptrend Started** — Fires when market transitions to strong uptrend (thresholds shift to 40/80)
- **🔽 Strong Downtrend Started** — Fires when market transitions to strong downtrend (thresholds shift to 20/60)
- **⚖️ Trend Neutralized** — Fires when trend weakens and thresholds reset to 30/70
### Enhanced Webhook JSON
The JSON alert payload now includes additional fields for bot integration:
```json
{
"action": "BUY",
"symbol": "BTC/USDT",
"price": "97234.50",
"rsi": "38.5",
"rsi_threshold": "40",
"adx": "28.3",
"fisher": "-1.87",
"trend_state": "STRONG UP"
}
```
---
## Bonus Enhancement: Dynamic Fisher Thresholds
As an additional refinement, the Fisher Transform thresholds now adjust slightly based on trend state:
| Trend State | Fisher Buy Level | Fisher Sell Level |
|-------------|------------------|-------------------|
| Strong Uptrend | -1.5 (loosened) | -2.0 (standard) |
| Strong Downtrend | -2.0 (standard) | +1.5 (loosened) |
| Neutral | -2.0 (standard) | +2.0 (standard) |
This allows the indicator to trigger signals in strong trends where momentum oscillators rarely reach extreme levels.
---
## Practical Trading Impact
### Strong Uptrend Example (BTC rally)
- **Before:** Waiting for RSI < 30 means missing most pullback entries
- **After:** RSI < 40 triggers buy signals on normal pullbacks within the trend
### Strong Downtrend Example (Bear market bounce)
- **Before:** Waiting for RSI > 70 means holding through entire relief rallies
- **After:** RSI > 60 triggers sell signals on bounce exhaustion
### Ranging Market
- Thresholds remain at traditional 30/70 levels where mean reversion works best
---
## Backward Compatibility
The dynamic RSI feature can be completely disabled by turning off "Enable Trend-Adaptive RSI Levels" in the settings. When disabled, the indicator behaves identically to v1 using the neutral threshold values (30/70).
---
## Summary of Changes
| Component | v1 | v2 |
|-----------|----|----|
| RSI Thresholds | Fixed 30/70 | Dynamic based on trend state |
| Trend State Detection | Not present | +DI/-DI + ADX + Rising confirmation |
| Whipsaw Protection | Not present | Configurable confirmation bars |
| Info Panel Rows | 10 | 12 (added Trend State, RSI Levels) |
| ADX Display | Value only | Value + direction arrow |
| Signal Labels | Price only | Price + Trend State + Threshold |
| Alert Conditions | 10 | 13 (added 3 trend state alerts) |
| Webhook Fields | 5 | 7 (added rsi_threshold, trend_state) |
| Fisher Thresholds | Fixed | Adaptive (subtle adjustment) |
---
## Recommended Settings by Market Type
### Crypto (High Volatility)
- ADX Strong Trend Threshold: 24
- RSI Buy (Uptrend): 40-45
- RSI Sell (Downtrend): 55-60
### Forex (Medium Volatility)
- ADX Strong Trend Threshold: 22
- RSI Buy (Uptrend): 38-42
- RSI Sell (Downtrend): 58-62
### Stocks/Indices (Lower Volatility)
- ADX Strong Trend Threshold: 20
- RSI Buy (Uptrend): 35-40
- RSI Sell (Downtrend): 60-65
---
## Installation
1. Open TradingView and navigate to Pine Editor
2. Remove or rename existing QSig Pro+ indicator
3. Paste the complete v2 code
4. Click "Add to Chart"
5. Configure Dynamic RSI Thresholds in settings as desired
---
*QSig Pro+ v2 — Smarter entries through trend-aware signal generation*

Real Relative Strength Indicator### What is RRS (Real Relative Strength)?
RRS is a volatility-normalized relative strength indicator that shows you – in real time – whether your stock, crypto, or any asset is genuinely beating or lagging the broader market after adjusting for risk and volatility. Unlike the classic “price ÷ SPY” line that gets completely fooled by volatility regimes, RRS answers the only question that actually matters to professional traders:
“Is this ticker moving better (or worse) than the market on a risk-adjusted basis right now?”
It does this by measuring the excess momentum of your ticker versus a benchmark (SPY, QQQ, BTC, etc.) and then dividing that excess by the average volatility (ATR) of both instruments. The result is a clean, centered-around-zero oscillator that works the same way in calm markets, crash markets, or parabolic bull runs.
### How to Use the RRS Indicator (Aqua/Purple Area Version) in Practice
The indicator is deliberately simple to read once you know the rules:
Positive area (aqua) means genuine outperformance.
Negative area (purple) means genuine underperformance.
The farther from zero, the stronger the leadership or weakness.
#### Core Signals and How to Trade Them
- RRS crossing above zero → one of the highest-probability long signals in existence. The asset has just started outperforming the market on a risk-adjusted basis. Enter or add aggressively if price structure agrees.
- RRS crossing below zero → leadership is ending. Tighten stops, take partial or full profits, or flip short if you trade both sides.
- RRS above +2 (bright aqua area) → clear leadership. This is where the real money is made in bull markets. Trail stops, add on pullbacks, let winners run.
- RRS below –2 (bright purple area) → clear distribution or capitulation. Avoid new longs, consider short entries or protective puts.
- Extreme readings above +4 or below –4 (background tint appears) → rare, very high-conviction moves. Treat these like once-a-month opportunities.
- Divergence (not plotted here, but easy to spot visually): price making new highs while the aqua area is shrinking → distribution. Price making new lows while the purple area is shrinking → hidden buying and coming reversal.
#### Best Settings by Style and Asset Class
For stocks and ETFs: keep benchmark as SPY (or QQQ for tech-heavy names) and length 14–20 on daily/4H charts.
For crypto: change the benchmark to BTCUSD (or ETHUSD) immediately — otherwise the reading is meaningless. Length 10–14 works best on 1H–4H crypto charts because volatility is higher.
For day trading: drop length to 10–12 and use 15-minute or 5-minute charts. Signals are faster and still extremely clean.
#### Highest-Edge Setups (What Actually Prints Money)
- RRS crosses above zero while price is still below a major moving average (50 EMA, 200 SMA, etc.) → early leadership, often catches the exact bottom of a new leg up.
- RRS already deep aqua (+3 or higher) and price pulls back to support without RRS dropping below +1 → textbook add-on or re-entry zone.
- RRS deep purple and suddenly turns flat or starts curling up while price is still falling → hidden accumulation, usually the exact low tick.
That’s it. Master these few rules and the RRS becomes one of the most powerful edge tools you will ever use for rotation trading...
