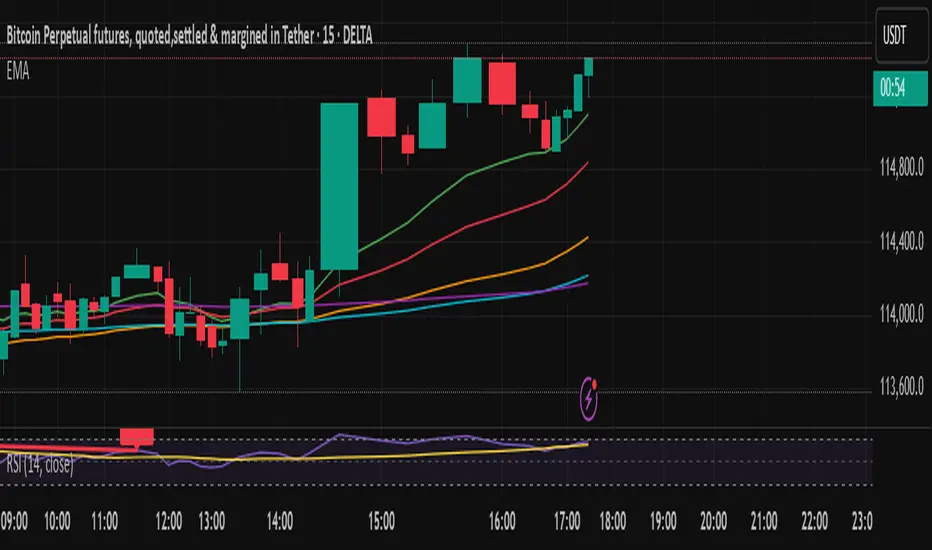
EMA H/L 20-50 Table + RSI - KHALID ALADDIN🧾 Description
EMA H/L 20-50 Table + RSI — by Khalid Aladdin
A clean and minimal indicator designed for traders and analysts who prefer a quick glance at essential EMA values without any extra clutter on the chart.
📊 Features:
Displays precise values of EMA20 (High & Low) and EMA50 (High & Low) in a compact table below the chart.
Automatically updates values based on the current timeframe.
Includes RSI reading for momentum tracking.
Large, clear text with dark-theme friendly colors.
No lines or drawings — only a clean data panel.
✅ Perfect for:
Technical analysts, swing traders, and long-term investors who want an uncluttered view of trend levels and momentum strength.
Pesquisar nos scripts por "黄金近20年走势"

EMA 200 - 50 - 20 | Davide BuncugaThis script displays three key Exponential Moving Averages (EMAs) on the chart: EMA 200, EMA 50, and EMA 20.
These moving averages are commonly used by traders to identify the overall market trend, medium-term structure, and short-term momentum.
EMA 200 – Represents the long-term trend and acts as a dynamic support/resistance.
EMA 50 – Used to identify the medium-term direction of the market.
EMA 20 – Highlights short-term momentum and pullback areas within the trend.
This indicator is designed to help traders quickly analyze market structure and align their trading decisions with the dominant trend.

9 EMA and 20 MA with Fill9 EMA and 20 MA with Fill
puts a fill green or red weather whichway the trend is going

9 & 20 EMA Cross Alert 9 and 20 EMA will be put on chart. Bull and bear signal will appear when EMAs cross. Alert is available when EMAs cross.

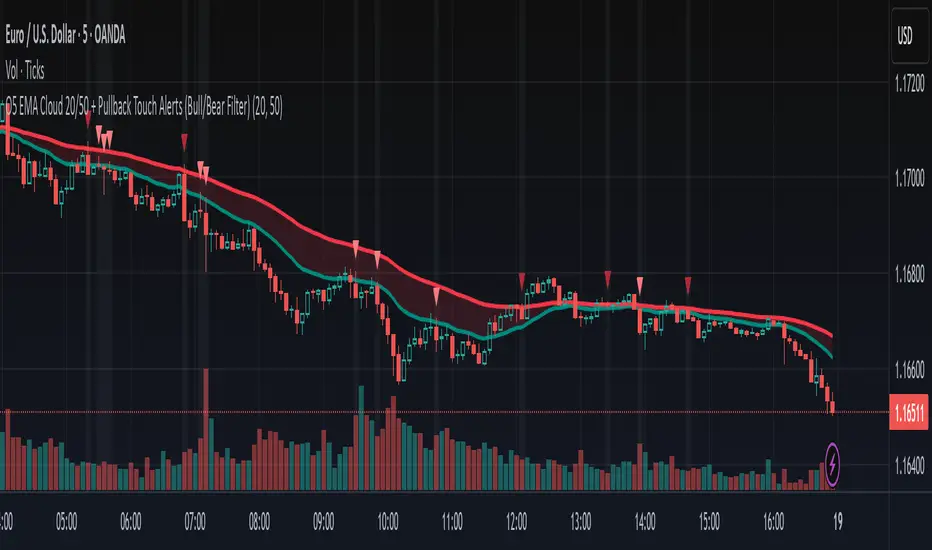
Simple EMA Cloud 20/50Shades the area between the 20 and 50 EMAs.
That's all it does, but combined with other indicators like the MACD, it gives you clear indications of entries and exits.
AND, it has no calories. What more could you ask for?


O5 EMA Cloud 20/50 + Pullback Touch Alerts (Bull/Bear Filter)This indicator shows an EMA cloud that is set to Fast=20 and Slow=50 by default, but can be changed.
It features suggested entry signals when price pulls back to either EMA level in both uptrends and downtrends.
Buy signals print only when price pulls back to one of the EMA levels and closes up.
Bearish signals only print when price pulls back to one of the EMA levels and closes down.
2 Bandas de Bollinguer (10-20) + 4 EMA + 2 SMA 2 BB (10-20) + 4 EMA (35-50-100-200) + 2 SMA (75-100) configurable

Daily Close Cross Above SMA 20 (Low)Daily closing price crosses above SMA 20 low, signals a bullish trend.


SMA 20 50 100A clean and lightweight SMA indicator that plots 20, 50, and 100 simple moving averages with customizable colors and line widths. Includes an optional label showing the latest SMA values for quick reference. Ideal for trend confirmation and swing trading setups.

Simple Moving Averages (20, 50, 100)A clean and lightweight SMA indicator that plots 20, 50, and 100 simple moving averages with customizable colors and line widths. Includes an optional label showing the latest SMA values for quick reference. Ideal for trend confirmation and swing trading setups.

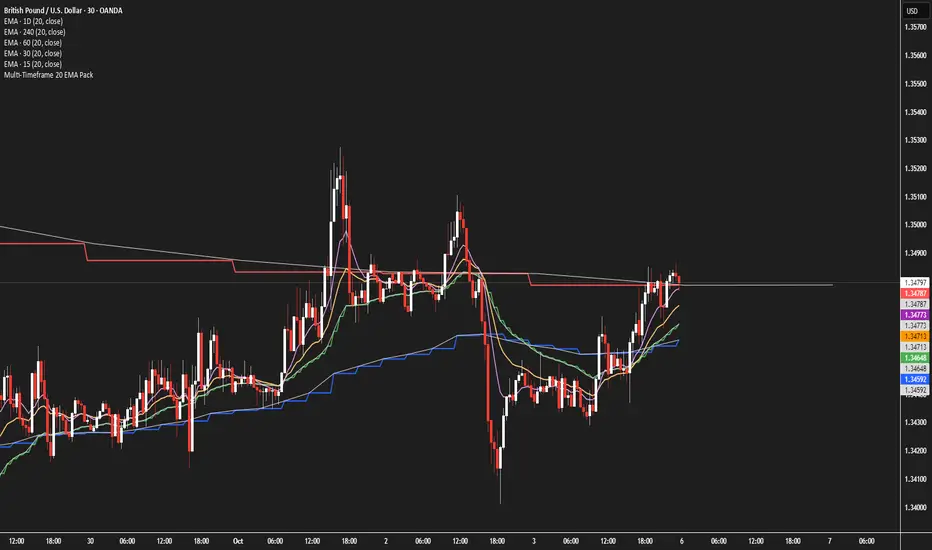
Multi-Timeframe 20 EMA PackMultiple 20 EMA's, each for a different time frame but all on the same chart.
This will help you make sure that the 20EMA has been crossed on all time frames before taking action.
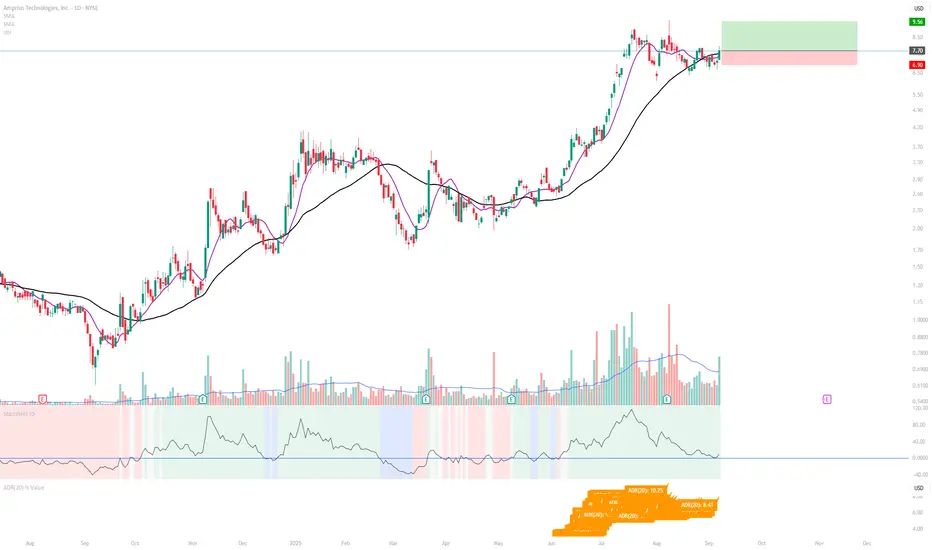
ADR(20) % ValueDisplays the 20-day Average Daily Range (ADR) as a % of price, following the method popularized by Kristjan Qullamägi (Qullamaggie). The ADR value updates dynamically and is printed directly on the chart for quick reference.
EMAs 20/50/200 with Trend ColoringIt calculates EMA 20, 50, and 200.
For each EMA, it compares the current value with the previous bar (ema > ema ).
If rising → green, if falling → red.
All three EMAs are plotted with different colors dynamically changing by slope.


MA 10/20/50A Simple MA array including 10, 20, and 50 day.
Used primarily for determining crypto bullish or bearish technical trending primarily on the 1-day chart.

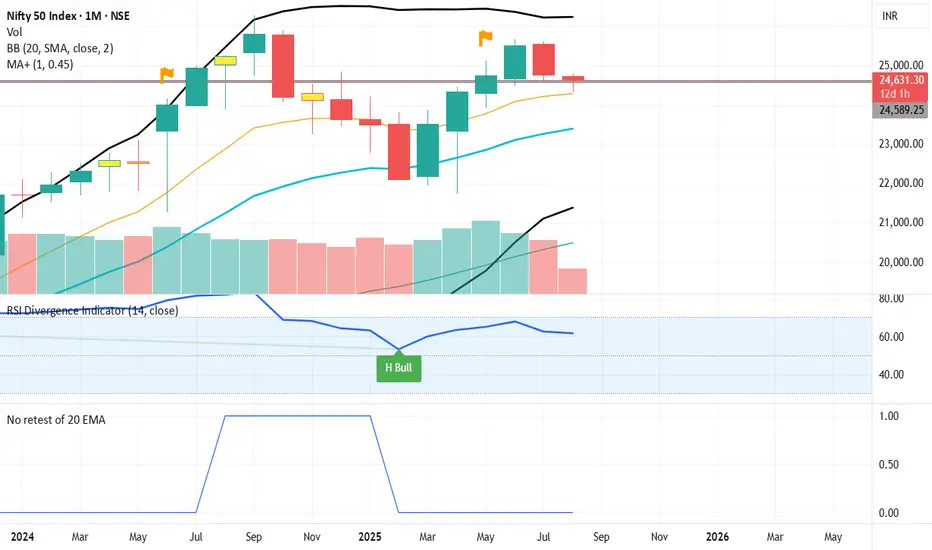
Noretest of 20 EMA since 50 dayits an indicator which represents that price is away from 20 EMA for very long interval of price movement

9 EMA & 20 EMA with Fill9 and 20 EMAs with fill to identify easily when in dynamic up trend, green when bullish, red when bearish
EMA 9, 20, 50Exponential Moving Averages of 9, 20, and 50. Used to gauge buy and sell opportunities in trending markets.
Moving Average Volume (20, 50)Shows two moving averages of volume, the 20 and 50 periods.
white bars in the background show volume, look for breaks of the target lines to confirm a breakout with volume
green shaded regions show how much higher the current volume is compared to historical volume
the greener the shade, the higher the multiple is (cap is 10x higher)
indicator is to be used with other breakout identifiers, or to help confirm the strength of a move out of an SAR level.

EMA 10/20/50/100/200plot 10, 20, 50,100,200 EMA on the chart. can be used to determine on any timeframe EMA