BTC Volume absolute (fiat vs Tether vs futures)BTC volume split by fiat, Tether and futures in USD
fiat = COINBASE + BITFLYER + BITSTAMP + KRAKEN
Tether = BITFINEX + BINANCE + HUOBI + HITBTC
futures = BITMEX + BYBIT
Pesquisar nos scripts por "鹿岛鹿角vs福冈黄蜂"

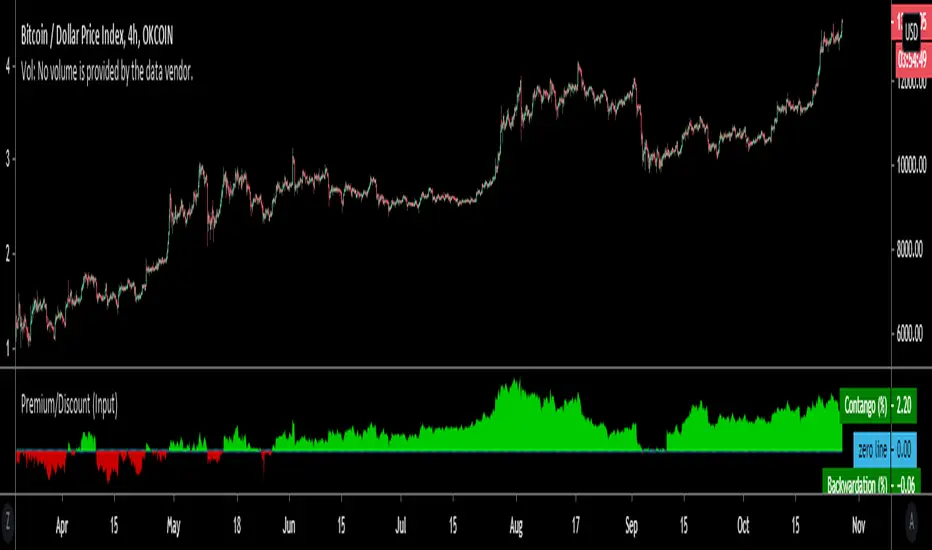
Premium/Discount (Input)Used to show Contango or Backwardation in futures contracts vs spot price. You can input your own tickers so can technically can be used to compare anything.
* In this example I'm showing Okex Quarterly contract vs Okex spot index price because it showcases it better.
* If you are using this after 2019 the default setting will not work because I set it to Bitmex which does not currently have a "current contract in front" ticker available.
It should be fairly self explanatory, but just ask below if you have any questions.
Volume Profile Free Ultra SLI (100 Levels Value Area VWAP) - RRBVolume Profile Free Ultra SLI by RagingRocketBull 2019
Version 1.0
This indicator calculates Volume Profile for a given range and shows it as a histogram consisting of 100 horizontal bars.
This is basically the MAX SLI version with +50 more Pinescript v4 line objects added as levels.
It can also show Point of Control (POC), Developing POC, Value Area/VWAP StdDev High/Low as dynamically moving levels.
Free accounts can't access Standard TradingView Volume Profile, hence this indicator.
There are several versions: Free Pro, Free MAX SLI, Free Ultra SLI, Free History. This is the Free Ultra SLI version. The Differences are listed below:
- Free Pro: 25 levels, +Developing POC, Value Area/VWAP High/Low Levels, Above/Below Area Dimming
- Free MAX SLI: 50 levels, 2x SLI modes for Buy/Sell or even higher res 150 levels
- Free Ultra SLI: 100 levels, packed to the limit, 2x SLI modes for Buy/Sell or even higher res 300 levels
- Free History: auto highest/lowest, historic poc/va levels for each session
Features:
- High-Res Volume Profile with up to 100 levels (line implementation)
- 2x SLI modes for even higher res: 300 levels with 3x vertical SLI, 100 buy/sell levels with 2x horiz SLI
- Calculate Volume Profile on full history
- POC, Developing POC Levels
- Buy/Sell/Total volume modes
- Side Cover
- Value Area, VAH/VAL dynamic levels
- VWAP High/Low dynamic levels with Source, Length, StdDev as params
- Show/Hide all levels
- Dim Non Value Area Zones
- Custom Range with Highlighting
- 3 Anchor points for Volume Profile
- Flip Levels Horizontally
- Adjustable width, offset and spacing of levels
- Custom Color for POC/VA/VWAP levels, Transparency for buy/sell levels
WARNING:
- Compilation Time: 1 min 20 sec
Usage:
- specify max_level/min_level/spacing (required)
- select range (start_bar, range length), confirm with range highlighting
- select volume type: Buy/Sell/Total
- select mode Value Area/VWAP to show corresponding levels
- flip/select anchor point to position the buy/sell levels
- use Horiz Buy/Sell SLI mode with 100 or Vertical SLI with 300 levels if needed
- use POC/Developing POC/VA/VWAP High/Low as S/R levels. Usually daily values from 1-3 days back are used as levels for the current day.
SLI:
use SLI modes to extend the functionality of the indicator:
- Horiz Buy/Sell 2x SLI lets you view 100 Buy/Sell Levels at the same time
- Vertical Max_Vol 3x SLI lets you increase the resolution to 300 levels
- you need at least 2 instances of the indicator attached to the same chart for SLI to work
1) Enable Horiz SLI:
- attach 2 indicator instances to the chart
- make sure all instances have the same min_level/max_level/range/spacing settings
- select volume type for each instance: you can have a buy/sell or buy/total or sell/total SLI. Make sure your buy volume instance is the last attached to be displayed on top of sell/total instances without overlapping.
- set buy_sell_sli_mode to true for indicator instances with volume_type = buy/sell, for type total this is optional.
- this basically tells the script to calculate % lengths based on total volume instead of individual buy/sell volumes and use ext offset for sell levels
- Sell Offset is calculated relative to Buy Offset to stack/extend sell after buy. Buy Offset = Zero - Buy Length. Sell Offset = Buy Offset - Sell Length = Zero - Buy Length - Sell Length
- there are no master/slave instances in this mode, all indicators are equal, poc/va levels are not affected and can work independently, i.e. one instance can show va levels, another - vwap.
2) Enable Vertical SLI:
- attach the first instance and evaluate the full range to roughly determine where is the highest max_vol/poc level i.e. 0..20000, poc is in the bottom half (third, middle etc) or
- add more instances and split the full vertical range between them, i.e. set min_level/max_level of each corresponding instance to 0..10000, 10000..20000 etc
- make sure all instances have the same range/spacing settings
- an instance with a subrange containing the poc level of the full range is now your master instance (bottom half). All other instances are slaves, their levels will be calculated based on the max_vol/poc of the master instance instead of local values
- set show_max_vol_sli to true for the master instance. for slave instances this is optional and can be used to check if master/slave max_vol values match and slave can read the master's value. This simply plots the max_vol value
- you can also attach all instances and set show_max_vol_sli to true in all of them - the instance with the largest max_vol should become the master
Auto/Manual Ext Max_Vol Modes:
- for auto vertical max_vol SLI mode set max_vol_sli_src in all slave instances to the max_vol of the master indicator: "VolumeProfileFree_MAX_RRB: Max Volume for Vertical SLI Mode". It can be tricky with 2+ instances
- in case auto SLI mode doesn't work - assign max_vol_sli_ext in all slave instances the max_vol value of the master indicator manually and repeat on each change
- manual override max_vol_sli_ext has higher priority than auto max_vol_sli_src when both values are assigned, when they are 0 and close respectively - SLI is disabled
- master/slave max_vol values must match on each bar at all times to maintain proper level scale, otherwise slave's levels will look larger than they should relative to the master's levels.
- Max_vol (red) is the last param in the long list of indicator outputs
- the only true max_vol/poc in this SLI mode is the master's max_vol/poc. All poc/va levels in slaves will be irrelevant and are disabled automatically. Slaves can only show VWAP levels.
- VA Levels of the master instance in this SLI mode are calculated based on the subrange, not the whole range and may be inaccurate. Cross check with the full range.
WARNING!
- auto mode max_vol_sli_src is experimental and may not work as expected
- you can only assign auto mode max_vol_sli_src = max_vol once due to some bug with unhandled exception/buffer overflow in Tradingview. Seems that you can clear the value only by removing the indicator instance
- sometimes you may see a "study in error state" error when attempting to set it back to close. Remove indicator/Reload chart and start from scratch
- volume profile may not finish to redraw and freeze in an ugly shape after an UI parameter change when max_vol_sli_src is assigned a max_vol value. Assign it to close - VP should redraw properly, but it may not clear the assigned max_vol value
- you can't seem to be able to assign a proper auto max_vol value to the 3rd slave instance
- 2x Vertical SLI works and tested in both auto/manual, 3x SLI - only manual seems to work (you can have a mixed mode: 2nd instance - auto, 3rd - manual)
Notes:
- This code uses Pinescript v3 compatibility framework
- This code is 20x-30x faster (main for cycle is removed) especially on lower tfs with long history - only 4-5 sec load/redraw time vs 30-60 sec of the old Pro versions
- Instead of repeatedly calculating the total sum of volumes for the whole range on each bar, vol sums are now increased on each bar and passed to the next in the range making it a per range vs per bar calculation that reduces time dramatically
- 100 levels consist of 50 main plot levels and 50 line objects used as alternate levels, differences are:
- line objects are always shown on top of other objects, such as plot levels, zero line and side cover, it's not possible to cover/move them below.
- all line objects have variable lengths, use actual x,y coords and don't need side cover, while all plot levels have a fixed length of 100 bars, use offset and require cover.
- all key properties of line objects, such as x,y coords, color can be modified, objects can be moved/deleted, while this is not possible for static plot levels.
- large width values cause line objects to expand only up/down from center while their length remains the same and stays within the level's start/end points similar to an area style.
- large width values make plot levels expand in all directions (both h/v), beyond level start/end points, sometimes overlapping zero line, making them an inaccurate % length representation, as opposed to line objects/plot levels with area style.
- large width values translate into different widths on screen for line objects and plot levels.
- you can't compensate for this unwanted horiz width expansion of plot levels because width uses its own units, that don't translate into bars/pixels.
- line objects are visible only when num_levels > 50, plot levels are used otherwise
- Since line objects are lines, plot levels also use style line because other style implementations will break the symmetry/spacing between levels.
- if you don't see a volume profile check range settings: min_level/max_level and spacing, set spacing to 0 (or adjust accordingly based on the symbol's precision, i.e. 0.00001)
- you can view either of Buy/Sell/Total volumes, but you can't display Buy/Sell levels at the same time using a single instance (this would 2x reduce the number of levels). Use 2 indicator instances in horiz buy/sell sli mode for that.
- Volume Profile/Value Area are calculated for a given range and updated on each bar. Each level has a fixed length. Offsets control visible level parts. Side Cover hides the invisible parts.
- Custom Color for POC/VA/VWAP levels - UI Style color/transparency can only change shape's color and doesn't affect textcolor, hence this additional option
- Custom Width - UI Style supports only width <= 4, hence this additional option
- POC is visible in both modes. In VWAP mode Developing POC becomes VWAP, VA High and Low => VWAP High and Low correspondingly to minimize the number of plot outputs
- You can't change buy/sell level colors from input (only transparency) - this requires 2x plot outputs => 2x reduces the number of levels to fit the max 64 limit. That's why 2 additional plots are used to dim the non Value Area zones
- You can change level transparency of line objects. Due to Pinescript limitations, only discrete values are supported.
- Inverse transp correlation creates the necessary illusion of "covered" line objects, although they are shown on top of the cover all the time
- If custom lines_transp is set the illusion will break because transp range can't be skewed easily (i.e. transp 0..100 is always mapped to 100..0 and can't be mapped to 50..0)
- transparency can applied to lines dynamically but nva top zone can't be completely removed because plot/mixed type of levels are still used when num_levels < 50 and require cover
- transparency can't be applied to plot levels dynamically from script this can be done only once from UI, and you can't change plot color for the past length bars
- All buy/sell volume lengths are calculated as % of a fixed base width = 100 bars (100%). You can't set show_last from input to change it
- Range selection/Anchoring is not accurate on charts with time gaps since you can only anchor from a point in the future and measure distance in time periods, not actual bars, and there's no way of knowing the number of future gaps in advance.
- Adjust Width for Log Scale mode now also works on high precision charts with small prices (i.e. 0.00001)
- in Adjust Width for Log Scale mode Level1 width extremes can be capped using max deviation (when level1 = 0, shift = 0 width becomes infinite)
- There's no such thing as buy/sell volume, there's just volume, but for the purposes of the Volume Profile method, assume: bull candle = buy volume, bear candle = sell volume
P.S. I am your grandfather, Luke! Now, join the Dark Side in your father's steps or be destroyed! Once more the Sith will rule the Galaxy, and we shall have peace...

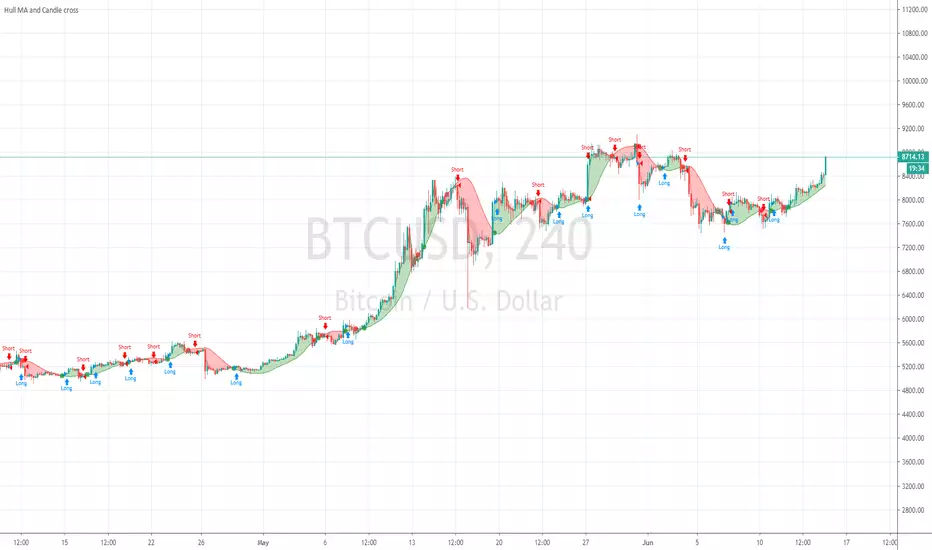
Hull MA and Candle crossHull MA vs price cossover . not 2 Hull MA's crossing, and also a price vs previous price crossover :
current price higher than previous = buy
current price lower than previous = sell
Price value set to OPEN to avoid repaint during candle
Volume Profile Free MAX SLI (50 Levels Value Area VWAP) by RRBVolume Profile Free MAX SLI by RagingRocketBull 2019
Version 1.0
All available Volume Profile Free MAX SLI versions are listed below (They are very similar and I don't want to publish them as separate indicators):
ver 1.0: style columns implementation
ver 2.0: style histogram implementation
ver 3.0: style line implementation
This indicator calculates Volume Profile for a given range and shows it as a histogram consisting of 50 horizontal bars.
It can also show Point of Control (POC), Developing POC, Value Area/VWAP StdDev High/Low as dynamically moving levels.
Free accounts can't access Standard TradingView Volume Profile, hence this indicator.
There are several versions: Free Pro, Free MAX SLI, Free History. This is the Free MAX SLI version. The Differences are listed below:
- Free Pro: 25 levels, +Developing POC, Value Area/VWAP High/Low Levels, Above/Below Area Dimming
- Free MAX SLI: 50 levels, packed to the limit, 2x SLI modes for Buy/Sell or even higher res 150 levels
- Free History: auto highest/lowest, historic poc/va levels for each session
Features:
- High-Res Volume Profile with up to 50 levels (3 implementations)
- 20-30x faster than the old Pro versions especially on lower tfs with long history
- 2x SLI modes for even higher res: 150 levels with 3x vertical SLI, 50 buy/sell levels with 2x horiz SLI
- Calculate Volume Profile on full history
- POC, Developing POC Levels
- Buy/Sell/Total volume modes
- Side Cover
- Value Area, VAH/VAL dynamic levels
- VWAP High/Low dynamic levels with Source, Length, StdDev as params
- Show/Hide all levels
- Dim Non Value Area Zones
- Custom Range with Highlighting
- 3 Anchor points for Volume Profile
- Flip Levels Horizontally
- Adjustable width, offset and spacing of levels
- Custom Color for POC/VA/VWAP levels and Transparency for buy/sell levels
Usage:
- specify max_level/min_level/spacing (required)
- select range (start_bar, range length), confirm with range highlighting
- select volume type: Buy/Sell/Total
- select mode Value Area/VWAP to show corresponding levels
- flip/select anchor point to position the buy/sell levels
- use Horiz SLI mode for 50 Buy/Sell or Vertical SLI for 150 levels if needed
- use POC/Developing POC/VA/VWAP High/Low as S/R levels. Usually daily values from 1-3 days back are used as levels for the current day.
SLI:
- use SLI modes to extend the functionality of the indicator:
- Horiz Buy/Sell 2x SLI lets you view 50 Buy/Sell Levels at the same time
- Vertical Max_Vol 3x SLI lets you increase the resolution to 150 levels
- you need at least 2 instances of the indicator attached to the same chart for SLI to work
1) Enable Horiz SLI:
- attach 2 indicator instances to the chart
- make sure all instances have the same min_level/max_level/range/spacing settings
- select volume type for each instance: you can have a buy/sell or buy/total or sell/total SLI. Make sure your buy volume instance is the last attached to be displayed on top of sell/total instances without overlapping.
- set buy_sell_sli_mode to true for indicator instances with volume_type = buy/sell, for type total this is optional.
- this basically tells the script to calculate % lengths based on total volume instead of individual buy/sell volumes and use ext offset for sell levels
- Sell Offset is calculated relative to Buy Offset to stack/extend sell after buy. Buy Offset = Zero - Buy Length. Sell Offset = Buy Offset - Sell Length = Zero - Buy Length - Sell Length
- there are no master/slave instances in this mode, all indicators are equal, poc/va levels are not affected and can work independently, i.e. one instance can show va levels, another - vwap.
2) Enable Vertical SLI:
- attach the first instance and evaluate the full range to roughly determine where is the highest max_vol/poc level i.e. 0..20000, poc is in the bottom half (third, middle etc) or
- add more instances and split the full vertical range between them, i.e. set min_level/max_level of each corresponding instance to 0..10000, 10000..20000 etc
- make sure all instances have the same range/spacing settings
- an instance with a subrange containing the poc level of the full range is now your master instance (bottom half). All other instances are slaves, their levels will be calculated based on the max_vol/poc of the master instance instead of local values
- set show_max_vol_sli to true for the master instance. for slave instances this is optional and can be used to check if master/slave max_vol values match and slave can read the master's value. This simply plots the max_vol value
- you can also attach all instances and set show_max_vol_sli to true in all of them - the instance with the largest max_vol should become the master
Auto/Manual Ext Max_Vol Modes:
- for auto vertical max_vol SLI mode set max_vol_sli_src in all slave instances to the max_vol of the master indicator: "VolumeProfileFree_MAX_RRB: Max Volume for Vertical SLI Mode". It can be tricky with 2+ instances
- in case auto SLI mode doesn't work - assign max_vol_sli_ext in all slave instances the max_vol value of the master indicator manually and repeat on each change
- manual override max_vol_sli_ext has higher priority than auto max_vol_sli_src when both values are assigned, when they are 0 and close respectively - SLI is disabled
- master/slave max_vol values must match on each bar at all times to maintain proper level scale, otherwise slave's levels will look larger than they should relative to the master's levels.
- Max_vol (red) is the last param in the long list of indicator outputs
- the only true max_vol/poc in this SLI mode is the master's max_vol/poc. All poc/va levels in slaves will be irrelevant and are disabled automatically. Slaves can only show VWAP levels.
- VA Levels of the master instance in this SLI mode are calculated based on the subrange, not the whole range. Cross check with the full range.
WARNING!
- auto mode max_vol_sli_src is experimental and may not work as expected
- you can only assign auto mode max_vol_sli_src = max_vol once due to some bug with unhandled exception/buffer overflow in Tradingview. Seems that you can clear the value only by removing the indicator instance
- sometimes you may see a "study in error state" error when attempting to set it back to close. Remove indicator/Reload chart and start from scratch
- volume profile may not finish to redraw and freeze in an ugly shape after an UI parameter change when max_vol_sli_src is assigned a max_vol value. Assign it to close - VP should redraw properly, but it may not clear the assigned max_vol value
- you can't seem to be able to assign a proper auto max_vol value to the 3rd slave instance
- 2x Vertical SLI works and tested in both auto/manual, 3x SLI - only manual seems to work
Notes:
- This code is 20x-30x faster (main for cycle is removed) especially on lower tfs with long history - only 2-3 sec load/redraw time vs 30-60 sec of the old Pro versions
- Instead of repeatedly calculating the total sum of volumes for the whole range on each bar, vol sums are now increased on each bar and passed to the next in the range making it a per range vs per bar calculation that reduces time dramatically
- hist_base for levels still results is ugly redraw
- if you don't see a volume profile check range settings: min_level/max_level and spacing, set spacing to 0 (or adjust accordingly based on the symbol's precision, i.e. 0.00001)
- you can view either of Buy/Sell/Total volumes, but you can't display Buy/Sell levels at the same time using a single instance (this would 2x reduce the number of levels). Use 2 indicator instances in horiz buy/sell sli mode for that.
- Volume Profile/Value Area are calculated for a given range and updated on each bar. Each level has a fixed length. Offsets control visible level parts. Side Cover hides the invisible parts.
- Custom Color for POC/VA/VWAP levels - UI Style color/transparency can only change shape's color and doesn't affect textcolor, hence this additional option
- Custom Width - UI Style supports only width <= 4, hence this additional option
- POC is visible in both modes. In VWAP mode Developing POC becomes VWAP, VA High and Low => VWAP High and Low correspondingly to minimize the number of plot outputs
- You can't change buy/sell level colors from input (only plot transparency) - this requires 2x plot outputs => 2x reduces the number of levels to fit the max 64 limit. That's why 2 additional plots are used to dim the non Value Area zones
- All buy/sell volume lengths are calculated as % of a fixed base width = 100 bars (100%). You can't set show_last from input to change it
- There's no such thing as buy/sell volume, there's just volume, but for the purposes of the Volume Profile method, assume: bull candle = buy volume, bear candle = sell volume
P.S. Gravitonium Levels Are Increasing. Unobtainium is nowhere to be found!
Links on Volume Profile and Value Area calculation and usage:
www.tradingview.com
stockcharts.com
onlinelibrary.wiley.com

Bitfinex Margin ComparisonDisplays the RSI of Longs vs Shorts from Bitfinex for most majors ( BTC , ETH, LTC, XRP, EOS, NEO).
Displays RSI of both longs and shorts to gauge the short term momentum of both while also showing the ratio of Longs vs Shorts as the background.

Premium ComparisonScript to display futures premium/discount vs basis; uses Bitmex XBTUSD 10.99% as basis vs XBTM18 and XBTU18 futures , but these are configurable.

ST_Trend_ReversalSTRONG TREND REVERSAL INDICATOR
The code is the percentage difference between the spot price of a given financial asset and its 200-day MA of that period. My standard setup is Daily, and I think it's got very good predictive power at that timeframe.
It can be read in two ways:
1. Values extremely above or below the 200-period MA present chances of buying/selling agains the prevailing trend.
2. Values closely above or below the 200-period MA are make-or-break market periods, where a medium-term trend becomes evident. Breaks above or below the MA are associated with strong chances of directional movements. But it's not fool-proof as false breaks have become commonplace nowadays.
Other way to use it is as confirmation of breakdowns: For example, an asset that loses its 200-day MA and then can't rally above it becomes exposed to steep losses afterwards.
It's also helpful to use in volatility trading: the closer the asset goes to its MA, the lower goes implied vol, and thus better opportiunities to be long volatility on those occasions where direction is hard to predict.
STRI = close/(200dMA)
Values over 100 indicate percentage premiums of spot vs its moving average.
Values below indicate percentage discounts of spot vs its moving average.

Ersoy-intersection(Kesisme)-Update-1website: www.ersoytoptas.com
Newspaper : tr.investing.com
hi , Friends
i wanna be someone who wants to help everyone
updated my script he published some time ago.
What happened?
* intersection When ever Bar Color Yellow Be
* Alarms to be more comprehensible
* Short and Long Days Choosing a Opportunities
* Source Opportunities
All Charts Usable( Example ;15,30,60 ... vs) and ALL MARKETS ( Stocks , forex , ... vs)
i strive to improve further
Easy to get

Apex Edge – HTF Overlay Candles“Trade your 5m chart with the eyes of the 1H — Apex Edge brings higher-timeframe structure and liquidity sweeps directly onto your execution chart.”
Apex Edge – HTF Overlay Candles
The Apex Edge – HTF Overlay Candles indicator overlays higher-timeframe (HTF) candles directly onto your lower-timeframe chart. Instead of flipping between timeframes, you see HTF structure “breathe” live on your execution chart.
What It Does
• HTF Body Boxes → open/close zones drawn as semi-transparent rectangles.
• HTF Wick Boxes → high/low extremes projected as envelopes around each body.
• Midpoint Line → a dynamic equilibrium line that flips bias as price trades above or below.
• Sweep Arrows → one-time markers showing the first liquidity raid at HTF highs or lows.
Under the Hood
This isn’t just a visual overlay — it’s engineered for accuracy and performance in PineScript.
1. HTF Data Retrieval
• Uses request.security() to import open, high, low, close, time from any selected HTF.
• lookahead=barmerge.lookahead_off ensures OHLC values update bar by bar as the HTF
candle builds.
• When the HTF bar closes, boxes and midpoint lock to historical values — matching the
native HTF chart exactly.
2. Box Construction
• Body box: built from HTF open → close.
• Wick box: built from HTF high → low.
• Boxes extend dynamically across each HTF period, updating in real time, then freeze at
close.
3. Midpoint Logic
• (htfOpen + htfClose) / 2 calculates intrabar midpoint.
• Line drawn edge-to-edge across the active HTF body.
• Style, width, color, and opacity are user-controlled.
4. Sweep Detection
• Flags (sweepedHigh / sweepedLow) prevent clutter: only the first tap per side per HTF
candle is marked.
• Lower-timeframe price breaking the HTF high/low triggers the sweep arrow.
• Arrows are offset above/below wick envelopes for clean visuals.
5. Customisation
• Every layer (body, wick, midpoint, arrows) has independent color + opacity settings.
• Arrow size, arrow color, and transparency are adjustable.
• Default HTF = 1H (perfect for 5m/15m traders) but can be switched to 30m, 4H, Daily,
etc.
Why It’s Useful
• HTF intent + LTF execution without chart hopping.
• Liquidity mapping: see where liquidity is swept in real time.
• Bias clarity: midpoint line defines HTF equilibrium.
• Clean signals: only the first sweep prints — no spam.
What Makes It Different
Most MTF overlays just plot candles or single lines. This tool:
• Splits body vs wick zones for institutional precision.
• Updates live intrabar (no repainting).
• Highlights liquidity sweeps clearly.
• Built for readability and professional use — not another retail signal toy.
Cheat-Sheet Playbook
1️⃣ Structure Bias
• Above midpoint line = bullish intent.
• Below midpoint line = bearish intent.
• Chop around midpoint = no clear direction.
2️⃣ Liquidity Sweeps
• ▲ Green up arrow below wick box = sell-side liquidity taken → watch for longs.
• ▼ Red down arrow above wick box = buy-side liquidity taken → watch for shorts.
• First sweep is the cleanest.
3️⃣ Trade Logic
• Body box = where institutions transact.
• Wick box = liquidity traps.
• Midpoint = bias filter.
• Best setups occur when sweep + midpoint flip align.
4️⃣ Example (5m + 1H Overlay)
1. ▲ Green up arrow prints below HTF wick.
2. Price reclaims the body box.
3. Midpoint flips to support.
4. Enter long → stop below sweep → targets = midpoint first, opposite wick second.
In short:
• Boxes = structure
• Wicks = liquidity pools
• Midpoint = bias line
• Arrows = liquidity sweeps
This is your SMC edge on one chart — HTF structure and liquidity fused directly into your execution timeframe.

Dynamic Stop Loss Optimizer [BackQuant]Dynamic Stop Loss Optimizer
Overview
Stop placement decides expectancy. This tool gives you three professional-grade, adaptive stop engines, ATR, Volatility, and Hybrid. So your exits scale with current conditions instead of guessing fixed ticks. It trails intelligently, redraws as the market evolves, and annotates the chart with clean labels/lines and a compact stats table. Pick the engine that fits the trade, or switch on the fly.
What it does
Calculates three adaptive stops in real time (ATR-based, Volatility-based, and Hybrid) and keeps them trailed as price makes progress.
Shows exactly where your risk lives with on-chart levels, color-coded markers (long/short), and precise “Risk %” labels at the current bar.
Surfaces context you actually use - current ATR, daily volatility, selected method, and the live stop level—in a tidy, movable table.
Fires alerts on stop hits so you can automate exits or journal outcomes without staring at the screen.
Why it matters
Adaptive risk control: Stops expand in fast tape and tighten in quiet tape. You’re not punished for volatility; you’re aligned with it.
Consistency across assets: The same playbook works whether you’re trading indexes, FX, crypto, or equities, because the engine normalizes to each symbol’s behavior.
Cleaner decision-making: One chart shows your entry idea and its invalidation in the same breath. If price trespasses, you know it instantly.
The three methods (choose your engine)
1) ATR Based “Structure-aware” distance
This classic approach keys off Average True Range to set a stop just beyond typical bar-to-bar excursion. It adapts smoothly to changing ranges and respects swing structure.
Use when: you want a steady, intuitive buffer that tracks trend legs without hugging price.
See it in action:
2) Volatility Based “Behavior-aware” distance
This engine derives stop distance from current return volatility (annualized, then scaled back down to the session). It reacts to regime shifts quickly and normalizes risk across symbols with very different prices.
Use when: you want the stop to breathe with realized volatility and respond faster to heat-ups/cool-downs.
See it in action:
3) Hybrid “Best of both worlds”
The Hybrid blends the ATR and Volatility distances into one consensus level, then trails it intelligently. You get the structural common sense of ATR and the regime sensitivity of Vol.
Use when: you want robust, all-weather behavior without micromanaging inputs.
See it in action:
How it trails
Longs: The stop ratchets up with favorable movement and holds its ground on shallow pullbacks. If price closes back into the risk zone, the level refreshes to the newest valid distance.
Shorts: Mirror logic ratchets down with trend, resists noise, and refreshes if price reclaims the zone.
Hybrid trailing: Uses the blended distance and the same “no give-backs” principle to keep gains protected as structure builds.
Reading the chart
Markers: Circles = ATR stops, Crosses = Vol stops, Diamonds = Hybrid. Colors indicate long (red level under price) vs short (green level above price).
Lines: The latest active stop is extended with a dashed line so you can see it at a glance.
Labels: “Long SL / Short SL” shows the exact price and current risk % from the last close no math required.
Table: ATR value, Daily Vol %, your chosen Method, the Current SL, and Risk %—all in one compact block that you can pin top-left/right/center.
Quick workflow
Define the idea: Long or Short, and which engine fits the tape (ATR, Vol, or Hybrid).
Place and trail: Let the optimizer print the level; trail automatically as the move develops.
Manage outcomes: If the line is tagged, you’re out clean. If it holds, you’ve contained heat while giving the trade room to work.
Inputs you’ll actually touch
Calculation Settings
ATR Length / Multiplier: Controls the “structural” cushion.
Volatility Length / Multiplier: Controls the “behavioral” cushion.
Trading Days: 252 or 365 to keep the volatility math aligned with the asset’s trading calendar.
Stop Loss Method
ATR Based | Volatility Based | Hybrid : Switch engines instantly to fit the trade.
Position Type
Long | Short | Both : Show only what you need for the current strategy.
Visual Settings
Show ATR / Vol / Hybrid Stops: Toggle families on/off.
Show Labels: Print price + Risk % at the live stop.
Table Position: Park the metrics where you like.
Coloring
Long/Short/Hybrid colors: Set a palette that matches your theme and stands out on your background.
Practical patterns to watch
Trend-pullback continuation: The stop ratchets behind higher lows (long) or lower highs (short). If price tests the level and rejects, that’s your risk-defined continuation cue.
Break-and-run: After a clean break, the Hybrid will usually sit slightly wider than pure Vol, use it to avoid getting shaken on the first retest.
Range compression: When the ATR and Vol distances converge, the table will show small Risk %. That’s your green light to size up with the same dollar risk, or keep it conservative if you expect expansion.
Alerts
Long Stop Loss Hit : Notifies when price crosses below the live long stop.
Short Stop Loss Hit : Notifies when price crosses above the live short stop.
Why this feels “set-and-serious”
You get a single look that answers three questions in real time: “Where’s my line in the sand?”, “How much heat am I taking right now?”, and “Is this distance appropriate for current conditions?” With ATR, Vol, and Hybrid in one tool, you can run the exact same playbook across symbols and regimes while keeping your chart clean and your risk explicit.

leventtazeleventtaze is an open-source, arrow-based entry indicator designed for multi-markets: crypto, forex, gold and commodities.
It blends trend logic from EMA21/55 cross and EMA200 bias with an ADX filter and a dotted stop (simple supertrend-like line).
A green cloud highlights the EMA89-EMA200 zone, while a purple ATR channel visualizes expansion boundaries.
Entries appear as up/down arrows for clarity. Exits can be managed with TP1/TP2 target lines and an optional trailing stop (breakeven+).
For crypto only, BTC confirmation is used: BTC vs 200EMA and BTC.D/USDT.D context. For non-crypto markets this confirmation is off by default.
The tool supports any symbol and timeframe. It also includes alerts: BUY, SELL, EXIT, PUMP/DUMP and Upper/Lower Wick traps.
Recommended usage: confirm on bar close for stability; if you want more signals, lower the ADX threshold and cooldown; if you want higher quality, raise ADX and use higher timeframes.
Known limits: sideways markets can produce fake breakouts; increase ADX in choppy conditions.
This script does not repaint on closed bars. Educational only; not financial advice.

Bar Statistics - DELTA/OI/TOTAL/BUY/SELL/LONGS/SHORTSBar Statistics - Advanced Volume & Open Interest Analysis
Overview
The Bar Statistics indicator is a comprehensive analytical tool designed to provide traders with detailed insights into market microstructure through advanced volume analysis, open interest tracking, and market flow detection. This indicator transforms complex market data into easily digestible visual information, displaying six key metrics in customizable colored boxes that update in real-time.
Unlike traditional volume indicators that only show basic volume data, this indicator combines multiple data sources to reveal the underlying forces driving price movement, including volume delta calculations from lower timeframes, open interest changes, and estimated market positioning.
What Makes This Indicator Unique
1. Multi-Timeframe Volume Delta Precision
The indicator utilizes lower timeframe data (default 1-second) to calculate highly accurate volume delta measurements, providing much more precise buy/sell pressure analysis than standard timeframe-based calculations. This approach captures intraday volume dynamics that are often missed by conventional indicators.
2. Real-Time Updates
Unlike many indicators that only update on bar completion, this tool provides live updates for the developing candle, allowing traders to see evolving market conditions as they happen.
3. Market Flow Analysis
The unique "L/S" (Long/Short) metric combines open interest changes with price/volume direction to estimate net market positioning, helping identify when participants are accumulating or distributing positions.
4. Adaptive Visual Intensity
The gradient color system automatically adjusts based on historical context, making it easy to identify when current values are significant relative to recent market activity.
5. Complete Customization
Every aspect of the display can be customized, from the order of metrics to individual color schemes, allowing traders to adapt the tool to their specific analysis needs.
6.All In One Solution
6 Metrics in one indicator no more using 5 different indicators.
Core Features Explained
DELTA (Volume Delta)
What it shows: Net difference between aggressive buy volume and aggressive sell volume
Calculation: Uses lower timeframe data to determine whether each trade was initiated by buyers or sellers
Interpretation:
Positive values indicate aggressive buying pressure
Negative values indicate aggressive selling pressure
Magnitude indicates the strength of directional pressure
OI Δ (Open Interest Change)
What it shows: Change in open interest from the previous bar
Data source: Fetches open interest data using the "_OI" symbol suffix
Interpretation:
Positive values indicate new positions entering the market
Negative values indicate positions being closed
Combined with price direction, reveals market participant behavior
L/S (Net Long/Short Bias)
What it shows: Estimated net change in long vs short market positions
Calculation method: Combines open interest changes with price/volume direction using configurable logic
Scenarios analyzed:
New Longs: Rising OI + Rising Price/Volume = Long position accumulation
Liquidated Longs: Falling OI + Falling Price/Volume = Long position exits
New Shorts: Rising OI + Falling Price/Volume = Short position accumulation
Covered Shorts: Falling OI + Rising Price/Volume = Short position exits
Result: Net bias toward long (positive) or short (negative) market sentiment
TOTAL (Total Volume)
What it shows: Standard volume for the current bar
Purpose: Provides context for other metrics and baseline activity measurement
Enhanced display: Uses gradient intensity based on recent volume history
BUY (Estimated Buy Volume)
What it shows: Estimated aggressive buy volume
Calculation: (Total Volume + Delta) / 2
Use case: Helps quantify the actual buying pressure in monetary/contract terms
SELL (Estimated Sell Volume)
What it shows: Estimated aggressive sell volume
Calculation: (Total Volume - Delta) / 2
Use case: Helps quantify the actual selling pressure in monetary/contract terms
Configuration Options
Timeframe Settings
Custom Timeframe Toggle: Enable/disable custom lower timeframe selection
Timeframe Selection: Choose the precision level for volume delta calculations
Auto-Selection Logic: Automatically selects optimal timeframe based on chart timeframe
Net Positions Calculation
Direction Method: Choose between Price-based or Volume Delta-based direction determination
Value Method: Select between Open Interest Change or Volume for position size calculations
Display Customization
Row Order: Completely customize which metrics appear and in what order (6 positions available)
Color Schemes: Individual color selection for positive/negative values of each metric
Gradient Intensity: Configurable lookback period (10-200 bars) for relative intensity calculations
Visual Elements
Box Format: Clean, professional box display with clear labels
Color Coding: Intuitive color schemes with customizable transparency gradients
Real-time Updates: Live updating for developing candles with historical stability
How to Use This Indicator
For Day Traders
Volume Confirmation: Use DELTA to confirm breakout validity - strong directional moves should show corresponding volume delta
Entry Timing: Watch for volume delta divergences at key levels to time entries
Exit Signals: Monitor when aggressive volume shifts against your position
For Swing Traders
Market Flow: Focus on the L/S metric to identify when participants are accumulating or distributing
Open Interest Analysis: Use OI Δ to confirm whether moves are backed by new money or position adjustments
Trend Validation: Combine multiple metrics to validate trend strength and sustainability
For Scalpers
Real-time Edge: Utilize the live updates to see developing imbalances before bar completion
Quick Decision Making: Focus on DELTA and BUY/SELL for immediate market pressure assessment
Volume Profile: Use TOTAL volume context for optimal entry/exit sizing
Setup Recommendations
Futures Markets: Enable OI tracking and use Volume Delta direction method
Crypto Markets: Focus on DELTA and volume metrics; OI may not be available
Stock Markets: Use Price direction method with volume value calculations
High-Frequency Analysis: Set lower timeframe to 1S for maximum precision
Technical Implementation
Data Accuracy
Utilizes TradingView's ta.requestVolumeDelta() function for precise buy/sell classification
Implements error checking for data availability
Handles missing data gracefully with fallback calculations
Performance Optimization
Efficient array management with configurable lookback periods
Smart box creation and deletion to prevent memory issues
Optimized real-time updates without historical data corruption
Compatibility
Works on all timeframes from seconds to daily
Compatible with futures, forex, crypto, and stock markets
Automatically adjusts calculation methods based on available data
Risk Disclaimers
This indicator is designed for educational and analytical purposes. It provides statistical analysis of market data but does not guarantee trading success. Users should:
Combine with other forms of analysis
Practice proper risk management
Understand that past performance doesn't predict future results
Be aware that volume delta and open interest data quality varies by market and data provider
Conclusion
The Bar Statistics indicator represents a significant advancement in retail trader access to professional-grade market analysis tools. By combining multiple data sources into a single, customizable display, it provides the depth of analysis needed for comprehensive market microstructure understanding while maintaining the simplicity required for effective decision-making.

Keyzone🔑 Keyzone Levels (KZ)
KZ3 (Light Green) → Short-term support zone
KZ8 (Dark Green) → Medium-term support / resistance zone
KZ21 (Orange) → Main decision zone, often used to confirm trend direction
KZ89 (Red) → Long-term boundary, defines strong support/resistance in Sideway markets
📌 Keyzone levels are dynamic zones that adjust as the market moves. They help identify bias (trend vs sideway) and setups such as Trap Reversal (TRS), Swing Reversal (SRS), and Snapback (SBS) in the Keyzone Master Framework.

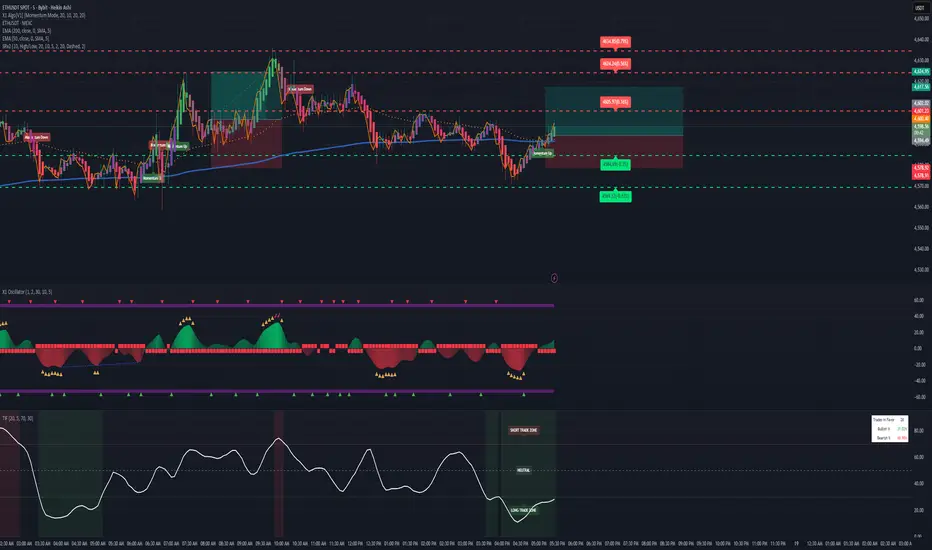
Trades in FavorTrades in Favor Indicator
Overview
The Trades in Favor indicator is a volume-weighted momentum oscillator that helps traders identify market conditions favoring long or short positions. It analyzes the relationship between price movements and volume to determine whether buying or selling pressure is dominating the market.
How It Works
The indicator calculates the percentage of volume-weighted price movements that are bullish versus bearish over a specified lookback period. It outputs values between 0-100:
Values above 70: Short Trade Zone (bearish conditions)
Values below 30: Long Trade Zone (bullish conditions)
Values around 50: Neutral Zone (balanced conditions)
Key Features
Volume-Weighted Analysis: Incorporates volume data for more accurate momentum readings
Clear Trading Zones: Visual zones with labels for immediate context
Customizable Parameters: Adjustable calculation length and smoothing periods
Built-in Alerts: Notifications when entering different trading zones
Information Table: Real-time display of current readings and percentages
Parameters
Calculation Length (20): Number of bars for momentum calculation
Smoothing Period (5): Moving average smoothing for cleaner signals
Short Trade Zone (70): Upper threshold for short trade conditions
Long Trade Zone (30): Lower threshold for long trade conditions
Trading Applications
Trend Confirmation: Validate trend direction with volume-backed momentum
Entry Timing: Identify optimal entry points in respective trade zones
Market Sentiment: Gauge overall buying vs selling pressure
Risk Management: Avoid trades against dominant market flow
Visual Elements
White oscillator line with clear zone boundaries
Background coloring in extreme zones
On-chart labels for immediate context
Information table showing current percentages
Customizable alert conditions
Best Practices
Use in conjunction with other technical analysis tools
Consider multiple timeframes for confirmation
Pay attention to volume spikes in extreme zones
Watch for divergences between price and the indicator
Perfect for swing traders, day traders, and anyone looking to align their trades with volume-backed market momentum.
BB + OBV + RSI Strategy (Enhanced + Daily Table) Script Brief – *BB + OBV + RSI Strategy (Enhanced + Daily Table)*
This TradingView Pine Script combines **Bollinger Bands (BB)**, **On-Balance Volume (OBV)**, **Relative Strength Index (RSI)**, and **Exponential Moving Average (EMA)** to help traders identify potential trend conditions and market strength.
**Key Features:**
* **Bollinger Bands** (20-period SMA ± 2 Std Dev by default) to track volatility and price extremes.
* **OBV & OBV Moving Average** to confirm buying or selling pressure.
* **RSI** to highlight overbought and oversold zones.
* **200 EMA** as a long-term trend filter.
* **Daily Comparison Table** (top-right corner):
* Displays today’s vs. yesterday’s values for Close, RSI, OBV vs MA, BB Position, and EMA Trend.
* Helps quickly assess whether momentum and trend conditions are strengthening or weakening.
**Usage:**
* The chart shows **BB lines and EMA** for real-time analysis on any timeframe.
* The **table provides higher-timeframe context** (daily values), making it easier to confirm signals across multiple timeframes.
* Best applied with backtesting and proper risk management.

[delta2win] ShockSentinel Early Warnings🚀 ShockSentinel Early Warnings — Advanced Multi-Symbol Shock Detection System
📊 UNIQUE METHODOLOGY:
This indicator implements a proprietary concordance-based shock detection system that goes beyond simple price movement analysis. Unlike basic pump/dump detectors, it uses a sophisticated multi-symbol correlation algorithm to validate signals across multiple assets simultaneously, significantly reducing false positives while maintaining sensitivity to genuine market shocks.
🔬 TECHNICAL APPROACH:
• Adaptive Threshold System: Automatically adjusts detection sensitivity based on timeframe using proprietary scaling algorithms:
- 1m: 0.5% threshold (ultra-sensitive for scalping)
- 3m: 1.0% threshold (high-frequency trading)
- 5m: 2.0% threshold (short-term momentum)
- 15m: 3.0% threshold (intraday swings)
- 1h: 6.0% threshold (daily moves)
- 4h+: 10.0% threshold (swing trading)
• Dual Detection Modes:
- Percent Mode: Calculates maximum percentage change within configurable lookback window (1-6 bars) using the formula: max(|(close - close ) / close * 100|) for i = 1 to window
- ATR-Normalized Mode: Uses Average True Range for volatility-adjusted detection across different market regimes: max(|close - close | / ATR) for i = 1 to window
• Concordance Algorithm: Proprietary multi-symbol validation system that requires minimum correlation count across up to 4 additional symbols, ensuring signals are validated by market-wide participation rather than isolated price movements
• Non-Repainting Architecture: Optional bar-close confirmation prevents false signals from intraday noise while maintaining real-time alert capability for immediate response
🎯 MATHEMATICAL FOUNDATION:
The core algorithm implements a sliding window maximum change detection:
Percent Change Calculation:
For each bar, the system calculates the maximum absolute percentage change over the specified window:
- PctChange = (close - close ) / close * 100
- MaxPct = max(|PctChange |) for i = 1 to window
- Signal triggers when MaxPct >= threshold
ATR-Normalized Calculation:
For volatility-adjusted detection:
- ATRChange = (close - close ) / ATR
- MaxATR = max(|ATRChange |) for i = 1 to window
- Signal triggers when MaxATR >= ATR_multiplier
Concordance Validation:
- Requires minimum N symbols showing same directional movement
- Validates signal strength through market participation
- Reduces false signals from isolated price movements
- Improves signal quality through correlation analysis
⚙️ ADVANCED FEATURES:
• Preset System: 7 pre-configured strategies with optimized parameters:
- Scalp (Ultra-Fast): 0.6x scaling, 2-bar window, real-time alerts
- Aggressive: 0.7x scaling, 2-bar window, real-time alerts
- Balanced: 1.0x scaling, 3-bar window, confirmed signals
- Conservative: 1.3x scaling, 4-bar window, confirmed signals
- Volatility-Adaptive: ATR mode, 7-period ATR, 2.5x multiplier
- Momentum (Intraday): ATR mode, 10-period ATR, 2.0x multiplier
- Swing (Slow): ATR mode, 14-period ATR, 2.8x multiplier
• Real-time vs Confirmed: Choose between immediate alerts or bar-close confirmation
• Visual Analytics: Integrated signal history table with concordance gauges and performance metrics
• Professional Alerts: Multi-format alert system (Compact, Extended, Plain, CSV) with Telegram integration and customizable messaging
💡 UNIQUE VALUE PROPOSITION:
Unlike simple price change detectors, this system provides:
1. Multi-Symbol Validation: Validates signals across multiple correlated assets, ensuring market-wide participation
2. Adaptive Thresholds: Automatically adjusts sensitivity based on timeframe and market conditions
3. Dual Signal Types: Provides both real-time and confirmed signal options for different trading styles
4. Comprehensive Analytics: Includes signal history, concordance gauges, and performance tracking
5. Advanced Concordance: Uses sophisticated correlation algorithms for signal validation
6. Professional Integration: Built-in Telegram support with customizable message formats
🔧 USAGE INSTRUCTIONS:
1. Select Preset: Choose appropriate strategy for your trading style and timeframe
2. Configure Symbols: Add up to 4 additional symbols for concordance validation
3. Set Concordance: Adjust minimum count (higher = more selective, lower = more sensitive)
4. Choose Mode: Select between real-time or confirmed signals based on your risk tolerance
5. Enable Alerts: Configure notification preferences and message formats
6. Monitor Performance: Use integrated tables to track signal quality and concordance
📈 PERFORMANCE CHARACTERISTICS:
• Optimized for Crypto: Designed specifically for high-volatility cryptocurrency markets
• Multi-Timeframe: Effective across all timeframes from 1-minute to 4-hour charts
• False Signal Reduction: Multi-symbol validation significantly reduces false positives
• Flexible Sensitivity: Adjustable thresholds allow customization for different market conditions
• Real-time Capability: Provides immediate alerts for fast-moving markets
• Confirmation Option: Bar-close confirmation for conservative trading approaches
⚠️ TECHNICAL CONSIDERATIONS:
• Real-time Mode: May generate multiple alerts per bar; use cooldown settings to manage frequency
• Data Dependencies: Concordance requires data availability for all configured symbols
• Market Regimes: ATR mode provides better performance in varying volatility conditions
• Signal Quality: Higher concordance requirements reduce false signals but may miss opportunities
• Latency: request.security calls depend on data provider latency and availability
🎯 TARGET MARKETS:
• Cryptocurrency Trading: High-volatility crypto markets with frequent shock events
• Scalping: Short-term trading strategies requiring immediate signal detection
• Swing Trading: Medium-term strategies benefiting from confirmed signals
• Portfolio Management: Multi-asset correlation analysis for risk management
• Algorithmic Trading: Systematic strategies requiring reliable signal validation
📊 SIGNAL INTERPRETATION:
• Green Arrows (Pump): Upward price shock with sufficient concordance
• Red Arrows (Dump): Downward price shock with sufficient concordance
• Large Markers: Confirmed signals with high concordance
• Small Markers: Early signals with lower concordance
• Background Colors: Visual intensity based on concordance strength
• Tables: Historical signal tracking with performance metrics

Volume Pressure Arrows[Blk0ut]Volume Pressure Arrows are an innovative (I think) market pressure tool designed to cut through noise and provide traders with a realistic, but quick insight into buying vs selling pressure and which has real control. Rather than relying on any single classic indicator, this script blends five complementary measures of price–volume dynamics—Cumulative Volume Delta (CVD), VWAP distance, OBV slope, ATR expansion, and the DMI ratio—into a unified “pressure score.”
Each component is normalized, weighted, and combined into a single metric that can be read at a glance through intuitive up and down arrows plotted directly on the chart. By transforming multiple complex data streams into a single aggregated signal, Volume Pressure Arrows help traders answer some of the hardest questions we can face: is the current move backed by conviction? is there true momentum? Is price action about to reverse?
Why It’s Different
Traditional oscillators often create conflicting signals, forcing traders to guess which one to trust. This indicator integrates five perspectives on volume and momentum pressure into a single framework, balancing raw flow (CVD), relative positioning (VWAP), trend conviction (OBV slope), volatility expansion (ATR), and directional bias (DMI). The result is a weighted, probability-minded score capped between -100 and +100 for consistency and clarity.
Important note : Inspiration for the use of directly plotted arrows came from dgtrd "https://www.tradingview.com/u/dgtrd/" and their brilliant work on LazyBear's Squeeze Indicator "https://www.tradingview.com/script/Dsr7B2xE-Squeeze-Momentum-Indicator-LazyBear-vX-by-DGT/"
How to Read It
Bullish Arrows appear below the candles when the pressure score pushes above the neutral threshold, signaling meaningful buyer dominance.
Bearish Arrows appear above the candles when pressure drops below the negative threshold, indicating strong selling pressure.
Neutral Arrows (smaller, faded) mark conditions where pressure exists but is not decisive—useful for spotting early rotations or fading momentum.
Color Gradients dynamically adjust with score intensity, making stronger signals visually brighter and weaker ones softer.
How to Use It Effectively
This tool is best applied as a confirmation and timing layer. It is not meant to replace your core strategy, but to validate whether momentum pressure supports your trade thesis.
Combine with trendlines, chart patterns, or breakouts to gauge conviction.
Use bullish or bearish arrows as filters, only take trades when price action aligns with strong directional pressure.
Watch neutral arrows near key levels; they often foreshadow balance breaking into directional moves.
Adjust the weightings to emphasize the components that matter most to your style (e.g., more weight on CVD for scalpers, or ATR expansion for volatility traders).
As with any indicator, this is not a magic ball and does not guarantee success. But it does allow you to increase the probability odds to your favor if you align it with your edge. Happy trading!

Extremum Range MA Crossover Strategy1. Principle of Work & Strategy Logic ⚙️📈
Main idea: The strategy tries to catch the moment of a breakout from a price consolidation range (flat) and the start of a new trend. It combines two key elements:
Moving Average (MA) 📉: Acts as a dynamic support/resistance level and trend filter.
Range Extremes (Range High/Low) 🔺🔻: Define the borders of the recent price channel or consolidation.
The strategy does not attempt to catch absolute tops and bottoms. Instead, it enters an already formed move after the breakout, expecting continuation.
Type: Trend-following, momentum-based.
Timeframes: Works on different TFs (H1, H4, D), but best suited for H4 and higher, where breakouts are more meaningful.
2. Justification of Indicators & Settings ⚙️
A. Moving Average (MA) 📊
Why used: Core of the strategy. It smooths price fluctuations and helps define the trend. The price (via extremes) must cross the MA → signals a potential trend shift or strengthening.
Parameters:
maLength = 20: Default length (≈ one trading month, 20-21 days). Good balance between sensitivity & smoothing.
Lower TF → reduce (10–14).
Higher TF → increase (50).
maSource: Defines price source (default = Close). Alternatives (HL2, HLC3) → smoother, less noisy MA.
maType: Default = EMA (Exponential MA).
Why EMA? Faster reaction to recent price changes vs SMA → useful for breakout strategies.
Other options:
SMA 🟦 – classic, slowest.
WMA 🟨 – weights recent data stronger.
HMA 🟩 – near-zero lag, but “nervous,” more false signals.
DEMA/TEMA 🟧 – even faster & more sensitive than EMA.
VWMA 🔊 – volume-weighted.
ZLEMA ⏱ – reduced lag.
👉 Choice = tradeoff between speed of reaction & false signals.
B. Range Extremes (Previous High/Low) 📏
Why used: Define borders of recent trading range.
prevHigh = local resistance.
prevLow = local support.
Break of these levels on close = trigger.
Parameters:
lookbackPeriod = 5: Searches for highest high / lowest low of last 5 candles. Very recent range.
Higher value (10–20) → wider, stronger ranges but rarer signals.
3. Entry & Exit Rules 🎯
Long signals (BUY) 🟢📈
Condition (longCondition): Previous Low crosses MA from below upwards.
→ Price bounced from the bottom & strong enough to push range border above MA.
Execution: Auto-close short (if any) → open long.
Short signals (SELL) 🔴📉
Condition (shortCondition): Previous High crosses MA from above downwards.
→ Price rejected from the top, upper border failed above MA.
Execution: Auto-close long (if any) → open short.
Exit conditions 🚪
Exit Long (exitLongCondition): Close below prevLow.
→ Uptrend likely ended, range shifts down.
Exit Short (exitShortCondition): Close above prevHigh.
→ Downtrend likely ended, range shifts up.
⚠️ Important: Exit = only on candle close beyond extremes (not just wick).
4. Trading Settings ⚒️
overlay = true → indicators shown on chart.
initial_capital = 10000 💵.
default_qty_type = strategy.cash, default_qty_value = 100 → trades fixed $100 per order (not lots). Can switch to % of equity.
commission_type = strategy.commission.percent, commission_value = 0.1 → default broker fee = 0.1%. Adjust for your broker!
slippage = 3 → slippage = 3 ticks. Adjust to asset liquidity.
currency = USD.
margin_long = 100, margin_short = 100 → no leverage (100% margin).
5. Visualization on Chart 📊
The strategy draws 3 lines:
🔵 MA line (thickness 2).
🔴 Previous High (last N candles).
🟢 Previous Low (last N candles).
Also: entry/exit arrows & equity curve shown in backtest.
Disclaimer ⚠️📌
Risk Warning: This description & code are for educational purposes only. Not financial advice. Trading (Forex, Stocks, Crypto) carries high risk and may lead to full capital loss. You trade at your own risk.
Testing: Always backtest & demo test first. Past results ≠ future profits.
Responsibility: Author of this strategy & description is not responsible for your trading decisions or losses.

Piano Frequency LevelsPiano Frequency Levels
This indicator applies the mathematical principles of musical harmony to market analysis, creating support and resistance levels based on authentic piano frequency ratios. Drawing from centuries-old musical theory, it maps the precise mathematical relationships between piano keys to price levels.
How It Works: The indicator uses the exact frequency ratios from equal temperament tuning - the same mathematical system that makes pianos sound harmonious. Each level represents an actual piano key frequency, scaled proportionally to your chosen anchor price.
Key Features:
• Piano-Based Ratios: Uses authentic 12-tone equal temperament frequency relationships (1.05946 ratio between semitones)
• Directional Intelligence: Automatically creates ascending levels from lows (resistance) or descending levels from highs (support)
• Musical Note Labels: Optional display of actual piano key names (C4, D#5, F6, etc.) alongside price levels
• Black Key Subdivisions: Toggle authentic sharp/flat keys between natural notes for additional precision
• Octave Color Coding: Each musical octave displays in a different color for easy visual identification
• Anchor Reference: Bright green line clearly marks your C-note reference point
Musical Foundation: Every level corresponds to an actual piano key. The anchor point represents "C" (the musical root), with levels progressing through the natural musical sequence: C, D, E, F, G, A, B, then repeating in higher octaves. This creates proportional spacing that mirrors the harmonic relationships musicians have used for centuries.
Usage:
1. Set your anchor to a significant market high or low
2. Choose your desired number of levels (typically 12-24 for 1-2 octaves)
3. Enable "Add Black Keys" for additional intermediate levels
4. Enable "Show Note Names" to see which piano key each level represents
The Theory: Musical harmony is based on precise mathematical ratios that create pleasing relationships between frequencies. These same mathematical principles may manifest in market movements, as price action often exhibits proportional relationships similar to musical intervals.
Unique Advantages:
• Based on established mathematical principles rather than arbitrary ratios
• Provides both major levels (white keys) and intermediate levels (black keys)
• Automatically adapts direction based on anchor type (high vs low)
• Maintains authentic musical relationships across all timeframes and price ranges
Important Note: This indicator presents a theoretical framework for market analysis. Like all technical analysis tools, it should be used in conjunction with other forms of analysis and proper risk management. The musical ratios provide a unique perspective on potential support and resistance levels, but past performance does not guarantee future results.
Transform your charts into a musical instrument and discover the hidden harmonies in market movements.

USD vs USDT Perp PremiumPerp Premiu. An indicator that analyzes the differences betweenvarious crypto price oracles

Advanced Trading Dashboard📊 Advanced Trading Dashboard - Multi-Indicator Analysis Tool
Comprehensive Market Analysis at a Glance
This professional trading dashboard consolidates multiple technical indicators into a single, easy-to-read overlay table that provides instant market insights for informed trading decisions.
✨ Key Features:
📈 Multi-Indicator Analysis:
Real-time Price Action vs EMA8 with percentage strength
RSI momentum with overbought/oversold signals
MACD trend confirmation with bullish/bearish status
Multi-timeframe trend analysis (EMA50/200 + Supertrend)
Volume analysis with ratio to moving average
Bollinger Bands positioning with band width metrics
ATR volatility measurements with percentage levels
Stochastic oscillator for entry/exit timing
🎯 Advanced Market Intelligence:
Automated Market Structure detection (Higher Highs/Lower Lows)
Dynamic Support & Resistance level identification
Smart Overall Signal generation based on 5+ confluence factors
Color-coded status indicators for quick visual assessment
⚙️ Customization Options:
Repositionable dashboard (6 position options)
Toggle visibility on/off
Clean, professional interface with intuitive color coding
💡 Perfect For:
Day traders seeking quick market assessment
Swing traders analyzing trend strength
Multi-timeframe analysis confirmation
Risk management and volatility assessment
Entry/exit signal confluence
The dashboard eliminates the need to switch between multiple indicators, providing all essential market data in one consolidated view. Each metric includes both numerical values and interpretive status, making it suitable for both novice and experienced traders.
Compatible with all markets and timeframes. Best used as a supplementary analysis tool alongside your existing trading strategy.

Info Panel (RSI, ADX, Volume,EMA, Delta)📊 Info Panel PRO — All-in-One Trader Dashboard
Simplify market analysis at a glance.
This powerful indicator displays key market metrics in a compact, customizable table directly overlaid on your chart — ideal for day trading, scalping, and swing trading strategies.
🔍 What’s Included:
✅ RSI (Relative Strength Index) — Measures overbought/oversold conditions.
✅ ADX (Average Directional Index) — Gauges trend strength (>25 = strong trend).
✅ Price vs 200 EMA on 4H timeframe — Strategic support/resistance level for multi-timeframe context.
✅ Current Bar Volume — Color-coded to reflect bullish/bearish sentiment.
✅ Volume Delta — Net buying/selling pressure on your chosen timeframe (default: 1 minute).
✅ CVD (Cumulative Volume Delta) — Daily running total of delta, resets each new trading day.
⚙️ Fully Customizable Settings:
Adjustable lengths for RSI, ADX, and EMA.
Select delta calculation timeframe — lower = more granular (e.g., “1” for 1-minute precision).
Table position: top/bottom left/right corners.
Color themes: Customize bullish, bearish, and neutral colors to match your style.
💡 Who Is This For?
Scalpers & Day Traders needing real-time market context without clutter.
Swing & Position Traders monitoring higher-timeframe structure and momentum.
Order Flow & Volume Analysts tracking buyer/seller imbalance via delta and CVD.
Beginners learning to read markets through consolidated, intuitive indicators.
🎯 Key Benefits:
✅ Clean, minimalist UI — stays out of your way while delivering critical data.
✅ Auto-formatting for large numbers (K, M, B) — easy readability.
✅ Visual cues (arrows, color coding) for instant decision-making.
✅ Works across all markets: Forex, Stocks, Crypto, Futures.
📌 How to Use:
Add the indicator to your chart.
Tweak settings to fit your trading style.
Monitor real-time updates — all essential metrics visible in one place.
Combine with other strategies (price action, S/R, VWAP) for signal confirmation.
📌 Pro Tip: For maximum edge, pair Info Panel PRO with liquidity zones, VWAP, or Market Profile tools.
📈 Trade smarter — let the market speak to you in clear, actionable terms.
Author:
Version: 1.0
Language: Pine Script v5
Overlay: Yes (draws directly on price chart)
😄
“If this indicator were a person, they’d be called ‘The One Who Knows Everything… But Never Gives Unsolicited Advice.’
…Unlike your ‘friend’ who yells ‘BUY!’ five minutes before the market crashes.”
“A good trader isn’t the one who predicts the market.
It’s the one who has everything on their chart — coffee optional.
…Want the next indicator? Comment ‘YES’ below — and I’ll build you ‘Smart Alert PRO’ or ‘Volume Sniper’ next.”
P.S. If this script saves even ONE trade — hit 👍.
If it saves TWO — comment “THANK YOU” 🙏
If it saves THREE — expect “Volume Heatmap PRO” next week 😉🔥
