Sessions and High/LowCan be used to mark highs and lows of any sessions you desire can do 4 sessions
Pesquisar nos scripts por "纳斯达克期货cfd"

JokaBAR
This script combines my own liquidity/liq-levels engine with open-source code from BigBeluga’s Volumatic indicators:
• “Volumatic Variable Index Dynamic Average ”
• “Volumatic Support/Resistance Levels ”
The original code is published under the Mozilla Public License 2.0 and is reused here accordingly.
What this script does
Joka puts Volumatic trend logic, dynamic support/resistance and a custom liquidation-levels module into a single overlay. The idea is to give traders one clean view of trend direction, key reactive zones and potential liquidation areas where leveraged positions can be forced out of the market.
Volumatic logic is used to build a dynamic average and adaptive levels that react to volume and volatility. On top of that, the script plots configurable liquidation zones for different leverage tiers (e.g. 5x, 10x, 25x, 50x, 100x).
How to use it
Apply the script on pairs where leverage is actually used (perpetual futures / margin).
Use the Volumatic average as a trend filter (above = long bias, below = short bias).
Treat Volumatic support/resistance levels as key reaction zones for entries, partials and stops.
Read the liquidation levels as context: clusters show where forced liquidations can fuel strong moves and bounces.
Keep the chart clean — this tool is designed to be used without stacking extra indicators on top.
The script is published as open-source in line with TradingView House Rules so that other traders can study, tweak and build on it.
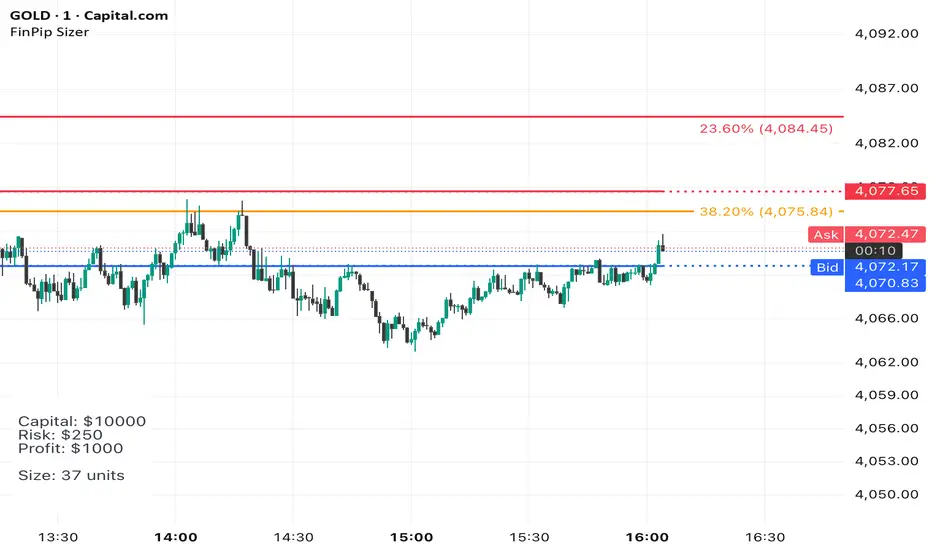
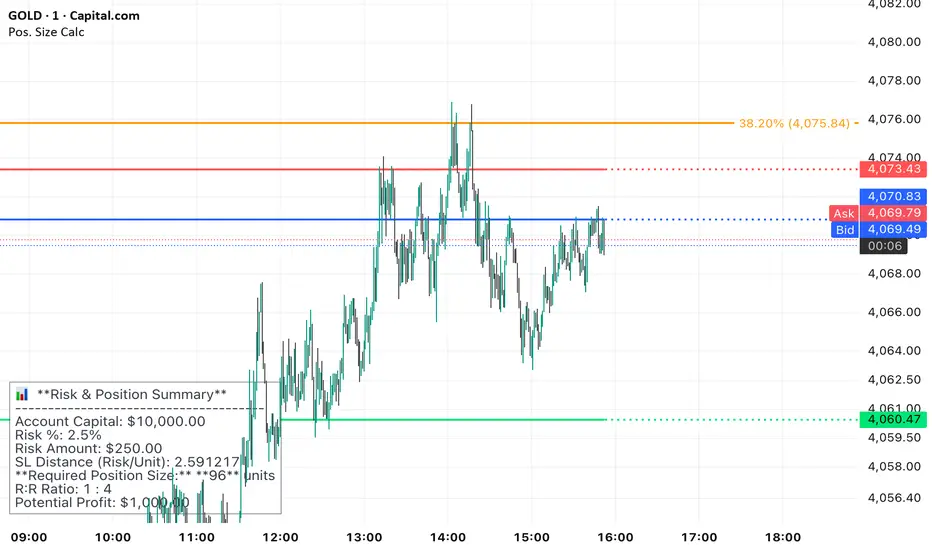
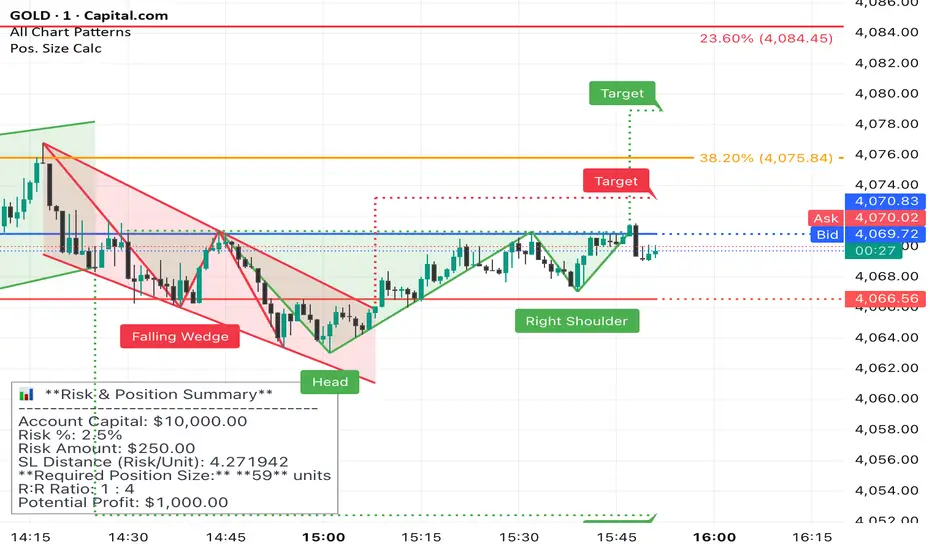
Position Sizer (FinPip)Position Sizer (FinPip)
The Position Sizer (FinPip) indicator is a crucial, all-in-one risk management tool designed to calculate the precise trade size required to limit your risk to a predetermined percentage of your total account capital.
This indicator helps you consistently execute sound risk management, regardless of the instrument's volatility or the trade's price levels.
Key Features:
Calculates Position Size: Based on your configurable Account Capital, desired Risk Percentage (default 2.5%), and the price distance between your Entry and Stop-Loss levels.
Visual Trade Planning: Plots three clear levels directly on the chart for easy visualization:
Entry Price (Blue)
Stop-Loss Price (SL) (Red)
Profit Target (Lime Green, calculated using the Reward:Risk Ratio).
Custom Risk Management: Easily adjust the Risk Percentage and the Reward:Risk Ratio (default 4.0) in the indicator's settings.
Heads-Up Display (HUD): A clean, fixed table in the bottom-left corner of the chart clearly displays all calculated metrics, including your Required Position Size (in units/shares/contracts), Risk Amount, and Potential Profit.
How to Use:
Enter your Account Capital and desired Risk % in the settings panel.
Set your desired Entry Price and Stop-Loss Price.
The indicator immediately calculates and displays the exact number of units you need to trade to maintain your risk limit.
The Position Sizer (FinPip)The Position Sizer (FinPip) indicator is a crucial, all-in-one risk management tool designed to calculate the precise trade size required to limit your risk to a predetermined percentage of your total account capital.
This indicator helps you consistently execute sound risk management, regardless of the instrument's volatility or the trade's price levels.
Key Features:
Calculates Position Size: Based on your configurable Account Capital, desired Risk Percentage (default 2.5%), and the price distance between your Entry and Stop-Loss levels.
Visual Trade Planning: Plots three clear levels directly on the chart for easy visualization:
Entry Price (Blue)
Stop-Loss Price (SL) (Red)
Profit Target (Lime Green, calculated using the Reward:Risk Ratio).
Custom Risk Management: Easily adjust the Risk Percentage and the Reward:Risk Ratio (default 4.0) in the indicator's settings.
Heads-Up Display (HUD): A clean, fixed table in the bottom-left corner of the chart clearly displays all calculated metrics, including your Required Position Size (in units/shares/contracts), Risk Amount, and Potential Profit.
How to Use:
Enter your Account Capital and desired Risk % in the settings panel.
Set your desired Entry Price and Stop-Loss Price.
The indicator immediately calculates and displays the exact number of units you need to trade to maintain your risk limit.
Position Sizer (FinPip)The Position Sizer (FinPip) indicator is a crucial, all-in-one risk management tool designed to calculate the precise trade size required to limit your risk to a predetermined percentage of your total account capital.
This indicator helps you consistently execute sound risk management, regardless of the instrument's volatility or the trade's price levels.
Key Features:
Calculates Position Size: Based on your configurable Account Capital, desired Risk Percentage (default 2.5%), and the price distance between your Entry and Stop-Loss levels.
Visual Trade Planning: Plots three clear levels directly on the chart for easy visualization:
Entry Price (Blue)
Stop-Loss Price (SL) (Red)
Profit Target (Lime Green, calculated using the Reward:Risk Ratio).
Custom Risk Management: Easily adjust the Risk Percentage and the Reward:Risk Ratio (default 4.0) in the indicator's settings.
Heads-Up Display (HUD): A clean, fixed table in the bottom-left corner of the chart clearly displays all calculated metrics, including your Required Position Size (in units/shares/contracts), Risk Amount, and Potential Profit.
How to Use:
Enter your Account Capital and desired Risk % in the settings panel.
Set your desired Entry Price and Stop-Loss Price.
The indicator immediately calculates and displays the exact number of units you need to trade to maintain your risk limit.
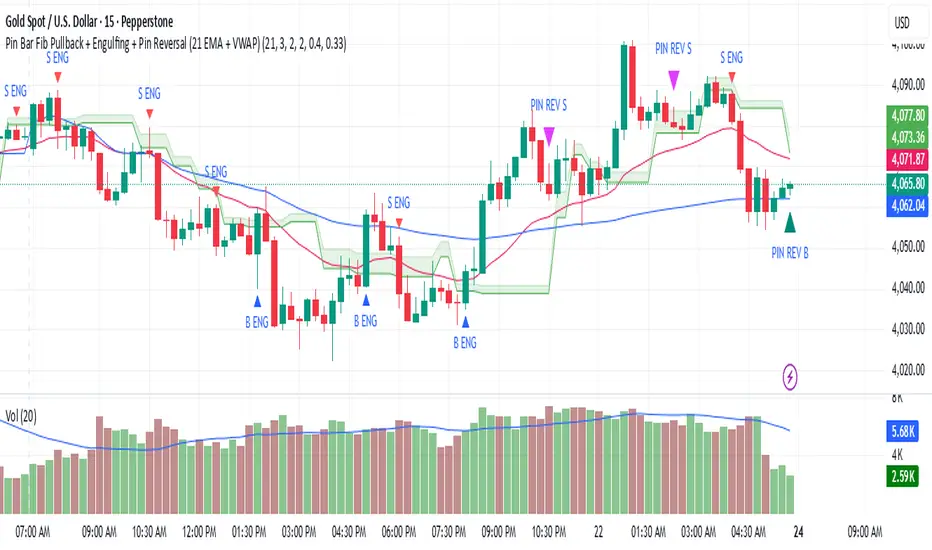
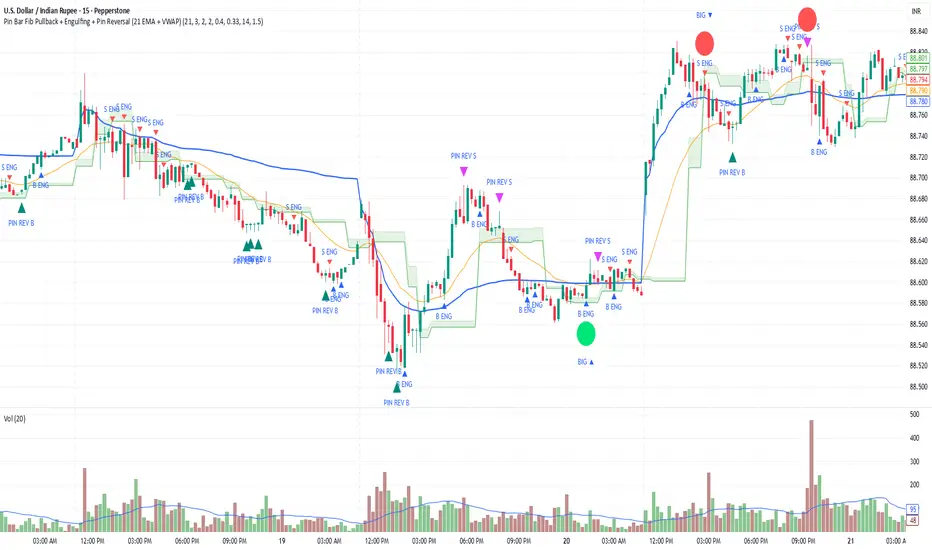
Pin Bar Fib Pullback + Engulfing + Pin Reversal (21 EMA + VWAP)Dear Traders
Pin bar fib pullback continuation (in 0.50–0.618 zone)
Bullish/Bearish engulfing
Pin bar reversals (bottom/top)
Then we ask: did the next candle move at least atrMult × ATR away from the signal close in the right direction?
For a long signal: next high ≥ signal close + ATR * atrMult
For a short signal: next low ≤ signal close − ATR * atrMult
If yes, that signal gets a big circle with text:
BIG ▲ for long
BIG ▼ for short
drawn on the original signal bar (using offset = -1 trick).
You can tune how “big” you want:
Increase ATR length for smoother ATR
Increase ATR * (e.g., from 1.5 → 2.0) to only mark really strong moves.
XAUUSD Multi-Timeframe Bias Scanner🎯 Purpose & Overview
This is a sophisticated trading indicator that analyzes XAUUSD (Gold) across 5 different timeframes simultaneously to determine market bias and trend direction.
⚙️ Core Components
2. Bias Calculation Engine
The heart of the indicator uses 5 technical factors to score each timeframe:
Technical Factors (Weighted):
Moving Average Alignment (30 points)
Bullish: EMA(9) > EMA(21) > EMA(50)
Bearish: EMA(9) < EMA(21) < EMA(50)
Price vs MA Position (20 points)
Score increases when price above MAs
Score decreases when price below MAs
RSI Momentum (20 points)
Bullish: RSI > 60 or > 50
Bearish: RSI < 40 or < 50
MACD Signals (15 points)
Bullish: MACD line > Signal line AND > 0
Bearish: MACD line < Signal line AND < 0
Volume Confirmation (15 points)
Volume spikes with price movement add confirmation
📊 Timeframe Analysis
Five Timeframes Monitored:
5-minute - Short-term noise (10% weight)
15-minute - Intraday direction (15% weight)
1-hour - Key intraday bias (25% weight)
4-hour - Primary directional bias (30% weight)
1-day - Overall trend context (20% weight)
Bias Scoring System:
0-100 Scale (50 = Neutral)
STRONG BULLISH: ≥70 (Green)
BULLISH: 55-69 (Lime)
NEUTRAL: 46-54 (Gray)
BEARISH: 31-45 (Orange)
STRONG BEARISH: ≤30 (Red)
🎨 Visual Features
1. Comprehensive Table Display
pinescript
var table biasTable = table.new(position.top_right, 3, 7, ...)
Shows a color-coded table with:
Timeframe name
Numerical bias score (0-100)
Strength description with color coding
2. Chart Visual Indicators
Background coloring based on overall bias
Label markers for strong bullish/bearish conditions
Real-time label showing all timeframe scores
3. Alert System
Triggers when overall bias crosses 70 (bullish) or 30 (bearish)
Configurable with sound options
🔄 How It Processes Data
Data Flow:
Requests security data for each timeframe using request.security()
Calculates technical indicators for each TF separately
Scores each TF based on 5 technical factors
Computes weighted overall bias
Updates visual displays and checks alert conditions
💡 Trading Applications
Bullish Scenarios:
Multiple timeframes show bullish alignment
Higher timeframe bias supports lower timeframe direction
Overall score > 70 indicates strong bullish conviction
Bearish Scenarios:
Multiple timeframes show bearish alignment
Higher timeframe bias confirms lower timeframe moves
Overall score < 30 indicates strong bearish conviction
Conflict Detection:
When timeframes show conflicting biases
Caution required - market may be consolidating
Wait for alignment before taking trades
🎚️ Customization Options
Users can modify:
Timeframe weights
Technical indicator parameters
Alert thresholds
Visual display preferences
Scoring sensitivity
📈 XAUUSD Specific Optimizations
The indicator considers Gold's unique characteristics:
High volatility periods
ATR-based volatility adjustments
Volume confirmation for breakouts
Multiple timeframe confirmation for trend reliability
This creates a powerful tool for identifying high-probability trade setups in XAUUSD by ensuring traders have a complete multi-timeframe perspective before entering positions.

Thirdeyechart Global Gold PercentageThe global gold percentage – Percentage Change Indicator is a TradingView tool developed to help traders monitor multiple currency pairs and precious metals in one glance. This indicator was coded personally, using custom formulas to calculate the percentage change for each symbol over selected timeframes, making it unique and fully tailored to individual analysis needs.
Users can input any symbols they wish to track as a comma-separated list, making it highly flexible. The script automatically calculates percentage changes for Daily (D), 1-Hour (H1), and 4-Hour (H4) timeframes. Positive changes are highlighted in blue and negative changes in red, allowing for an instant visual representation of market movements. The table updates in real-time, giving traders immediate feedback without needing to switch between charts.
Designed with simplicity and functionality in mind, this indicator is ideal for intraday traders, swing traders, or anyone who wants to keep an eye on multiple markets efficiently. It works for currency pairs, metals like gold (XAUUSD, XAUJPY), or any TradingView-available symbol. The table is positioned at the top-right corner of the chart and automatically adapts to the number of symbols entered.
This script is purely informational and educational, providing a clear view of price movements but not offering buy or sell signals. Traders should perform their own analysis and risk management before making any trading decisions.
Disclaimer / Copyright:
© 2025 Thirdeyechart. All rights reserved. This indicator is for educational and informational purposes only. The author is not responsible for any trading losses or financial decisions made based on this script. Redistribution, copying, or commercial use of this code without permission is strictly prohibited.

jhehli LiquidityWhat are BSL and SSL?
In the context of Smart Money Concepts, liquidity simply refers to pending orders—specifically Stop Losses and Buy/Sell Stop orders—resting above old highs and below old lows.
BSL (Buy-Side Liquidity): This is found above Swing Highs. Retail traders who are short the market will place their "Buy Stop" protective orders here. Additionally, breakout traders place "Buy Limit" orders here. Smart Money views this area as a pool of willing buyers. To fill large sell orders, institutions must drive price up into this liquidity to pair their massive sell interest with these buy stops.
SSL (Sell-Side Liquidity): This is found below Swing Lows. Retail traders who are long the market place their "Sell Stop" protective orders here. Smart Money targets these levels to accumulate long positions. They need the market to sell off into these levels so they can buy from the willing sellers at a discount.
How this Indicator Works
This tool automates the process of market structure analysis by identifying key Swing Highs and Swing Lows.
Detection: It scans price action to find fractal highs and lows (classic swing points) where price has rejected a level.
Visualization: It projects a line from these points, clearly marking where the "stops" are likely residing.
Liquidity Raids: When price pierces these levels, it is considered a "Liquidity Raid" or "Stop Hunt."
How to Use This in Your Trading
Do not treat these lines simply as Support and Resistance. In the ICT methodology, old highs and lows are targets, not barriers.
For Reversals: Wait for a "Turtle Soup" or "Judas Swing." This occurs when price aggressively expands into a BSL or SSL level to trigger stops, only to quickly reverse back into the trading range. This indicates that Smart Money has finished their accumulation or distribution.
For Bias: If the higher timeframe trend is Bullish, expect SSL to be raided to fuel the move, while BSL becomes the target (Draw on Liquidity).
By using this indicator, you remove the guesswork of manually marking every swing point, allowing you to focus on price action and the reaction at these critical liquidity pools.

EP CPR Future CPR + 4 MA
1. CPR Trend Direction(Bias):
Bullish: If the current day's price is trading above the TC, it suggests a strong bullish trend where the CPR acts as a support zone.
Bearish: If the current day's price is trading below the BC, it suggests a strong bearish trend where the CPR acts as a resistance zone.
Range-Bound/Consolidation: If the price is trading within the CPR lines, it indicates a lack of clear directional bias and suggests a likely sideways or accumulation phase.
2. Moving average Trend Identification
Uptrend: If the price is above a moving average (and the MA line is sloping up), it confirms a bullish trend.
Downtrend: If the price is below a moving average (and the MA line is sloping down), it confirms a bearish trend.
Crossovers (Trading Signals)
A popular strategy involves using two moving averages—a short-term MA (e.g., 50-period) and a long-term MA (e.g., 200-period).
Golden Cross (Bullish Signal): Occurs when the shorter-term MA crosses above the longer-term MA.
Death Cross (Bearish Signal): Occurs when the shorter-term MA crosses below the longer-term MA.

EMA Trend Pro v1Here is a clear, professional English description you can copy-paste directly (suitable for sharing with friends, investors, brokers, or posting on TradingView):
EMA Trend Pro v5.0 – Strategy Overview
This is a trend-following strategy designed for 15-minute charts on assets like XAUUSD, NASDAQ, BTC, and ETH.
Entry Rules
Buy when the 7, 14, and 21-period EMAs are aligned upward and the 14-period EMA crosses above the 144-period EMA (with ADX > 20 and volume confirmation).
Sell short when the EMAs are aligned downward and the 14-period EMA crosses below the 144-period EMA.
Risk Management
Initial stop-loss is placed at 1.8 × ATR below (long) or above (short) the entry price.
Position size is calculated to risk a fixed percentage of equity per trade.
Profit-Taking & Trade Management
When price reaches 1:1 reward-to-risk, 30% of the position is closed.
At the same moment, the stop-loss for the remaining 70% is moved to the entry price (breakeven).
The remaining position is split:
50% targets 1:2 reward-to-risk
50% targets 1:3 reward-to-risk (allowing big wins during strong trends)
Visualization
Clean colored bars extend to the right showing entry, stop-loss, and three take-profit levels.
Price labels clearly display "Entry", "SL", "TP1 1:1", "TP2 1:2", and "TP3 1:3".
Only the current trade is displayed for a clean chart.
Key Advantages
High win rate due to breakeven protection after 1R
Excellent reward-to-risk ratio that lets winners run
Fully automated, works on any market with clear trends
Professional look, easy to understand and explain
Perfect for swing traders who want consistent profits with limited downside risk.
Feel free to use this description on TradingView, in your trading journal, or when explaining the strategy to others!
If you want a shorter version (e.g., for TradingView description box) or a Chinese version, just let me know — I’ll give it to you right away! 😊

EMA Trend Pro v5.0 5M ONLY — 策略版(1:1出30%+保本)Here is a clear, professional English description you can copy-paste directly (suitable for sharing with friends, investors, brokers, or posting on TradingView):
EMA Trend Pro v5.0 – Strategy Overview
This is a trend-following strategy designed for 15-minute charts on assets like XAUUSD, NASDAQ, BTC, and ETH.
Entry Rules
Buy when the 7, 14, and 21-period EMAs are aligned upward and the 14-period EMA crosses above the 144-period EMA (with ADX > 20 and volume confirmation).
Sell short when the EMAs are aligned downward and the 14-period EMA crosses below the 144-period EMA.
Risk Management
Initial stop-loss is placed at 1.8 × ATR below (long) or above (short) the entry price.
Position size is calculated to risk a fixed percentage of equity per trade.
Profit-Taking & Trade Management
When price reaches 1:1 reward-to-risk, 30% of the position is closed.
At the same moment, the stop-loss for the remaining 70% is moved to the entry price (breakeven).
The remaining position is split:
50% targets 1:2 reward-to-risk
50% targets 1:3 reward-to-risk (allowing big wins during strong trends)
Visualization
Clean colored bars extend to the right showing entry, stop-loss, and three take-profit levels.
Price labels clearly display "Entry", "SL", "TP1 1:1", "TP2 1:2", and "TP3 1:3".
Only the current trade is displayed for a clean chart.
Key Advantages
High win rate due to breakeven protection after 1R
Excellent reward-to-risk ratio that lets winners run
Fully automated, works on any market with clear trends
Professional look, easy to understand and explain
Perfect for swing traders who want consistent profits with limited downside risk.
Feel free to use this description on TradingView, in your trading journal, or when explaining the strategy to others!
If you want a shorter version (e.g., for TradingView description box) or a Chinese version, just let me know — I’ll give it to you right away! 😊

RRE HARSI4951✅ Buy Signal
RSI crosses above 49
Heikin Ashi green (ha_close > ha_open)
✅ Sell Signal
RSI crosses below 51
Heikin Ashi red (ha_close < ha_open)
Everything else in your code remains unchanged.

RSI Driven ATR Trend [NeuraAlgo]
RSI Driven ATR Trend
Dynamic Trend Detection and Strength Analysis
Unlock the market’s hidden rhythm with the RSI Driven ATR Trend , a sophisticated tool designed to measure trend direction and strength using a combination of RSI momentum and ATR-based volatility . This indicator provides real-time insights into bullish and bearish phases, helping traders identify potential turning points and optimize entry and exit decisions.
1.Core In Logic:
Dynamically calculates trend levels based on RSI and ATR interactions.
Highlights trend direction with intuitive color coding: green for bullish, red for bearish.
Displays trend strength as a percentage to quantify momentum intensity.
Automatic visual cues for potential trend reversals with “Turn Up” and “Turn Down” labels.
Advanced smoothing and dynamic gating ensure responsive yet stable trend detection.
Compatible with all timeframes and instruments.
2.Inputs Explained:
Rsi Factor: Adjusts the sensitivity of the RSI in trend calculation. Higher values make the trend detection more responsive to momentum changes.
Multiplier: Multiplies the effect of Rsi Factor to fine-tune trend responsiveness.
Bar Back: Number of bars used for peak and dip calculations, determining how far back the indicator looks for trend changes.
Period: Lookback period used in trend gating and ATR calculations.
Source: Price source for calculations (default is close).
Main Colors: Customize bullish and bearish trend colors.
3.How it Works:
The indicator calculates RSI values and ATR-based dynamic ranges to determine upper and lower trend levels.
Trend direction is determined by price crossing above (bullish) or below (bearish) the dynamic trend line.
Trend strength is expressed as a percentage relative to the trend line, helping you assess momentum intensity.
Visual cues like "Turn Up" and "Turn Down" labels indicate potential trend reversals.
Bars are colored dynamically based on trend direction for quick interpretation.
Ideal for traders seeking a clear, actionable view of market trends without the clutter of multiple indicators. RSI Driven ATR Trend translates complex price behavior into an easy-to-read visual guide, helping you make smarter trading decisions.
Happy Trading!

Delta Zones Smart Money Concept (SMC) UT Trend Reversal Mul.Sig.🚀 What's New in This Version (V5 Update)
This version is a major overhaul focused on improving trade entry timing and risk management through enhanced UT Bot functionality:
Integrated UT Trailing Stop (ATR-based): The primary trend filter and moving stop-loss mechanism is now fully integrated.
Pre-Warning Line: A revolutionary feature that alerts traders when the price penetrates a specific percentage distance (customizable) from the UT Trailing Stop before the main reversal signal fires.
"Ready" Signal: Plots a "Ready" warning label on the chart and triggers an alert condition (UT Ready Long/Short) for pre-emptive trade preparation.
V5 Compatibility: All code has been optimized for Pine Script version 5, utilizing the modern array and type structures for efficient Order Block and Breaker Block detection.
💡 How to Use This Indicator
This indicator works best when confirming signals across different components:
1. Identify the Trend Bias (UT Trailing Stop)
Uptrend: UT Trailing Stop line is Green (Focus only on Buy/Long opportunities).
Downtrend: UT Trailing Stop line is Red (Focus only on Sell/Short opportunities).
2. Prepare for Entry (Warning Line)
Action: When you see the "Ready" label or the price hits the Pre-Warning Line (Dotted Orange Line), this is your alert to prepare for a trend flip, or to tighten the stop on your current trade.
3. Confirm the Entry (Multi-Signals)
Look for a primary entry signal that aligns with the desired trend:
High-Conviction Entry: Wait for the UT Buy/Sell label (confirmed trend flip) AND a Combined Buy/Sell arrow (confirmed by your selected Oscillator settings).
High-Liquidity Entry: Look for a Delta Zone Box forming near an active Order Block or Breaker Block (SMC zones), and then confirm with a UT or Combined Signal.
4. Manage Risk (Trailing Stop)
Always set your initial Stop Loss (SL) either just outside the opposite Order Block or at the UT Trailing Stop level itself.
If the price closes back across the UT Trailing Stop, exit your position immediately, as the trend bias has officially shifted.
Features & Components
1. Delta Zones (Liquidity/Wick Pressure)
Identifies periods of extreme buying or selling pressure based on wick-to-body ratios and standard deviation analysis.
Plots colored pressure boxes (Buy/Sell) to highlight potential exhaustion points or institutional activity.
2. Smart Money Concepts (SMC)
Automatically detects and plots Order Blocks (OBs) and Breaker Blocks (BBs) based on confirmed Market Structure Breaks (MSBs).
Includes Chop Control logic to remove less reliable Breaker Blocks.
3. UT Bot Trailing Stop & Warning Line
UT Trailing Stop (ATR-based): Plots a dynamic trend line (Green/Red) that acts as a moving stop-loss and primary trend filter.
Ready/Warning Signals: Alerts traders (via the "Ready" label and orange lines) when the price enters a "Pre-Reversal Zone" near the Trailing Stop.
4. Multi-Indicator Confirmation (Filters)
Includes customizable signals based on the crossover/crossunder of RSI, CCI, and Stochastic indicators against configurable Overbought/Oversold levels.
Allows selection of combination signals (e.g., RSI & CCI, All Combined, etc.) for high-conviction entries.

Classic Dual Momentum – 12-Month Absolute Momentum - AntonacciThis indicator calculates the 12-month absolute momentum exactly as described in Gary Antonacci’s Dual Momentum framework.
It automatically adjusts the lookback period based on the chart’s timeframe:
Daily chart: 252 bars
Weekly chart: 52 bars
Monthly chart: 12 bars
Other timeframes: Estimated automatically using bar time difference
The script computes the 12-month rate of return and displays it as a color-coded column plot:
Green: Positive 12-month momentum
Red: Negative 12-month momentum
A customizable moving average is included to help visualize longer-term trends in the momentum signal.
How It’s Used (from Dual Momentum theory)
This indicator provides the absolute momentum filter used in classic Dual Momentum strategies:
If the 12-month return of an asset is above the risk-free return → trend is positive
If it is below the risk-free return → trend is negative
This absolute momentum check is a key component of the Global Equities Momentum (GEM) model presented in Gary Antonacci’s book Dual Momentum Investing.
Why This Indicator Exists
It gives traders a clean, accurate way to visualize the 12-month trend strength across any timeframe, without the distortions caused by bar length differences.

Naveen Prabhu with EMA//@version=6
indicator('Naveen Prabhu with EMA', overlay = true, max_labels_count = 500, max_lines_count = 500, max_boxes_count = 500)
a = input(2, title = 'Key Vaule. \'This changes the sensitivity\'')
c = input(5, title = 'ATR Period')
h = input(false, title = 'Signals from Heikin Ashi Candles')
BULLISH_LEG = 1
BEARISH_LEG = 0
BULLISH = +1
BEARISH = -1
GREEN = #089981
RED = #F23645
BLUE = #2157f3
GRAY = #878b94
MONO_BULLISH = #b2b5be
MONO_BEARISH = #5d606b
HISTORICAL = 'Historical'
PRESENT = 'Present'
COLORED = 'Colored'
MONOCHROME = 'Monochrome'
ALL = 'All'
BOS = 'BOS'
CHOCH = 'CHoCH'
TINY = size.tiny
SMALL = size.small
NORMAL = size.normal
ATR = 'Atr'
RANGE = 'Cumulative Mean Range'
CLOSE = 'Close'
HIGHLOW = 'High/Low'
SOLID = '⎯⎯⎯'
DASHED = '----'
DOTTED = '····'
SMART_GROUP = 'Smart Money Concepts'
INTERNAL_GROUP = 'Real Time Internal Structure'
SWING_GROUP = 'Real Time Swing Structure'
BLOCKS_GROUP = 'Order Blocks'
EQUAL_GROUP = 'EQH/EQL'
GAPS_GROUP = 'Fair Value Gaps'
LEVELS_GROUP = 'Highs & Lows MTF'
ZONES_GROUP = 'Premium & Discount Zones'
modeTooltip = 'Allows to display historical Structure or only the recent ones'
styleTooltip = 'Indicator color theme'
showTrendTooltip = 'Display additional candles with a color reflecting the current trend detected by structure'
showInternalsTooltip = 'Display internal market structure'
internalFilterConfluenceTooltip = 'Filter non significant internal structure breakouts'
showStructureTooltip = 'Display swing market Structure'
showSwingsTooltip = 'Display swing point as labels on the chart'
showHighLowSwingsTooltip = 'Highlight most recent strong and weak high/low points on the chart'
showInternalOrderBlocksTooltip = 'Display internal order blocks on the chart\n\nNumber of internal order blocks to display on the chart'
showSwingOrderBlocksTooltip = 'Display swing order blocks on the chart\n\nNumber of internal swing blocks to display on the chart'
orderBlockFilterTooltip = 'Method used to filter out volatile order blocks \n\nIt is recommended to use the cumulative mean range method when a low amount of data is available'
orderBlockMitigationTooltip = 'Select what values to use for order block mitigation'
showEqualHighsLowsTooltip = 'Display equal highs and equal lows on the chart'
equalHighsLowsLengthTooltip = 'Number of bars used to confirm equal highs and equal lows'
equalHighsLowsThresholdTooltip = 'Sensitivity threshold in a range (0, 1) used for the detection of equal highs & lows\n\nLower values will return fewer but more pertinent results'
showFairValueGapsTooltip = 'Display fair values gaps on the chart'
fairValueGapsThresholdTooltip = 'Filter out non significant fair value gaps'
fairValueGapsTimeframeTooltip = 'Fair value gaps timeframe'
fairValueGapsExtendTooltip = 'Determine how many bars to extend the Fair Value Gap boxes on chart'
showPremiumDiscountZonesTooltip = 'Display premium, discount, and equilibrium zones on chart'
modeInput = input.string( HISTORICAL, 'Mode', group = SMART_GROUP, tooltip = modeTooltip, options = )
styleInput = input.string( COLORED, 'Style', group = SMART_GROUP, tooltip = styleTooltip,options = )
showTrendInput = input( false, 'Color Candles', group = SMART_GROUP, tooltip = showTrendTooltip)
showInternalsInput = input( false, 'Show Internal Structure', group = INTERNAL_GROUP, tooltip = showInternalsTooltip)
showInternalBullInput = input.string( ALL, 'Bullish Structure', group = INTERNAL_GROUP, inline = 'ibull', options = )
internalBullColorInput = input( GREEN, '', group = INTERNAL_GROUP, inline = 'ibull')
showInternalBearInput = input.string( ALL, 'Bearish Structure' , group = INTERNAL_GROUP, inline = 'ibear', options = )
internalBearColorInput = input( RED, '', group = INTERNAL_GROUP, inline = 'ibear')
internalFilterConfluenceInput = input( false, 'Confluence Filter', group = INTERNAL_GROUP, tooltip = internalFilterConfluenceTooltip)
internalStructureSize = input.string( TINY, 'Internal Label Size', group = INTERNAL_GROUP, options = )
showStructureInput = input( false, 'Show Swing Structure', group = SWING_GROUP, tooltip = showStructureTooltip)
showSwingBullInput = input.string( ALL, 'Bullish Structure', group = SWING_GROUP, inline = 'bull', options = )
swingBullColorInput = input( GREEN, '', group = SWING_GROUP, inline = 'bull')
showSwingBearInput = input.string( ALL, 'Bearish Structure', group = SWING_GROUP, inline = 'bear', options = )
swingBearColorInput = input( RED, '', group = SWING_GROUP, inline = 'bear')
swingStructureSize = input.string( SMALL, 'Swing Label Size', group = SWING_GROUP, options = )
showSwingsInput = input( false, 'Show Swings Points', group = SWING_GROUP, tooltip = showSwingsTooltip,inline = 'swings')
swingsLengthInput = input.int( 50, '', group = SWING_GROUP, minval = 10, inline = 'swings')
showHighLowSwingsInput = input( false, 'Show Strong/Weak High/Low',group = SWING_GROUP, tooltip = showHighLowSwingsTooltip)
showInternalOrderBlocksInput = input( true, 'Internal Order Blocks' , group = BLOCKS_GROUP, tooltip = showInternalOrderBlocksTooltip, inline = 'iob')
internalOrderBlocksSizeInput = input.int( 5, '', group = BLOCKS_GROUP, minval = 1, maxval = 20, inline = 'iob')
showSwingOrderBlocksInput = input( true, 'Swing Order Blocks', group = BLOCKS_GROUP, tooltip = showSwingOrderBlocksTooltip, inline = 'ob')
swingOrderBlocksSizeInput = input.int( 5, '', group = BLOCKS_GROUP, minval = 1, maxval = 20, inline = 'ob')
orderBlockFilterInput = input.string( 'Atr', 'Order Block Filter', group = BLOCKS_GROUP, tooltip = orderBlockFilterTooltip, options = )
orderBlockMitigationInput = input.string( HIGHLOW, 'Order Block Mitigation', group = BLOCKS_GROUP, tooltip = orderBlockMitigationTooltip, options = )
internalBullishOrderBlockColor = input.color(color.new(GREEN, 80), 'Internal Bullish OB', group = BLOCKS_GROUP)
internalBearishOrderBlockColor = input.color(color.new(#f77c80, 80), 'Internal Bearish OB', group = BLOCKS_GROUP)
swingBullishOrderBlockColor = input.color(color.new(GREEN, 80), 'Bullish OB', group = BLOCKS_GROUP)
swingBearishOrderBlockColor = input.color(color.new(#b22833, 80), 'Bearish OB', group = BLOCKS_GROUP)
showEqualHighsLowsInput = input( false, 'Equal High/Low', group = EQUAL_GROUP, tooltip = showEqualHighsLowsTooltip)
equalHighsLowsLengthInput = input.int( 3, 'Bars Confirmation', group = EQUAL_GROUP, tooltip = equalHighsLowsLengthTooltip, minval = 1)
equalHighsLowsThresholdInput = input.float( 0.1, 'Threshold', group = EQUAL_GROUP, tooltip = equalHighsLowsThresholdTooltip, minval = 0, maxval = 0.5, step = 0.1)
equalHighsLowsSizeInput = input.string( TINY, 'Label Size', group = EQUAL_GROUP, options = )
showFairValueGapsInput = input( false, 'Fair Value Gaps', group = GAPS_GROUP, tooltip = showFairValueGapsTooltip)
fairValueGapsThresholdInput = input( true, 'Auto Threshold', group = GAPS_GROUP, tooltip = fairValueGapsThresholdTooltip)
fairValueGapsTimeframeInput = input.timeframe('', 'Timeframe', group = GAPS_GROUP, tooltip = fairValueGapsTimeframeTooltip)
fairValueGapsBullColorInput = input.color(color.new(#00ff68, 70), 'Bullish FVG' , group = GAPS_GROUP)
fairValueGapsBearColorInput = input.color(color.new(#ff0008, 70), 'Bearish FVG' , group = GAPS_GROUP)
fairValueGapsExtendInput = input.int( 1, 'Extend FVG', group = GAPS_GROUP, tooltip = fairValueGapsExtendTooltip, minval = 0)
showDailyLevelsInput = input( false, 'Daily', group = LEVELS_GROUP, inline = 'daily')
dailyLevelsStyleInput = input.string( SOLID, '', group = LEVELS_GROUP, inline = 'daily', options = )
dailyLevelsColorInput = input( BLUE, '', group = LEVELS_GROUP, inline = 'daily')
showWeeklyLevelsInput = input( false, 'Weekly', group = LEVELS_GROUP, inline = 'weekly')
weeklyLevelsStyleInput = input.string( SOLID, '', group = LEVELS_GROUP, inline = 'weekly', options = )
weeklyLevelsColorInput = input( BLUE, '', group = LEVELS_GROUP, inline = 'weekly')
showMonthlyLevelsInput = input( false, 'Monthly', group = LEVELS_GROUP, inline = 'monthly')
monthlyLevelsStyleInput = input.string( SOLID, '', group = LEVELS_GROUP, inline = 'monthly', options = )
monthlyLevelsColorInput = input( BLUE, '', group = LEVELS_GROUP, inline = 'monthly')
showPremiumDiscountZonesInput = input( false, 'Premium/Discount Zones', group = ZONES_GROUP , tooltip = showPremiumDiscountZonesTooltip)
premiumZoneColorInput = input.color( RED, 'Premium Zone', group = ZONES_GROUP)
equilibriumZoneColorInput = input.color( GRAY, 'Equilibrium Zone', group = ZONES_GROUP)
discountZoneColorInput = input.color( GREEN, 'Discount Zone', group = ZONES_GROUP)
type alerts
bool internalBullishBOS = false
bool internalBearishBOS = false
bool internalBullishCHoCH = false
bool internalBearishCHoCH = false
bool swingBullishBOS = false
bool swingBearishBOS = false
bool swingBullishCHoCH = false
bool swingBearishCHoCH = false
bool internalBullishOrderBlock = false
bool internalBearishOrderBlock = false
bool swingBullishOrderBlock = false
bool swingBearishOrderBlock = false
bool equalHighs = false
bool equalLows = false
bool bullishFairValueGap = false
bool bearishFairValueGap = false
type trailingExtremes
float top
float bottom
int barTime
int barIndex
int lastTopTime
int lastBottomTime
type fairValueGap
float top
float bottom
int bias
box topBox
box bottomBox
type trend
int bias
type equalDisplay
line l_ine = na
label l_abel = na
type pivot
float currentLevel
float lastLevel
bool crossed
int barTime = time
int barIndex = bar_index
type orderBlock
float barHigh
float barLow
int barTime
int bias
// @variable current swing pivot high
var pivot swingHigh = pivot.new(na,na,false)
// @variable current swing pivot low
var pivot swingLow = pivot.new(na,na,false)
// @variable current internal pivot high
var pivot internalHigh = pivot.new(na,na,false)
// @variable current internal pivot low
var pivot internalLow = pivot.new(na,na,false)
// @variable current equal high pivot
var pivot equalHigh = pivot.new(na,na,false)
// @variable current equal low pivot
var pivot equalLow = pivot.new(na,na,false)
// @variable swing trend bias
var trend swingTrend = trend.new(0)
// @variable internal trend bias
var trend internalTrend = trend.new(0)
// @variable equal high display
var equalDisplay equalHighDisplay = equalDisplay.new()
// @variable equal low display
var equalDisplay equalLowDisplay = equalDisplay.new()
// @variable storage for fairValueGap UDTs
var array fairValueGaps = array.new()
// @variable storage for parsed highs
var array parsedHighs = array.new()
// @variable storage for parsed lows
var array parsedLows = array.new()
// @variable storage for raw highs
var array highs = array.new()
// @variable storage for raw lows
var array lows = array.new()
// @variable storage for bar time values
var array times = array.new()
// @variable last trailing swing high and low
var trailingExtremes trailing = trailingExtremes.new()
// @variable storage for orderBlock UDTs (swing order blocks)
var array swingOrderBlocks = array.new()
// @variable storage for orderBlock UDTs (internal order blocks)
var array internalOrderBlocks = array.new()
// @variable storage for swing order blocks boxes
var array swingOrderBlocksBoxes = array.new()
// @variable storage for internal order blocks boxes
var array internalOrderBlocksBoxes = array.new()
// @variable color for swing bullish structures
var swingBullishColor = styleInput == MONOCHROME ? MONO_BULLISH : swingBullColorInput
// @variable color for swing bearish structures
var swingBearishColor = styleInput == MONOCHROME ? MONO_BEARISH : swingBearColorInput
// @variable color for bullish fair value gaps
var fairValueGapBullishColor = styleInput == MONOCHROME ? color.new(MONO_BULLISH,70) : fairValueGapsBullColorInput
// @variable color for bearish fair value gaps
var fairValueGapBearishColor = styleInput == MONOCHROME ? color.new(MONO_BEARISH,70) : fairValueGapsBearColorInput
// @variable color for premium zone
var premiumZoneColor = styleInput == MONOCHROME ? MONO_BEARISH : premiumZoneColorInput
// @variable color for discount zone
var discountZoneColor = styleInput == MONOCHROME ? MONO_BULLISH : discountZoneColorInput
// @variable bar index on current script iteration
varip int currentBarIndex = bar_index
// @variable bar index on last script iteration
varip int lastBarIndex = bar_index
// @variable alerts in current bar
alerts currentAlerts = alerts.new()
// @variable time at start of chart
var initialTime = time
// we create the needed boxes for displaying order blocks at the first execution
if barstate.isfirst
if showSwingOrderBlocksInput
for index = 1 to swingOrderBlocksSizeInput
swingOrderBlocksBoxes.push(box.new(na,na,na,na,xloc = xloc.bar_time,extend = extend.right))
if showInternalOrderBlocksInput
for index = 1 to internalOrderBlocksSizeInput
internalOrderBlocksBoxes.push(box.new(na,na,na,na,xloc = xloc.bar_time,extend = extend.right))
// @variable source to use in bearish order blocks mitigation
bearishOrderBlockMitigationSource = orderBlockMitigationInput == CLOSE ? close : high
// @variable source to use in bullish order blocks mitigation
bullishOrderBlockMitigationSource = orderBlockMitigationInput == CLOSE ? close : low
// @variable default volatility measure
atrMeasure = ta.atr(200)
// @variable parsed volatility measure by user settings
volatilityMeasure = orderBlockFilterInput == ATR ? atrMeasure : ta.cum(ta.tr)/bar_index
// @variable true if current bar is a high volatility bar
highVolatilityBar = (high - low) >= (2 * volatilityMeasure)
// @variable parsed high
parsedHigh = highVolatilityBar ? low : high
// @variable parsed low
parsedLow = highVolatilityBar ? high : low
// we store current values into the arrays at each bar
parsedHighs.push(parsedHigh)
parsedLows.push(parsedLow)
highs.push(high)
lows.push(low)
times.push(time)
leg(int size) =>
var leg = 0
newLegHigh = high > ta.highest( size)
newLegLow = low < ta.lowest( size)
if newLegHigh
leg := BEARISH_LEG
else if newLegLow
leg := BULLISH_LEG
leg
startOfNewLeg(int leg) => ta.change(leg) != 0
startOfBearishLeg(int leg) => ta.change(leg) == -1
startOfBullishLeg(int leg) => ta.change(leg) == +1
drawLabel(int labelTime, float labelPrice, string tag, color labelColor, string labelStyle) =>
var label l_abel = na
if modeInput == PRESENT
l_abel.delete()
l_abel := label.new(chart.point.new(labelTime,na,labelPrice),tag,xloc.bar_time,color=color(na),textcolor=labelColor,style = labelStyle,size = size.small)
drawEqualHighLow(pivot p_ivot, float level, int size, bool equalHigh) =>
equalDisplay e_qualDisplay = equalHigh ? equalHighDisplay : equalLowDisplay
string tag = 'EQL'
color equalColor = swingBullishColor
string labelStyle = label.style_label_up
if equalHigh
tag := 'EQH'
equalColor := swingBearishColor
labelStyle := label.style_label_down
if modeInput == PRESENT
line.delete( e_qualDisplay.l_ine)
label.delete( e_qualDisplay.l_abel)
e_qualDisplay.l_ine := line.new(chart.point.new(p_ivot.barTime,na,p_ivot.currentLevel), chart.point.new(time ,na,level), xloc = xloc.bar_time, color = equalColor, style = line.style_dotted)
labelPosition = math.round(0.5*(p_ivot.barIndex + bar_index - size))
e_qualDisplay.l_abel := label.new(chart.point.new(na,labelPosition,level), tag, xloc.bar_index, color = color(na), textcolor = equalColor, style = labelStyle, size = equalHighsLowsSizeInput)
getCurrentStructure(int size,bool equalHighLow = false, bool internal = false) =>
currentLeg = leg(size)
newPivot = startOfNewLeg(currentLeg)
pivotLow = startOfBullishLeg(currentLeg)
pivotHigh = startOfBearishLeg(currentLeg)
if newPivot
if pivotLow
pivot p_ivot = equalHighLow ? equalLow : internal ? internalLow : swingLow
if equalHighLow and math.abs(p_ivot.currentLevel - low ) < equalHighsLowsThresholdInput * atrMeasure
drawEqualHighLow(p_ivot, low , size, false)
p_ivot.lastLevel := p_ivot.currentLevel
p_ivot.currentLevel := low
p_ivot.crossed := false
p_ivot.barTime := time
p_ivot.barIndex := bar_index
if not equalHighLow and not internal
trailing.bottom := p_ivot.currentLevel
trailing.barTime := p_ivot.barTime
trailing.barIndex := p_ivot.barIndex
trailing.lastBottomTime := p_ivot.barTime
if showSwingsInput and not internal and not equalHighLow
drawLabel(time , p_ivot.currentLevel, p_ivot.currentLevel < p_ivot.lastLevel ? 'LL' : 'HL', swingBullishColor, label.style_label_up)
else
pivot p_ivot = equalHighLow ? equalHigh : internal ? internalHigh : swingHigh
if equalHighLow and math.abs(p_ivot.currentLevel - high ) < equalHighsLowsThresholdInput * atrMeasure
drawEqualHighLow(p_ivot,high ,size,true)
p_ivot.lastLevel := p_ivot.currentLevel
p_ivot.currentLevel := high
p_ivot.crossed := false
p_ivot.barTime := time
p_ivot.barIndex := bar_index
if not equalHighLow and not internal
trailing.top := p_ivot.currentLevel
trailing.barTime := p_ivot.barTime
trailing.barIndex := p_ivot.barIndex
trailing.lastTopTime := p_ivot.barTime
if showSwingsInput and not internal and not equalHighLow
drawLabel(time , p_ivot.currentLevel, p_ivot.currentLevel > p_ivot.lastLevel ? 'HH' : 'LH', swingBearishColor, label.style_label_down)
drawStructure(pivot p_ivot, string tag, color structureColor, string lineStyle, string labelStyle, string labelSize) =>
var line l_ine = line.new(na,na,na,na,xloc = xloc.bar_time)
var label l_abel = label.new(na,na)
if modeInput == PRESENT
l_ine.delete()
l_abel.delete()
l_ine := line.new(chart.point.new(p_ivot.barTime,na,p_ivot.currentLevel), chart.point.new(time,na,p_ivot.currentLevel), xloc.bar_time, color=structureColor, style=lineStyle)
l_abel := label.new(chart.point.new(na,math.round(0.5*(p_ivot.barIndex+bar_index)),p_ivot.currentLevel), tag, xloc.bar_index, color=color(na), textcolor=structureColor, style=labelStyle, size = labelSize)
deleteOrderBlocks(bool internal = false) =>
array orderBlocks = internal ? internalOrderBlocks : swingOrderBlocks
for in orderBlocks
bool crossedOderBlock = false
if bearishOrderBlockMitigationSource > eachOrderBlock.barHigh and eachOrderBlock.bias == BEARISH
crossedOderBlock := true
if internal
currentAlerts.internalBearishOrderBlock := true
else
currentAlerts.swingBearishOrderBlock := true
else if bullishOrderBlockMitigationSource < eachOrderBlock.barLow and eachOrderBlock.bias == BULLISH
crossedOderBlock := true
if internal
currentAlerts.internalBullishOrderBlock := true
else
currentAlerts.swingBullishOrderBlock := true
if crossedOderBlock
orderBlocks.remove(index)
storeOrdeBlock(pivot p_ivot,bool internal = false,int bias) =>
if (not internal and showSwingOrderBlocksInput) or (internal and showInternalOrderBlocksInput)
array a_rray = na
int parsedIndex = na
if bias == BEARISH
a_rray := parsedHighs.slice(p_ivot.barIndex,bar_index)
parsedIndex := p_ivot.barIndex + a_rray.indexof(a_rray.max())
else
a_rray := parsedLows.slice(p_ivot.barIndex,bar_index)
parsedIndex := p_ivot.barIndex + a_rray.indexof(a_rray.min())
orderBlock o_rderBlock = orderBlock.new(parsedHighs.get(parsedIndex), parsedLows.get(parsedIndex), times.get(parsedIndex),bias)
array orderBlocks = internal ? internalOrderBlocks : swingOrderBlocks
if orderBlocks.size() >= 100
orderBlocks.pop()
orderBlocks.unshift(o_rderBlock)
drawOrderBlocks(bool internal = false) =>
array orderBlocks = internal ? internalOrderBlocks : swingOrderBlocks
orderBlocksSize = orderBlocks.size()
if orderBlocksSize > 0
maxOrderBlocks = internal ? internalOrderBlocksSizeInput : swingOrderBlocksSizeInput
array parsedOrdeBlocks = orderBlocks.slice(0, math.min(maxOrderBlocks,orderBlocksSize))
array b_oxes = internal ? internalOrderBlocksBoxes : swingOrderBlocksBoxes
for in parsedOrdeBlocks
orderBlockColor = styleInput == MONOCHROME ? (eachOrderBlock.bias == BEARISH ? color.new(MONO_BEARISH,80) : color.new(MONO_BULLISH,80)) : internal ? (eachOrderBlock.bias == BEARISH ? internalBearishOrderBlockColor : internalBullishOrderBlockColor) : (eachOrderBlock.bias == BEARISH ? swingBearishOrderBlockColor : swingBullishOrderBlockColor)
box b_ox = b_oxes.get(index)
b_ox.set_top_left_point( chart.point.new(eachOrderBlock.barTime,na,eachOrderBlock.barHigh))
b_ox.set_bottom_right_point(chart.point.new(last_bar_time,na,eachOrderBlock.barLow))
b_ox.set_border_color( internal ? na : orderBlockColor)
b_ox.set_bgcolor( orderBlockColor)
displayStructure(bool internal = false) =>
var bullishBar = true
var bearishBar = true
if internalFilterConfluenceInput
bullishBar := high - math.max(close, open) > math.min(close, open - low)
bearishBar := high - math.max(close, open) < math.min(close, open - low)
pivot p_ivot = internal ? internalHigh : swingHigh
trend t_rend = internal ? internalTrend : swingTrend
lineStyle = internal ? line.style_dashed : line.style_solid
labelSize = internal ? internalStructureSize : swingStructureSize
extraCondition = internal ? internalHigh.currentLevel != swingHigh.currentLevel and bullishBar : true
bullishColor = styleInput == MONOCHROME ? MONO_BULLISH : internal ? internalBullColorInput : swingBullColorInput
if ta.crossover(close,p_ivot.currentLevel) and not p_ivot.crossed and extraCondition
string tag = t_rend.bias == BEARISH ? CHOCH : BOS
if internal
currentAlerts.internalBullishCHoCH := tag == CHOCH
currentAlerts.internalBullishBOS := tag == BOS
else
currentAlerts.swingBullishCHoCH := tag == CHOCH
currentAlerts.swingBullishBOS := tag == BOS
p_ivot.crossed := true
t_rend.bias := BULLISH
displayCondition = internal ? showInternalsInput and (showInternalBullInput == ALL or (showInternalBullInput == BOS and tag != CHOCH) or (showInternalBullInput == CHOCH and tag == CHOCH)) : showStructureInput and (showSwingBullInput == ALL or (showSwingBullInput == BOS and tag != CHOCH) or (showSwingBullInput == CHOCH and tag == CHOCH))
if displayCondition
drawStructure(p_ivot,tag,bullishColor,lineStyle,label.style_label_down,labelSize)
if (internal and showInternalOrderBlocksInput) or (not internal and showSwingOrderBlocksInput)
storeOrdeBlock(p_ivot,internal,BULLISH)
p_ivot := internal ? internalLow : swingLow
extraCondition := internal ? internalLow.currentLevel != swingLow.currentLevel and bearishBar : true
bearishColor = styleInput == MONOCHROME ? MONO_BEARISH : internal ? internalBearColorInput : swingBearColorInput
if ta.crossunder(close,p_ivot.currentLevel) and not p_ivot.crossed and extraCondition
string tag = t_rend.bias == BULLISH ? CHOCH : BOS
if internal
currentAlerts.internalBearishCHoCH := tag == CHOCH
currentAlerts.internalBearishBOS := tag == BOS
else
currentAlerts.swingBearishCHoCH := tag == CHOCH
currentAlerts.swingBearishBOS := tag == BOS
p_ivot.crossed := true
t_rend.bias := BEARISH
displayCondition = internal ? showInternalsInput and (showInternalBearInput == ALL or (showInternalBearInput == BOS and tag != CHOCH) or (showInternalBearInput == CHOCH and tag == CHOCH)) : showStructureInput and (showSwingBearInput == ALL or (showSwingBearInput == BOS and tag != CHOCH) or (showSwingBearInput == CHOCH and tag == CHOCH))
if displayCondition
drawStructure(p_ivot,tag,bearishColor,lineStyle,label.style_label_up,labelSize)
if (internal and showInternalOrderBlocksInput) or (not internal and showSwingOrderBlocksInput)
storeOrdeBlock(p_ivot,internal,BEARISH)
fairValueGapBox(leftTime,rightTime,topPrice,bottomPrice,boxColor) => box.new(chart.point.new(leftTime,na,topPrice),chart.point.new(rightTime + fairValueGapsExtendInput * (time-time ),na,bottomPrice), xloc=xloc.bar_time, border_color = boxColor, bgcolor = boxColor)
deleteFairValueGaps() =>
for in fairValueGaps
if (low < eachFairValueGap.bottom and eachFairValueGap.bias == BULLISH) or (high > eachFairValueGap.top and eachFairValueGap.bias == BEARISH)
eachFairValueGap.topBox.delete()
eachFairValueGap.bottomBox.delete()
fairValueGaps.remove(index)
// @function draw fair value gaps
// @returns fairValueGap ID
drawFairValueGaps() =>
= request.security(syminfo.tickerid, fairValueGapsTimeframeInput, [close , open , time , high , low , time , high , low ],lookahead = barmerge.lookahead_on)
barDeltaPercent = (lastClose - lastOpen) / (lastOpen * 100)
newTimeframe = timeframe.change(fairValueGapsTimeframeInput)
threshold = fairValueGapsThresholdInput ? ta.cum(math.abs(newTimeframe ? barDeltaPercent : 0)) / bar_index * 2 : 0
bullishFairValueGap = currentLow > last2High and lastClose > last2High and barDeltaPercent > threshold and newTimeframe
bearishFairValueGap = currentHigh < last2Low and lastClose < last2Low and -barDeltaPercent > threshold and newTimeframe
if bullishFairValueGap
currentAlerts.bullishFairValueGap := true
fairValueGaps.unshift(fairValueGap.new(currentLow,last2High,BULLISH,fairValueGapBox(lastTime,currentTime,currentLow,math.avg(currentLow,last2High),fairValueGapBullishColor),fairValueGapBox(lastTime,currentTime,math.avg(currentLow,last2High),last2High,fairValueGapBullishColor)))
if bearishFairValueGap
currentAlerts.bearishFairValueGap := true
fairValueGaps.unshift(fairValueGap.new(currentHigh,last2Low,BEARISH,fairValueGapBox(lastTime,currentTime,currentHigh,math.avg(currentHigh,last2Low),fairValueGapBearishColor),fairValueGapBox(lastTime,currentTime,math.avg(currentHigh,last2Low),last2Low,fairValueGapBearishColor)))
getStyle(string style) =>
switch style
SOLID => line.style_solid
DASHED => line.style_dashed
DOTTED => line.style_dotted
drawLevels(string timeframe, bool sameTimeframe, string style, color levelColor) =>
= request.security(syminfo.tickerid, timeframe, [high , low , time , time],lookahead = barmerge.lookahead_on)
float parsedTop = sameTimeframe ? high : topLevel
float parsedBottom = sameTimeframe ? low : bottomLevel
int parsedLeftTime = sameTimeframe ? time : leftTime
int parsedRightTime = sameTimeframe ? time : rightTime
int parsedTopTime = time
int parsedBottomTime = time
if not sameTimeframe
int leftIndex = times.binary_search_rightmost(parsedLeftTime)
int rightIndex = times.binary_search_rightmost(parsedRightTime)
array timeArray = times.slice(leftIndex,rightIndex)
array topArray = highs.slice(leftIndex,rightIndex)
array bottomArray = lows.slice(leftIndex,rightIndex)
parsedTopTime := timeArray.size() > 0 ? timeArray.get(topArray.indexof(topArray.max())) : initialTime
parsedBottomTime := timeArray.size() > 0 ? timeArray.get(bottomArray.indexof(bottomArray.min())) : initialTime
var line topLine = line.new(na, na, na, na, xloc = xloc.bar_time, color = levelColor, style = getStyle(style))
var line bottomLine = line.new(na, na, na, na, xloc = xloc.bar_time, color = levelColor, style = getStyle(style))
var label topLabel = label.new(na, na, xloc = xloc.bar_time, text = str.format('P{0}H',timeframe), color=color(na), textcolor = levelColor, size = size.small, style = label.style_label_left)
var label bottomLabel = label.new(na, na, xloc = xloc.bar_time, text = str.format('P{0}L',timeframe), color=color(na), textcolor = levelColor, size = size.small, style = label.style_label_left)
topLine.set_first_point( chart.point.new(parsedTopTime,na,parsedTop))
topLine.set_second_point( chart.point.new(last_bar_time + 20 * (time-time ),na,parsedTop))
topLabel.set_point( chart.point.new(last_bar_time + 20 * (time-time ),na,parsedTop))
bottomLine.set_first_point( chart.point.new(parsedBottomTime,na,parsedBottom))
bottomLine.set_second_point(chart.point.new(last_bar_time + 20 * (time-time ),na,parsedBottom))
bottomLabel.set_point( chart.point.new(last_bar_time + 20 * (time-time ),na,parsedBottom))
higherTimeframe(string timeframe) => timeframe.in_seconds() > timeframe.in_seconds(timeframe)
updateTrailingExtremes() =>
trailing.top := math.max(high,trailing.top)
trailing.lastTopTime := trailing.top == high ? time : trailing.lastTopTime
trailing.bottom := math.min(low,trailing.bottom)
trailing.lastBottomTime := trailing.bottom == low ? time : trailing.lastBottomTime
drawHighLowSwings() =>
var line topLine = line.new(na, na, na, na, color = swingBearishColor, xloc = xloc.bar_time)
var line bottomLine = line.new(na, na, na, na, color = swingBullishColor, xloc = xloc.bar_time)
var label topLabel = label.new(na, na, color=color(na), textcolor = swingBearishColor, xloc = xloc.bar_time, style = label.style_label_down, size = size.tiny)
var label bottomLabel = label.new(na, na, color=color(na), textcolor = swingBullishColor, xloc = xloc.bar_time, style = label.style_label_up, size = size.tiny)
rightTimeBar = last_bar_time + 20 * (time - time )
topLine.set_first_point( chart.point.new(trailing.lastTopTime, na, trailing.top))
topLine.set_second_point( chart.point.new(rightTimeBar, na, trailing.top))
topLabel.set_point( chart.point.new(rightTimeBar, na, trailing.top))
topLabel.set_text( swingTrend.bias == BEARISH ? 'Strong High' : 'Weak High')
bottomLine.set_first_point( chart.point.new(trailing.lastBottomTime, na, trailing.bottom))
bottomLine.set_second_point(chart.point.new(rightTimeBar, na, trailing.bottom))
bottomLabel.set_point( chart.point.new(rightTimeBar, na, trailing.bottom))
bottomLabel.set_text( swingTrend.bias == BULLISH ? 'Strong Low' : 'Weak Low')
drawZone(float labelLevel, int labelIndex, float top, float bottom, string tag, color zoneColor, string style) =>
var label l_abel = label.new(na,na,text = tag, color=color(na),textcolor = zoneColor, style = style, size = size.small)
var box b_ox = box.new(na,na,na,na,bgcolor = color.new(zoneColor,80),border_color = color(na), xloc = xloc.bar_time)
b_ox.set_top_left_point( chart.point.new(trailing.barTime,na,top))
b_ox.set_bottom_right_point(chart.point.new(last_bar_time,na,bottom))
l_abel.set_point( chart.point.new(na,labelIndex,labelLevel))
// @function draw premium/discount zones
// @returns void
drawPremiumDiscountZones() =>
drawZone(trailing.top, math.round(0.5*(trailing.barIndex + last_bar_index)), trailing.top, 0.95*trailing.top + 0.05*trailing.bottom, 'Premium', premiumZoneColor, label.style_label_down)
equilibriumLevel = math.avg(trailing.top, trailing.bottom)
drawZone(equilibriumLevel, last_bar_index, 0.525*trailing.top + 0.475*trailing.bottom, 0.525*trailing.bottom + 0.475*trailing.top, 'Equilibrium', equilibriumZoneColorInput, label.style_label_left)
drawZone(trailing.bottom, math.round(0.5*(trailing.barIndex + last_bar_index)), 0.95*trailing.bottom + 0.05*trailing.top, trailing.bottom, 'Discount', discountZoneColor, label.style_label_up)
parsedOpen = showTrendInput ? open : na
candleColor = internalTrend.bias == BULLISH ? swingBullishColor : swingBearishColor
plotcandle(parsedOpen,high,low,close,color = candleColor, wickcolor = candleColor, bordercolor = candleColor)
if showHighLowSwingsInput or showPremiumDiscountZonesInput
updateTrailingExtremes()
if showHighLowSwingsInput
drawHighLowSwings()
if showPremiumDiscountZonesInput
drawPremiumDiscountZones()
if showFairValueGapsInput
deleteFairValueGaps()
getCurrentStructure(swingsLengthInput,false)
getCurrentStructure(5,false,true)
if showEqualHighsLowsInput
getCurrentStructure(equalHighsLowsLengthInput,true)
if showInternalsInput or showInternalOrderBlocksInput or showTrendInput
displayStructure(true)
if showStructureInput or showSwingOrderBlocksInput or showHighLowSwingsInput
displayStructure()
if showInternalOrderBlocksInput
deleteOrderBlocks(true)
if showSwingOrderBlocksInput
deleteOrderBlocks()
if showFairValueGapsInput
drawFairValueGaps()
if barstate.islastconfirmedhistory or barstate.islast
if showInternalOrderBlocksInput
drawOrderBlocks(true)
if showSwingOrderBlocksInput
drawOrderBlocks()
lastBarIndex := currentBarIndex
currentBarIndex := bar_index
newBar = currentBarIndex != lastBarIndex
if barstate.islastconfirmedhistory or (barstate.isrealtime and newBar)
if showDailyLevelsInput and not higherTimeframe('D')
drawLevels('D',timeframe.isdaily,dailyLevelsStyleInput,dailyLevelsColorInput)
if showWeeklyLevelsInput and not higherTimeframe('W')
drawLevels('W',timeframe.isweekly,weeklyLevelsStyleInput,weeklyLevelsColorInput)
if showMonthlyLevelsInput and not higherTimeframe('M')
drawLevels('M',timeframe.ismonthly,monthlyLevelsStyleInput,monthlyLevelsColorInput)
xATR = ta.atr(c)
nLoss = a * xATR
src = h ? request.security(ticker.heikinashi(syminfo.tickerid), timeframe.period, close, lookahead = barmerge.lookahead_off) : close
xATRTrailingStop = 0.0
iff_1 = src > nz(xATRTrailingStop , 0) ? src - nLoss : src + nLoss
iff_2 = src < nz(xATRTrailingStop , 0) and src < nz(xATRTrailingStop , 0) ? math.min(nz(xATRTrailingStop ), src + nLoss) : iff_1
xATRTrailingStop := src > nz(xATRTrailingStop , 0) and src > nz(xATRTrailingStop , 0) ? math.max(nz(xATRTrailingStop ), src - nLoss) : iff_2
pos = 0
iff_3 = src > nz(xATRTrailingStop , 0) and src < nz(xATRTrailingStop , 0) ? -1 : nz(pos , 0)
pos := src < nz(xATRTrailingStop , 0) and src > nz(xATRTrailingStop , 0) ? 1 : iff_3
xcolor = pos == -1 ? color.red : pos == 1 ? color.green : color.blue
ema = ta.ema(src, 1)
above = ta.crossover(ema, xATRTrailingStop)
below = ta.crossover(xATRTrailingStop, ema)
buy = src > xATRTrailingStop and above
sell = src < xATRTrailingStop and below
barbuy = src > xATRTrailingStop
barsell = src < xATRTrailingStop
//---------------------------------------------------------------------------------------------------------------------}
//ALERTS
//---------------------------------------------------------------------------------------------------------------------{
alertcondition(currentAlerts.internalBullishBOS, 'Internal Bullish BOS', 'Internal Bullish BOS formed')
alertcondition(currentAlerts.internalBullishCHoCH, 'Internal Bullish CHoCH', 'Internal Bullish CHoCH formed')
alertcondition(currentAlerts.internalBearishBOS, 'Internal Bearish BOS', 'Internal Bearish BOS formed')
alertcondition(currentAlerts.internalBearishCHoCH, 'Internal Bearish CHoCH', 'Internal Bearish CHoCH formed')
alertcondition(currentAlerts.swingBullishBOS, 'Bullish BOS', 'Internal Bullish BOS formed')
alertcondition(currentAlerts.swingBullishCHoCH, 'Bullish CHoCH', 'Internal Bullish CHoCH formed')
alertcondition(currentAlerts.swingBearishBOS, 'Bearish BOS', 'Bearish BOS formed')
alertcondition(currentAlerts.swingBearishCHoCH, 'Bearish CHoCH', 'Bearish CHoCH formed')
alertcondition(currentAlerts.internalBullishOrderBlock, 'Bullish Internal OB Breakout', 'Price broke bullish internal OB')
alertcondition(currentAlerts.internalBearishOrderBlock, 'Bearish Internal OB Breakout', 'Price broke bearish internal OB')
alertcondition(currentAlerts.swingBullishOrderBlock, 'Bullish Swing OB Breakout', 'Price broke bullish swing OB')
alertcondition(currentAlerts.swingBearishOrderBlock, 'Bearish Swing OB Breakout', 'Price broke bearish swing OB')
alertcondition(currentAlerts.equalHighs, 'Equal Highs', 'Equal highs detected')
alertcondition(currentAlerts.equalLows, 'Equal Lows', 'Equal lows detected')
alertcondition(currentAlerts.bullishFairValueGap, 'Bullish FVG', 'Bullish FVG formed')
alertcondition(currentAlerts.bearishFairValueGap, 'Bearish FVG', 'Bearish FVG formed')
alertcondition(buy, 'UT Long', 'UT Long')
alertcondition(sell, 'UT Short', 'UT Short')
plotshape(buy, title = 'Buy', text = 'Buy', style = shape.labelup, location = location.belowbar, color = color.new(color.green, 0), textcolor = color.new(color.white, 0), size = size.tiny)
plotshape(sell, title = 'Sell', text = 'Sell', style = shape.labeldown, location = location.abovebar, color = color.new(color.red, 0), textcolor = color.new(color.white, 0), size = size.tiny)
//--------------------------------------------------------------------------------------
// EMA ADDITIONS (Editable)
//--------------------------------------------------------------------------------------
ema5Len = input.int(5, "5 EMA Length", minval = 1)
ema9Len = input.int(9, "9 EMA Length", minval = 1)
ema5 = ta.ema(src, ema5Len)
ema9 = ta.ema(src, ema9Len)
plot(ema5, "EMA 5", color = color.red, linewidth = 2)
plot(ema9, "EMA 9", color = color.blue, linewidth = 2)
barcolor(barbuy ? color.green : na)
barcolor(barsell ? color.red : na)

STARKPROFITS SCALPER 2.0señales compra y venta..tendencia y estructura del mercado.se basa en tendencia

Daily Separator_Yoot HobbizSimply helps you separate each trading day — a clean, visual indicator that marks daily sessions so you can read price action faster and stay focused on what really matters.
A simple indicator that clearly separates each trading day, making your charts easier to read and your decisions easier to take.


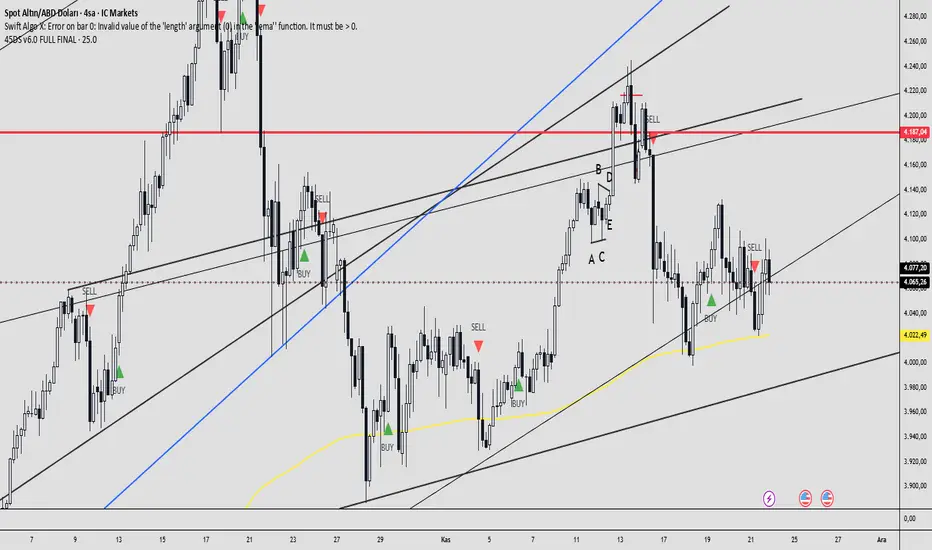
45DS v6.0 FULL FINAL1-5-15-30-60 dakıkalık zaman dlimlerinde sculp indikatörü . Başarısına inanamayacalsınız..
Pin Bar Fib Pullback + Engulfing + Pin Reversal (21 EMA + VWAP)21 EMA = trend filter
VWAP = intraday mean price filter
Fibs = 0.50 & 0.618 “golden pocket” from latest swing range
Signals = Pin bars + Engulfing candles inside that Fib zone, with trend + VWAP filter