ETIQUETAS DE ANCLAJE.INTERVALO 9:00 AM/4.15PMThis indicator displays labels on the candlestick that range from 9:00 am to 4:15 pm, with 5-minute intervals, indicating the 5M periods on the chart.
Pesquisar nos scripts por "机械革命无界15+时不时闪屏"

Tailwind(XMR)Tailwind is a staggered level breakout strategy (Grid Breakout), apparently designed to trade Monero (XMR), although the logic can be applied to any asset.
In this case, traditional indicators are not used. Instead, the price is divided into a grid based on a step size (step_size), which defaults to 27 points.
The strategy looks for the exact moment when the price "breaks out" or crosses upward one of these invisible steps (since there is an upward bias). It buys if the current candle closed above the step, but the previous candle closed below that same level. In other words, it detects when the price crosses a grid line.
Once it enters a trade (buy), it sets fixed and symmetric targets based on the step size.
• Entry: The price of the base level (the multiple of 27) is assumed.
• Take Profit: entry_level + step_size. It aims to gain exactly one step upward.
• Stop Loss: entry_level - step_size. It cuts losses if the price falls exactly one step downward.
The code includes advanced visual logic (line.new and line.set_x2):
• When a trade is opened, it draws a dashed green line on the chart indicating where your Take Profit is.
• It draws a dashed red line indicating your Stop Loss.
• These lines extend to the right as long as the trade remains open.
Capital Configuration
• Initial Capital: 20,000 USDT (or the base currency).
• Position Size: Risks 10% of your total capital on each trade.
• Commission: Simulates a 0.1% cost per trade.
The system operates on timeframes of 5 minutes, 15 minutes, 30 minutes, 45 minutes, 4 hours...

GK Zero-Lag Major BOS TrendGK ZERO-LAG Major BOS Trend
is a technical indicator designed to highlight breaks of structure BOS
in the direction of the prevailing trend
The script uses a zero-lag trend filter combined with confirmed structural high/low breaks to reduce noise and avoid minor or premature prints.
Print labels are only printed after candle close, ensuring stable, and confirmed prints
The indicator is designed to help traders identify trend continuation and structural shifts,
making it suitable as a confirmed tool across multiple markets and timeframes.
Best used on higher timeframes 5/15/30Min 2/3/4Hour
also resistance and support lines
Disclaimer
this indicator is provided for educational purposes only

Day Trading MA Crossover IndicatorDay Trading MA Crossover Indicator Overview The Day Trading MA Crossover Indicator is a simple yet effective tool designed for day traders to identify potential buy and sell opportunities based on moving average crossovers. It plots two customizable moving averages on your chart and generates clear visual signals when they cross, helping you spot trend reversals or continuations in fast-paced markets.This indicator is ideal for intraday trading on lower timeframes (e.g., 5-min, 15-min charts) but can be adapted for swing trading or higher timeframes. It's built with flexibility in mind, allowing you to tweak the MA lengths and types to suit your strategy.Key FeaturesMoving Average Crossovers: Generates "BUY" signals when the fast MA crosses above the slow MA (potential bullish entry) and "SELL" signals when it crosses below (potential bearish entry or exit).
Visual Signals: Green "BUY" labels below bars for long entries and red "SELL" labels above bars for short entries or exits. Optional subtle background coloring highlights signals for quick spotting.
Customizable Parameters:Fast MA Length (default: 9): Period for the shorter moving average.
Slow MA Length (default: 21): Period for the longer moving average.
MA Type (default: EMA): Choose between SMA (Simple), EMA (Exponential), or WMA (Weighted) for different smoothing behaviors.
Overlay Mode: Plots directly on your price chart without cluttering separate panes.
Lightweight and Efficient: Minimal computation for real-time performance on TradingView.
How It WorksMoving Averages Calculation: The indicator computes two MAs based on your selected type and lengths using closing prices.
Signal Detection: A buy signal triggers on an upward crossover (fast MA > slow MA), indicating potential momentum shift to the upside. A sell signal triggers on a downward crossunder (fast MA < slow MA), signaling possible downside momentum.
Visual Aids: Signals appear as labeled shapes with optional background tints to emphasize key bars.
Usage TipsFor Day Trading: Apply on volatile instruments like forex pairs, stocks, or crypto. Combine with support/resistance levels or other indicators (e.g., RSI for overbought/oversold confirmation) to filter false signals in ranging markets.
Backtesting: Test on historical data to optimize MA lengths for your asset—shorter periods for aggressive trading, longer for smoother trends.
Risk Management: Always use stop-losses and position sizing. Signals are not foolproof and work best in trending conditions.
Customization: Adjust inputs via the indicator settings panel after adding it to your chart.
Example SetupOn a 5-min EUR/USD chart: Use EMA (9/21) for quick crossovers. Look for buy signals above key support with increasing volume.
Avoid choppy markets where frequent false crossovers ("whipsaws") can occur.
This indicator is provided for educational and informational purposes only. It is not financial advice, and past performance does not guarantee future results. Trading involves risk; consult a professional advisor before using any strategy. If you have feedback or suggestions for improvements, feel free to comment!

INSTITUTIONAL VOLUME PROFILE + FIBONACCI + ENHANCED SIGNALS🎯 INSTITUTIONAL VOLUME PROFILE + FIBONACCI + ENHANCED SIGNALS
A professional-grade indicator combining Volume Profile analysis, Fibonacci retracements, Anchored VWAP, and intelligent signal filtering to identify high-probability institutional positioning and trade setups.
📊 CORE FEATURES
▸ Volume Profile with POC (Point of Control)
- Visualizes where institutional volume accumulated
- Identifies High Volume Nodes (HVN) as key support/resistance
- Shows Value Area (70% volume zone) for market equilibrium
▸ Dynamic Fibonacci Levels
- Auto-detects swing high/low for retracement levels
- Golden Pocket (0.618-0.65) highlight zone
- Bull/bear direction recognition
▸ Anchored VWAP
- Anchored to swing range start
- Institutional mean reversion baseline
- Real-time trend bias indicator
▸ Graded Signal System (A+/B/C)
- A+ Signals: High probability setups (VWAP cross + POC alignment)
- B Signals: Above-average quality (VWAP cross above POC)
- C Signals: Lower probability (counter-trend setups)
🎮 DISPLAY MODES
⚡ TRADING LIVE MODE
- Clean chart showing only A+ signals
- Minimal visual noise for active trading
- Perfect for intraday execution
📈 FULL OVERVIEW MODE
- Complete analysis with all zones visible
- Volume Profile + Fibonacci + Value Area
- All signal grades displayed
- Statistics dashboard
🔬 ADVANCED SIGNAL FILTERS
✓ Volume Confirmation
- Requires above-average volume on signals
- Filters out weak institutional participation
- Configurable volume multiple (default 1.2x)
✓ Momentum Filter
- Ensures price momentum aligns with signal direction
- Prevents counter-trend entries
- Configurable lookback period
✓ SR Proximity Upgrade ⭐ GAME CHANGER
- Automatically upgrades B/C signals to A+ when near key levels
- Detects proximity to POC and HVN zones
- Combines technical confluence for best setups
🔔 SMART ALERTS
▸ Configurable alerts for A+, B, or C signals
▸ Real-time notifications to your device
▸ No need to watch charts constantly
▸ "Once per bar close" prevents repainting
💡 HOW TO USE
FOR DAY TRADING:
1. Switch to "Trading Live" mode
2. Enable only A+ alerts
3. Set filters: Volume 1.5x, Momentum ON, Proximity 0.3%
4. Trade only A+ signals at key levels
FOR SWING TRADING:
1. Use "Full Overview" mode
2. Analyze Value Area and Fibonacci confluence
3. Set filters: Volume 1.2x, Momentum ON, Proximity 0.8%
4. Enter on A+ signals with multi-timeframe confirmation
FOR ANALYSIS:
1. Full Overview mode with all visuals enabled
2. Disable filters to see all raw signals
3. Study how institutions positioned at key zones
4. Plan trades around POC and Value Area
⚙️ RECOMMENDED SETTINGS
5-15 MIN CHARTS (Scalping):
- Lookback: 200-300 bars
- Volume: 1.5x, Momentum: 5 bars, Proximity: 0.3%
- Trading Live mode + A+ alerts only
1 HOUR CHARTS (Intraday):
- Lookback: 300 bars
- Volume: 1.3x, Momentum: 3 bars, Proximity: 0.5%
- Full Overview or Trading Live
4 HOUR CHARTS (Swing):
- Lookback: 300-500 bars
- Volume: 1.2x, Momentum: 3 bars, Proximity: 0.8%
- Full Overview mode
DAILY CHARTS (Position):
- Lookback: 300-500 bars
- Volume: 1.1x, Momentum: 2 bars, Proximity: 1.0%
- Full Overview mode
📈 KEY CONCEPTS
POC (Point of Control): Price level with highest volume - acts as magnet
Value Area: Zone containing 70% of volume - equilibrium range
HVN: High Volume Nodes - institutional accumulation zones
AVWAP: Anchored VWAP - institutional average entry price
Golden Pocket: 0.618-0.65 Fib zone - highest probability reversal area
🎯 TRADING STRATEGY TIPS
1. Wait for A+ signals - quality over quantity
2. Best setups occur at POC or Value Area boundaries
3. Use multiple timeframes for confirmation
4. Combine with your own risk management rules
5. Signals are high probability, not guaranteed - always use stops

Volume-Gated Trend Ribbon [QuantAlgo]🟢 Overview
The Volume-Gated Trend Ribbon employs a selective price-updating mechanism that filters market noise through volume validation, creating a trend-following system that responds exclusively to significant price movements. The indicator gates price updates to moving average calculations based on volume threshold crossovers, ensuring that only bars with significant participation influence the trend direction. By interpolating between fast and slow moving averages to create a multi-layered visual ribbon, the indicator provides traders and investors with an adaptive trend identification framework that distinguishes between volume-backed directional shifts and low-conviction price fluctuations across multiple timeframes and asset classes.
🟢 How It Works
The indicator first establishes a dynamic baseline by calculating the simple moving average of volume over a configurable lookback period, then applies a user-defined multiplier to determine the significance threshold:
avgVol = ta.sma(volume, volPeriod)
highVol = volume >= avgVol * volMult
The gated price mechanism employs conditional updating where the close price is only captured and stored when volume exceeds the threshold. During low-volume periods, the indicator maintains the last qualified price level rather than tracking every minor fluctuation:
var float gatedClose = close
if highVol
gatedClose := close
Dual moving averages are calculated using the gated price input, with the indicator supporting various MA types. The fast and slow periods create the outer boundaries of the trend ribbon:
fastMA = volMA(gatedClose, close, fastPeriod)
slowMA = volMA(gatedClose, close, slowPeriod)
Ribbon interpolation creates intermediate layers by blending the fast and slow moving averages using weighted combinations, establishing a gradient effect that visually represents trend strength and momentum distribution:
midFastMA = fastMA * 0.67 + slowMA * 0.33
midSlowMA = fastMA * 0.33 + slowMA * 0.67
Trend state determination compares the fast MA against the slow MA, establishing bullish regimes when the faster average trades above the slower average and bearish regimes during the inverse relationship. Signal generation triggers on state transitions, producing alerts when the directional bias shifts:
bullish = fastMA > slowMA
longSignal = trendState == 1 and trendState != 1
shortSignal = trendState == -1 and trendState != -1
The visualization architecture constructs a three-tiered opacity gradient where the ribbon's core (between mid-slow and slow MAs) displays the highest opacity, the inner layer (between mid-fast and mid-slow) shows medium opacity, and the outer layer (between fast and mid-fast) presents the lightest fill, creating depth perception that emphasizes the trend center while acknowledging edge uncertainty.
🟢 How to Use This Indicator
▶ Long and Short Signals: The indicator generates long/buy signals when the trend state transitions to bullish (fast MA crosses above slow MA) and short/sell signals when transitioning to bearish (fast MA crosses below slow MA). Because these crossovers only reflect volume-validated price movements, they represent significant level of participation rather than random noise, providing higher-conviction entry signals that filter out false breakouts occurring on thin volume.
▶ Ribbon Width Dynamics: The spacing between the fast and slow moving averages creates the ribbon width, which serves as a visual proxy for trend strength and volatility. Expanding ribbons indicate accelerating directional movement with increasing separation between short-term and long-term momentum, suggesting robust trend development. Conversely, contracting ribbons signal momentum deceleration, potential trend exhaustion, or impending consolidation as the fast MA converges toward the slow MA.
▶ Preconfigured Presets: Three optimized parameter sets accommodate different trading styles and market conditions. Default provides balanced trend identification suitable for swing trading on daily timeframes with moderate volume filtering and responsiveness. Fast Response delivers aggressive signal generation optimized for intraday scalping on 1-15 minute charts, using lower volume thresholds and shorter moving average periods to capture rapid momentum shifts. Smooth Trend offers conservative trend confirmation ideal for position trading on 4-hour to weekly charts, employing stricter volume requirements and extended periods to filter noise and identify only the most robust directional moves.
▶ Built-in Alerts: Three alert conditions enable automated monitoring: Bullish Trend Signal triggers when the fast MA crosses above the slow MA confirming uptrend initiation, Bearish Trend Signal activates when the fast MA crosses below the slow MA confirming downtrend initiation, and Trend Change alerts on any directional transition regardless of direction. These notifications allow you to respond to volume-validated regime shifts without continuous chart monitoring.
▶ Color Customization: Six visual themes (Classic, Aqua, Cosmic, Ember, Neon, plus Custom) accommodate different chart backgrounds and display preferences, ensuring optimal contrast and visual clarity across trading environments. The adjustable fill opacity control (0-100%) allows fine-tuning of ribbon prominence, with lower opacity values create subtle background context while higher values produce bold trend emphasis. Optional bar coloring extends the trend indication directly to the price bars, providing immediate directional reference without requiring visual cross-reference to the ribbon itself.

FVG 15 min PilotOverview
This indicator implements a fully automated FVG (Fair Value Gap) rejection trading strategy with precise entry management, session limitation, and performance tracking. The indicator identifies fair value gaps, waits for the first tap into the 0.79 level, and automatically accepts entries with a fixed stop loss and an adjustable risk-reward ratio.
Overview
This indicator implements a fully automated FVG (Fair Value Gap) rejection trading strategy with precise entry management, session limitation, and performance tracking. The indicator detects fair value gaps, waits for the first tap into the 0.79 level, and automatically accepts entries with a fixed stop loss and an adjustable risk-reward ratio.
... Core Trading Logic
Entry Conditions
For LONG (Bullish FVG Rejection):
A bullish FVG must exist (upward price gap)
FVG must not be older than X candles (default: 20)
FVG must not be larger than X ticks (default: 50)
FVG must not have been tapped (not even before the trading session)
Price must touch the 0.79 level of the FVG
Entry occurs exactly at the 0.79 level (79% of the lower to the upper edge of the FVG)
SL is placed X ticks below the entry (default: 25)
TP is calculated based on a risk:reward ratio (default: 1:1)
For SHORT (Bearish FVG Rejection):
Identical logic to bearish FVGs
Entry at the 0.79 level (79% of the upper to the lower edge)
SL X ticks above the entry
TP is calculated based on a risk:reward ratio

Abyss Protocol OneAbyss Protocol One — Momentum Exhaustion Trading System
Overview
Abyss Protocol One is a momentum exhaustion indicator designed to identify high-probability reversal points by detecting when price momentum has reached extreme levels. It combines Chande Momentum Oscillator (CMO) threshold signals with dynamic volatility-adjusted bands and multiple protective filters to generate buy and sell signals.
Core Concept
The indicator operates on the principle that extreme momentum readings (CMO reaching ±80) often precede mean reversion. Rather than chasing trends, Abyss Protocol waits for momentum exhaustion before signaling entries and exits.
Key Components
1. Dynamic Bands (Money Line ± ATR)
Center line uses linear regression (Money Line) for smooth trend representation
Bands expand and contract based on Bollinger Band Width Percentile (BBWP)
Low volatility (BBWP < 30): Tighter bands using lower multiplier
High volatility (BBWP > 70): Wider bands using higher multiplier
Bands visually adapt to current market conditions
2. CMO Exhaustion Signals
BUY Signal: CMO drops below -80 (oversold/momentum exhaustion to downside)
SELL Signal: CMO rises above +80 (overbought/momentum exhaustion to upside)
Thresholds are configurable for different assets and timeframes
3. ADX Filter
Signals only fire when ADX exceeds minimum threshold (default: 22)
Ensures there's enough directional movement to trade
Prevents signals during choppy, directionless markets
4. Band Contraction Filter
Calculates band width percentile rank over configurable lookback
When bands are contracted (below 18th percentile), ALL signals are blocked
Prevents trading during low-volatility squeeze periods where breakout direction is uncertain
5. Consecutive Buy Limit
Maximum of 3 consecutive buys allowed before a sell is required
Prevents overexposure during extended downtrends
Counter resets when a sell signal fires
6. Underwater Protection
Tracks rolling average of recent entry prices (last 10 entries within 7 days)
Blocks sell signals if current price is below average entry price
Prevents locking in losses during drawdowns
7. Signal Cooldown
Minimum 5-bar cooldown between signals
Prevents rapid-fire signals during volatile swings
8. Extreme Move Detection
Detects when price penetrates beyond bands by more than 0.6 × ATR
Extreme signals can bypass normal cooldown period
Fire intra-bar for faster response to capitulation/blow-off moves
Still respects max consecutive buys and underwater protection
Visual Features
Trend State Detection
The indicator classifies market conditions into six states based on EMA stack, price position, and directional indicators:
STRONG UP: Full bullish alignment (EMA stack + price above trend + bullish DI + ADX > threshold)
UP: Moderate bullish conditions
NEUTRAL: No clear directional bias
DOWN: Moderate bearish conditions
STRONG DOWN: Full bearish alignment
CONTRACTED: Bands squeezed, volatility low
ADX Trend Bar
Colored dots at chart bottom provide instant trend state visibility:
Lime = Strong Uptrend
Blue = Uptrend
Orange = Neutral
Red = Downtrend
Maroon = Strong Downtrend
White = Contracted
Volume Spike Highlighting
Purple background highlights candles where volume exceeds 2x the 20-bar average, helping identify institutional activity or significant market events.
Signal Labels
Buy labels show consecutive buy count (e.g., "BUY 2/3"), price, and CMO value
Sell labels show consecutive sell count, price, and CMO value
Extreme signals display in distinct colors (cyan for buys, fuchsia for sells)
Signal candles turn bright blue for easy identification
Info Panel
Real-time dashboard displaying:
Current trend state
CMO value with threshold status
CMO thresholds (buy/sell levels)
ADX with directional indicator (▲/▼) and signal eligibility
BBWP percentage
Buy/Sell counters
Average entry price (with underwater shield indicator 🛡 when protected)
Price position relative to Money Line
Band width percentile rank
Extreme move status
Signals status (OPEN/BLOCKED)
Recommended Use
Timeframe: 5-15 minute charts (parameters tuned for this range)
Best suited for: Assets with regular oscillations between overbought/oversold extremes
Trading style: Mean reversion, momentum exhaustion, scaled entries
Parameters Summary
Money Line Length: 12 — Smoothing for center line
ATR Length: 10 — Volatility measurement
Band Multiplier (Low/High Vol): 1.5 / 2.5 — Dynamic band width
CMO Length: 9 — Momentum calculation period
CMO Buy/Sell Threshold: -80 / +80 — Signal trigger levels
ADX Min for Signals: 22 — Minimum trend strength
Signal Cooldown: 5 bars — Minimum bars between signals
Max Consecutive Buys: 3 — Position scaling limit
Band Contraction Threshold: 18th %ile — Low volatility filter
Band Contraction Lookback: 188 bars — Percentile calculation period
Extreme Penetration: 0.6 × ATR — Threshold for extreme signals

RSI+Breadth Multi-Factor# RSI+ Breadth Multi-Factor Indicator
**Multi-factor scoring system for US market timing | 美股多因子择时评分系统**
[! (img.shields.io)](www.tradingview.com)
[! (img.shields.io)](www.tradingview.com)
[! (img.shields.io)](LICENSE)
---
## Overview | 概述
A quantitative indicator that combines **RSI**, **market breadth** (% above 20/50-day MA), and **up/down volume ratio** to generate actionable buy/sell signals for SPY, QQQ, and IWM.
这是一个结合 **RSI**、**市场广度**(站上20/50日均线比例)和 **涨跌成交量比** 的量化指标,为 SPY、QQQ 和 IWM 生成可操作的买卖信号。
---
## Features | 功能特点
| Feature | 功能 |
|---------|------|
| 🎯 Multi-factor scoring (-10 to +10) | 多因子评分系统 (-10 到 +10) |
| 📊 RSI + Breadth + Volume integration | RSI + 广度 + 成交量三重验证 |
| 🔀 Three markets: SPY, QQQ, IWM | 三大市场:SPY、QQQ、IWM |
| 🔥 Cross-market resonance detection | 跨市场共振信号检测 |
| 📈 Trend filter (MA-based) | 趋势过滤(均线判断) |
| ⏰ Auto-adapts to intraday timeframes | 自动适配日内时间周期 |
| 🎚️ Three modes: Aggressive/Standard/Conservative | 三种模式:激进/标准/保守 |
---
## Signal Reference | 信号说明
| Score | Emoji | Signal | 中文 | Action |
|:-----:|:-----:|--------|:----:|--------|
| ≥ 6 | 🚀 | **PANIC LOW** | 恐慌低点 | Strong buy 强烈买入 |
| ≥ 4 | 📈 | **BUY ZONE** | 低吸区 | Accumulate 分批建仓 |
| -3~3 | - | **HOLD** | 持有 | Hold position 持仓观望 |
| ≤ -4↑ | ⭐ | **ELEVATED** | 高估 | Hold cautious 持有但谨慎 |
| ≤ -4↓ | ⚡ | **CAUTION** | 观望 | Take profit 止盈 |
| ≤ -6↓ | ⚠️ | **REDUCE** | 减仓 | Reduce position 减少仓位 |
> **↑ = Uptrend** (price > MA) | **↓ = Downtrend** (price < MA)
### Resonance Signals | 共振信号
| Emoji | Signal | Description |
|:-----:|--------|-------------|
| 🔥 | Resonance Buy | Multiple markets in buy zone 多市场同时低吸 |
| ❄️ | Resonance Risk | Multiple markets in risk zone 多市场同时高估 |
---
## Scoring Logic | 评分逻辑
### Factors | 因子
| Factor | Weight | Buy Score | Sell Score |
|--------|--------|-----------|------------|
| **RSI** | 1x | RSI < 30 → +2, < 40 → +1 | RSI > 75 → -2, > 65 → -1 |
| **FI (50D MA%)** | Bottom focus | < 25% → +3, < 35% → +2 | > 85% → -2, > 78% → -1 |
| **TW (20D MA%)** | Top focus | < 30% → +1 | > 82% → -3, > 72% → -2 |
| **Volume Ratio** | 1x | UVOL/DVOL < 0.5 → +2 | > 2.5 → -2 |
### Breadth Symbols | 广度数据
| Market | TW Symbol | FI Symbol | Volume |
|--------|-----------|-----------|--------|
| SPY (S&P 500) | INDEX:S5TW | INDEX:S5FI | USI:UVOL/DVOL |
| QQQ (NASDAQ) | INDEX:NCTW | INDEX:NCFI | USI:UVOLQ/DVOLQ |
| IWM (Russell 2000) | INDEX:R2TW | INDEX:R2FI | USI:UVOL/DVOL |
---
## Settings | 设置说明
### Mode | 模式
- **Aggressive**: Lower thresholds, shorter cooldown (5 bars)
- **Standard**: Balanced defaults (10 bar cooldown)
- **Conservative**: Higher thresholds, longer cooldown (15 bars)
### Key Parameters | 关键参数
| Parameter | Default | Description |
|-----------|---------|-------------|
| RSI Length | 14 | RSI calculation period |
| Trend MA Length | 10 | MA for trend filter |
| Cooldown Bars | 10 | Min bars between same signals |
| Resonance Window | 3 | Bars to check for multi-market agreement |
| Min Markets | 2 | # of markets needed for resonance |
---
## Usage | 使用方法
### Installation | 安装
1. Copy the indicator code
2. In TradingView: **Pine Editor** → **New** → Paste code → **Add to Chart**
### Recommended Setup | 推荐设置
- **Timeframe**: Daily (D) for best accuracy | 推荐日线图
- **Markets**: Apply on SPY, QQQ, or IWM | 应用于SPY/QQQ/IWM
- **Mode**: Start with "Standard" | 建议从"标准"模式开始
### Intraday Mode | 日内模式
The indicator automatically detects intraday timeframes and adjusts:
- Uses only RSI + Volume factors (TW/FI are daily-only data)
- Lowers signal thresholds accordingly
指标会自动检测日内周期并调整:
- 仅使用 RSI + 成交量因子(TW/FI 仅有日线数据)
- 相应降低信号触发阈值
---
## Dashboard | 仪表盘
Displays real-time factor breakdown:
```
┌────────┬───────┬────────┐
│ Factor │ Score │ Weight │
├────────┼───────┼────────┤
│ RSI │ 1.0 │ 1x │
│ FI(50D)│ 2.0 │ Bottom │
│ TW(20D)│ -1.0 │ Top │
│ Vol │ 1.0 │ 1x │
│ Trend │ ↑ │ 10MA │
├────────┼───────┼────────┤
│ Total │ 3.0 │ HOLD │
└────────┴───────┴────────┘
```
---
## Alerts | 警报
Available alerts for each market (SPY/QQQ/IWM):
- Panic Low / Buy Zone (entry signals)
- Reduce / Caution (exit signals)
- Resonance Buy / Risk (cross-market confirmation)
每个市场(SPY/QQQ/IWM)可设置以下警报:
- 恐慌低点 / 低吸区(入场信号)
- 减仓 / 观望(出场信号)
- 共振买入 / 风险(跨市场确认)
---
## Trend Filter | 趋势过滤
**Key feature**: Risk signals (CAUTION/REDUCE) only trigger when **price is below the trend MA**.
When price is above MA (uptrend), the indicator shows **ELEVATED** ⭐ instead, preventing premature exits during strong rallies.
**核心功能**:风险信号(观望/减仓)仅在 **价格跌破趋势均线** 时触发。
当价格在均线之上(上升趋势)时,指标显示 **高估** ⭐,避免在强势上涨中过早离场。
---
## Disclaimer | 免责声明
This indicator is for **educational and informational purposes only**. It is not financial advice. Past performance does not guarantee future results. Always do your own research and consider your risk tolerance before trading.
本指标仅供 **教育和参考用途**,不构成投资建议。历史表现不代表未来收益。交易前请自行研究并考虑风险承受能力。
---
## License | 许可
MIT License - Free to use and modify with attribution.
MIT 许可证 - 可自由使用和修改,请注明出处。
---
## Author | 作者
Built with ❤️ for the trading community.
为交易社区精心打造 ❤️

DeMarker (DeM)The DeMarker (DeM) indicator is a momentum oscillator designed to identify overbought and oversold conditions by comparing the most recent price extremes (highs and lows) to those of the previous candle. It moves between 0 and 1 and is especially useful for spotting potential trend reversals, exhaustion, and better-timed entries within larger trends.
How the DeMarker works
The DeMarker focuses on the relationship between today’s highs and lows and those of the previous bar:
• When price is pushing to new highs but not making significantly lower lows, DeM tends to rise toward 1, reflecting buying pressure and potential overbought conditions.
• When price is making lower lows but not significantly higher highs, DeM falls toward 0, reflecting selling pressure and potential oversold conditions.
Internally, the indicator measures the positive difference between the current high and the previous high (up-move strength) and the positive difference between the previous low and the current low (down-move strength). These values are smoothed over a user-defined period and combined into a ratio that keeps the output bounded between 0 and 1, making it easy to interpret visually.
Default settings and parameters
Typical default settings are aimed at providing a balance between responsiveness and noise reduction:
• Length: 14
• Overbought level: 0.7
• Oversold level: 0.3
With these settings, readings above 0.7 suggest that the market may be overheated to the upside, while readings below 0.3 suggest potential exhaustion on the downside. Traders can adjust these parameters depending on their style and the volatility of the asset.
Example configurations
Here are a few practical configurations that can be suggested to users:
• Swing trading setup:
• Length: 14–21
• Overbought: 0.7–0.75
• Oversold: 0.25–0.3
This works well on 4H and daily charts for spotting potential swing highs and lows.
• Short-term intraday setup:
• Length: 7–10
• Overbought: 0.8
• Oversold: 0.2
A shorter length increases sensitivity, better for 5–15 minute charts, but also increases the number of signals.
• Trend-following filter:
• Length: 20–30
• Overbought: 0.65–0.7
• Oversold: 0.3–0.35
This smoother configuration can be used together with moving averages to filter trades in the direction of the main trend.
Basic trading usage
Traders commonly use DeMarker in three main ways:
• Mean-reversion entries:
• Look for DeM below the oversold level (for example, 0.3 or 0.25) while price is approaching a support zone.
• Consider long entries when DeM turns back up and crosses above the oversold level, ideally confirmed by a bullish candle pattern or break of minor resistance.
• Taking profits or trimming positions:
• When DeM moves above the overbought level (for example, 0.7–0.8) near a known resistance level, traders may choose to take partial profits or tighten stops.
• A downward turn from overbought after a strong rally often signals momentum exhaustion.
• Divergence signals:
• Bullish divergence: price makes a lower low while DeM makes a higher low. This can hint at weakening downside momentum and a possible reversal upward.
• Bearish divergence: price makes a higher high while DeM makes a lower high. This can warn of weakening upside momentum before a pullback.
Combining with other tools
DeMarker often performs best as part of a confluence-based approach rather than as a standalone signal generator:
• Combine with trend filters:
• Use a moving average (for example, 50 or 200 EMA) to define trend direction and take DeM oversold entries only in uptrends, or overbought entries only in downtrends.
• Use with support/resistance and price action:
• Prioritize DeM signals that occur near well-defined horizontal levels, trendlines, or supply/demand zones.
• Add volume or volatility tools:
• Strong signals tend to appear when DeM reverses from extreme zones in sync with a volume spike or volatility contraction/expansion.

Trinity Real Move Detector DashboardRelease Notes (critical)
1. This code "will" require tweaks for different timeframes to the multiplier, do not assume the data in the table is accurate, cross check it with the Trinity Real Move Detector or another ATR tool, to validate the values in the table and ensure you have set the correct values.
2. I mention this below. But please understand that pine code has a limitation in the number of security calls (40 request.security() calls per script). This code is on the limit of that threshold and I would encourage developers to see if they can find a way around this to improve the script and release further updates.
What do we have...
The Trinity Real Move Detector Dashboard is a powerful TradingView indicator designed to scan multiple assets at once and show when each one has genuine short-term volatility "energy" — the kind that makes directional options trades (especially 0DTE or short-dated) have a high probability of follow-through, and can be used for swing trading as well. It combines a simple ATR-based volatility filter with a SuperTrend-style bias to tell you not only if the market is "awake" but also in which direction the momentum is leaning.
At its core, the indicator calculates the current ATR on your chosen timeframe and compares it to a user-defined percentage of the asset's daily ATR. When the short-term ATR spikes above that threshold, it signals "enough energy" — meaning the underlying is moving with real force rather than choppy noise. The SuperTrend logic then determines bullish or bearish bias, so the status shows "BULLISH ENERGY" (green) or "BEARISH ENERGY" (red) when energy is on, or "WAIT" when it's not. It also counts how many bars the energy has been active and shows the current ATR vs threshold for quick visual confirmation.
The dashboard displays all this in a clean table with columns for Symbol, Multiplier, Current ATR, Threshold, Status, Bars Active, and Bias (UP/DOWN). It's perfect for 3-minute charts but works on any timeframe — just adjust the multiplier based on the hints in the settings.
Editing symbols and multipliers is straightforward and user-friendly. In the indicator settings, you'll see numbered inputs like "1. Symbol - NVDA" and "1. Multiplier". To change an asset, simply type the new ticker in the symbol field (e.g., replace "NVDA" with "TSLA", "AVGO", or "ADAUSD"). You can also adjust the multiplier for each asset individually in the corresponding "Multiplier" field to make it more or less sensitive — lower numbers give more signals, higher numbers give stricter, higher-quality ones. This lets you customize the dashboard to your watchlist without any coding. For example, if you switch to a 4-hour chart or a slower-moving stock like AVGO, you may need to raise the multiplier (e.g., to 0.3–0.4) to avoid false "bullish" signals during minor bounces in a larger downtrend.
One important note about the multiplier and timeframes: the default values are optimized for fast intraday charts (like 3-minute or 5-minute). On higher timeframes (15-minute, 1-hour, 4-hour, or daily), the SuperTrend bias can be too sensitive with low multipliers (1.0 default in the code), leading to situations like the AVGO 4-hour example — where price is clearly downtrending, but the dashboard shows "BULLISH ENERGY" because the tight bands flip on small bounces. To fix this, you need to manually increase the multiplier for that asset (or all assets) in the settings. For 4-hour or daily charts, 0.25–0.35 is often better to match smoother SuperTrend indicators like Trinity. Always test on your timeframe and asset — crypto usually needs slightly lower multipliers than stocks due to higher volatility.
TradingView has a hard limit of 40 request.security() calls per script. Each asset in the dashboard requires several calls (current ATR, daily ATR, SuperTrend components, etc.), so with the full ATR-based bias, you can safely monitor about 6–8 assets before hitting the limit. Adding more symbols increases the number of calls and will trigger the "too many securities" error. This is a platform restriction to prevent excessive server load, and there's no official way around it in a single script. Some advanced coders use tricks like caching or lower-timeframe requests to squeeze in a few more, but for reliability, sticking to 6–8 assets is recommended. If you need more, the common workaround is to create two separate indicators (e.g., one for stocks, one for crypto) and add both to the same chart.
Overall, this dashboard gives you a professional-grade multi-asset scanner that filters out low-energy noise and highlights real momentum opportunities across stocks and crypto — all in one glance. It's especially valuable for options traders who want to avoid theta decay on weak moves and only strike when the market has true fuel. By tweaking the per-symbol multipliers in the settings, you can perfectly adapt it to any timeframe or asset behavior, avoiding issues like the AVGO false bullish signal on higher timeframes.

Peter Lynch Value (Dynamic Growth)This indicator implements Peter Lynch's core valuation principle: Fair Price = Earnings Per Share (EPS) * Growth Rate.
It provides a dynamic "fair value" line overlaid on the price chart, allowing traders and investors to quickly assess whether a stock's current price is trading above or below its intrinsic value according to the Lynch method.
Key Features
1. Dynamic Growth Rate Calculation
The indicator uses a custom algorithm to calculate the critical EPS Growth Rate, making it robust against missing data from standard financial fields.
Methodology: It fetches historical TTM Diluted EPS reports (EARNINGS_PER_SHARE_DILUTED, TTM) and calculates the Year-over-Year (YoY) Growth Percentage from the current TTM value versus the TTM value 4 periods prior.
Reliability: This custom calculation ensures the value line appears even when TradingView's pre-calculated growth metrics are unavailable (na).
2. Multiplier Control
P/E Cap: You can enforce a maximum P/E multiplier (maxPE, default 25), preventing the fair value from becoming unrealistically high for extremely fast-growing companies (as Lynch suggested).
Fallback P/E: If insufficient financial history is available to calculate the growth rate, the indicator automatically switches to a user-defined fallbackPE (default 15) and highlights the line in orange as a warning.
3. Smoothing (Optional)
To reduce the volatility often seen in valuation metrics, you can apply an optional Simple Moving Average (SMA) to the Fair Value line. This helps visualize the underlying trend of intrinsic value.
4. Forward Estimate (Optional)
Display an optional projection (circles) based on the analysts' next Fiscal Year EPS Estimate (EARNINGS_ESTIMATE, FY). This shows the potential fair value if the company meets future expectations.
5. Diagnostic Table
A table in the corner provides transparency on the calculation:
Green/Red: Confirms if TTM EPS and Calculated Growth are found.
Final P/E Used: Shows the exact multiplier used (calculated growth or the manual fallback).
Disclaimer: This tool is for informational and educational purposes only and should not be considered financial advice.

VIX Term Structure Pro [v7.0 Enhanced]# VIX Term Structure Pro v7.0
[! (img.shields.io)](www.tradingview.com)
[! (img.shields.io)](www.tradingview.com)
[! (img.shields.io)](LICENSE)
**Professional VIX-based Market Sentiment & Timing Indicator**
专业的 VIX 市场情绪与择时指标
---
## 🌟 Overview / 概述
VIX Term Structure Pro is an advanced multi-factor market timing indicator that analyzes the VIX futures term structure, volatility regime, and market breadth to generate actionable buy/sell signals.
VIX Term Structure Pro 是一款高级多因子市场择时指标,通过分析 VIX 期货期限结构、波动率区间及市场广度,生成可操作的买卖信号。
---
## 🚀 Key Features / 核心功能
### 📊 Multi-Factor Scoring System / 多因子评分系统
- **Term Structure Z-Score**: Measures deviation from historical mean / 期限结构 Z 分数:衡量与历史均值的偏离
- **VIX/VX1 Basis**: Spot premium detection for panic signals / VIX 现货溢价:恐慌信号检测
- **Contango Analysis**: Futures curve shape insights / 期货升水分析
- **SKEW Integration**: Options skew for tail risk / SKEW 整合:尾部风险监测
- **Put/Call Ratio**: Sentiment extremes / 看跌/看涨比率:情绪极端
- **VVIX Support**: Volatility of volatility (optional) / VVIX 支持:波动率的波动率
### 🎯 Three-Tier Signal System / 三级信号系统
| Signal | Score | Description |
|--------|-------|-------------|
| 🚨 **CRASH BUY** | ≥ 6 | Extreme panic, rare opportunity / 极端恐慌,罕见机会 |
| 🟢 **STRONG BUY** | ≥ 5 | Multi-factor confluence / 多因子共振 |
| 🟡 **BUY DIP** | ≥ 4 | Accumulate on weakness / 逢低吸纳 |
| 🟠 **SELL/HEDGE** | ≤ -2 | Consider reducing risk / 考虑减仓对冲 |
| 🔴 **STRONG SELL** | ≤ -5 | Strong bearish signals / 强烈看跌信号 |
| 🔥 **EUPHORIA SELL** | ≤ -6 | Extreme greed, sell signal / 极度贪婪,卖出信号 |
### 📈 Dashboard Indicators / 仪表盘指标解读
| Indicator | Bullish 🟢 | Bearish 🔴 |
|-----------|------------|------------|
| Overall Bias | STRONG BUY / BUY DIP | STRONG SELL / SELL/HEDGE |
| AI Score | ≥ 5 (Extreme Fear) | ≤ -5 (Extreme Greed) |
| Market Trend | 🟢SPX 🟢NDX (Above MA200) | 🔴SPX 🔴NDX (Below MA200) |
| VIX Regime | LOW VOL (<15) | HIGH VOL (>25) |
| Term Struct Z | < -2.0 (Panic) | > 2.0 (Complacency) |
---
## ⚙️ Configuration / 配置选项
### 📡 Data Sources / 数据源
- **VIX Symbol**: Default `CBOE:VIX` (Alternative: `TVC:VIX`)
- **Put/Call Ratio**: Default `INDEX:CPCI` (Index P/C)
- **Timeframe**: Daily (stable) or Chart (real-time)
### ⚠️ Strategy Mode / 策略模式
- **High (Scalping)**: Sensitive, for short-term trades / 高敏感,短线
- **Normal (Swing)**: Balanced approach / 平衡模式
- **Low (Trend/Safe)**: Conservative, trend-following / 保守,趋势跟踪
### 🔬 Backtest Mode / 回测模式
- **OFF (Real-time)**: Shows current day data, suitable for live monitoring / 显示当日数据,适合实盘监控
- **ON (Historical)**: Uses only confirmed data, avoids look-ahead bias / 仅使用已确认数据,避免未来函数
---
## 📖 Usage Guide / 使用指南
### Best Practices / 最佳实践
1. **Apply to SPX/SPY/QQQ daily charts** for optimal signal accuracy
在 SPX/SPY/QQQ 日线图上使用,信号准确度最佳
2. **Wait for next trading day** to execute signals (signals trigger on daily close)
信号触发后在下一交易日执行(信号基于日线收盘)
3. **Use in conjunction with price action** for confirmation
结合价格走势确认信号
4. **Enable Market Trend Filter** (MA200) for safer entries in uncertain markets
开启趋势过滤(MA200)以在不确定市场中更安全入场
### Signal Interpretation / 信号解读
```
🚨 CRASH BUY (Score ≥ 6)
→ Rare extreme panic event
→ Historical average return: significant positive over 2 months
→ Consider aggressive positioning
🟢 STRONG BUY (Score ≥ 5)
→ Multiple indicators align
→ Historical average return: positive over 1 month
→ Consider building positions
🟡 BUY DIP (Score ≥ 4)
→ Moderate fear detected
→ Suitable for adding to existing positions
→ Filtered out in bear markets if Trend Filter is ON
```
---
## 📊 Historical Statistics / 历史统计
The indicator tracks signal frequency and average subsequent returns:
- **CRASH BUY**: 40-day return period (~2 months)
- **STRONG BUY**: 20-day return period (~1 month)
- **BUY DIP**: 10-day return period (~2 weeks)
指标追踪信号频率和后续平均收益,可在仪表盘中查看历史统计。
---
## 🔔 Alerts / 警报
Built-in alert conditions with cooldown mechanism to prevent spam:
| Alert | Condition |
|-------|-----------|
| Crash Buy Alert | Score ≥ 6, extreme panic |
| Strong Buy Alert | Score ≥ 5, multi-factor confluence |
| Buy Dip Alert | Score ≥ threshold |
| Euphoria Sell Alert | Score ≤ -6, extreme greed |
| Strong Sell Alert | Score ≤ -5 |
| VIX Basis Panic | VIX spot premium spike |
---
## 📋 Changelog / 更新日志
### v7.0 (Current)
- ✨ Three-tier buy/sell signal system
- 📊 Signal statistics with average return tracking
- 🔬 Backtest Mode toggle for historical testing
- 🎨 Configurable ±1 Z-Score reference lines
- ⚡ Modular scoring functions
- 🛡️ Dual index trend display (SPX + NDX)
- 📱 Compact & Full dashboard modes
---
## ⚠️ Disclaimer / 免责声明
**English:**
This indicator is for educational and informational purposes only. It does not constitute financial advice. Past performance does not guarantee future results. Always do your own research and consider your risk tolerance before trading.
**中文:**
本指标仅供教育和信息参考,不构成投资建议。过往表现不代表未来收益。交易前请自行研究并评估风险承受能力。
---
## 📄 License / 许可证
MIT License - Feel free to use, modify, and share.
---
## 🤝 Contributing / 贡献
Issues and pull requests are welcome!
欢迎提交问题和贡献代码!
---
**Made with ❤️ for the trading community**
**为交易社区用心打造**

FOMC Sweep Reaction AP Capital – FOMC Sweep Reaction v1.0
AP Capital – FOMC Sweep Reaction v1.0 is a news-reaction and liquidity-based trading tool designed specifically to track and trade FOMC volatility on Gold (XAUUSD) and other highly reactive instruments.
The indicator focuses on liquidity sweeps, structure breaks, and EMA reclaims that commonly occur around Federal Reserve interest-rate decisions and Powell speeches, helping traders identify high-probability reversal or continuation moves after the initial spike.
🔍 What This Indicator Detects
This tool highlights the most repeatable FOMC behaviours observed across multiple months of broker data:
• Sweeps of previous day’s high or low
• Stop-hunt wicks into liquidity pools
• EMA13 reclaim after the news spike
• Break and close beyond short-term structure
• Momentum shift following volatility exhaustion
The goal is not to predict the news, but to react to confirmed price behaviour after liquidity has been taken.
📌 Core Features
• FOMC Sweep Detection
Identifies aggressive wicks into prior highs/lows during news volatility
• EMA Reclaim Confirmation
Uses EMA13 to validate momentum shift after the sweep
• Market Structure Awareness
Filters reactions that fail to break structure to avoid false reversals
• Session-Aligned Logic
Designed around London → NY → FOMC release timing
• Clean Visuals
Minimal chart clutter for fast decision-making during volatile conditions
🧠 How to Use
Wait for FOMC release / Powell speech
Allow price to sweep previous liquidity (PDH / PDL / local extremes)
Observe reclaim of EMA13
Enter only after structure confirmation
Manage trade using EMA trailing or structure-based exits
⚠️ This is a reaction system, not a prediction tool.
📊 Best Use Cases
• XAUUSD (Gold)
• NASDAQ / US indices
• High-impact macro news events
• 5-min to 15-min timeframes
⚠️ Important Notes
• News volatility is extreme — risk management is essential
• Not designed for low-volatility or ranging markets
• Best combined with a clear trading plan and strict risk rules
📎 Disclaimer
This indicator is for educational purposes only and does not constitute financial advice. Trading during high-impact news events involves significant risk.

Relative Strength IndexRSI for indian market buy low and sell high.
rsi 3 low belo 15 buy and rsi high above 85 sell

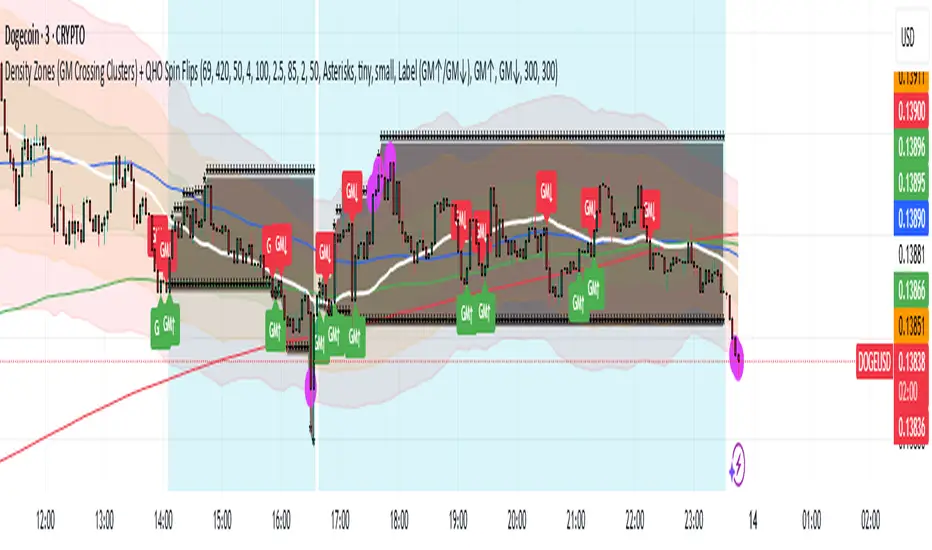
Density Zones (GM Crossing Clusters) + QHO Spin FlipsINDICATOR NAME
Density Zones (GM Crossing Clusters) + QHO Spin Flips
OVERVIEW
This indicator combines two complementary ideas into a single overlay: *this combines my earlier Geometric Mean Indicator with the Quantum Harmonic Oscillator (Overlay) with additional enhancements*
1) Density Zones (GM Crossing Clusters)
A “Density Zone” is detected when price repeatedly crosses a Geometric Mean equilibrium line (GM) within a rolling lookback window. Conceptually, this identifies regions where the market is repeatedly “snapping” across an equilibrium boundary—high churn, high decision pressure, and repeated re-selection of direction.
2) QHO Spin Flips (Regression-Residual σ Breaches)
A “Spin Flip” is detected when price deviates beyond a configurable σ-threshold (κ) from a regression-based equilibrium, using normalized residuals. Conceptually, this marks excursions into extreme states (decoherence / expansion), which often precede a reversion toward equilibrium and/or a regime re-scaling.
These two systems are related but not identical:
- Density Zones identify where equilibrium crossings cluster (a “singularity”/anchor behavior around GM).
- Spin Flips identify when price exceeds statistically extreme displacement from the regression equilibrium (LSR), indicating expansion beyond typical variance.
CORE CONCEPTS AND FORMULAS
SECTION A — GEOMETRIC MEAN EQUILIBRIUM (GM)
We define two moving averages:
(1) MA1_t = SMA(close_t, L1)
(2) MA2_t = SMA(close_t, L2)
We define the equilibrium anchor as the geometric mean of MA1 and MA2:
(3) GM_t = sqrt( MA1_t * MA2_t )
This GM line acts as an equilibrium boundary. Repeated crossings are interpreted as high “equilibrium churn.”
SECTION B — CROSS EVENTS (UP/DOWN)
A “cross event” is registered when the sign of (close - GM) changes:
Define a sign function s_t:
(4) s_t =
+1 if close_t > GM_t
-1 if close_t < GM_t
s_{t-1} if close_t == GM_t (tie-breaker to avoid false flips)
Then define the crossing event indicator:
(5) crossEvent_t = 1 if s_t != s_{t-1}
0 otherwise
Additionally, the indicator plots explicit cross markers:
- Cross Above GM: crossover(close, GM)
- Cross Below GM: crossunder(close, GM)
These provide directional visual cues and match the original Geometric Mean Indicator behavior.
SECTION C — DENSITY MEASURE (CROSSING CLUSTER COUNT)
A Density Zone is based on the number of cross events occurring in the last W bars:
(6) D_t = Σ_{i=0..W-1} crossEvent_{t-i}
This is a “crossing density” score: how many times price has toggled across GM recently.
The script implements this efficiently using a cumulative sum identity:
Let x_t = crossEvent_t.
(7) cumX_t = Σ_{j=0..t} x_j
Then:
(8) D_t = cumX_t - cumX_{t-W} (for t >= W)
cumX_t (for t < W)
SECTION D — DENSITY ZONE TRIGGER
We define a Density Zone state:
(9) isDZ_t = ( D_t >= θ )
where:
- θ (theta) is the user-selected crossing threshold.
Zone edges:
(10) dzStart_t = isDZ_t AND NOT isDZ_{t-1}
(11) dzEnd_t = NOT isDZ_t AND isDZ_{t-1}
SECTION E — DENSITY ZONE BOUNDS
While inside a Density Zone, we track the running high/low to display zone bounds:
(12) dzHi_t = max(dzHi_{t-1}, high_t) if isDZ_t
(13) dzLo_t = min(dzLo_{t-1}, low_t) if isDZ_t
On dzStart:
(14) dzHi_t := high_t
(15) dzLo_t := low_t
Outside zones, bounds are reset to NA.
These bounds visually bracket the “singularity span” (the churn envelope) during each density episode.
SECTION F — QHO EQUILIBRIUM (REGRESSION CENTERLINE)
Define the regression equilibrium (LSR):
(16) m_t = linreg(close_t, L, 0)
This is the “centerline” the QHO system uses as equilibrium.
SECTION G — RESIDUAL AND σ (FIELD WIDTH)
Residual:
(17) r_t = close_t - m_t
Rolling standard deviation of residuals:
(18) σ_t = stdev(r_t, L)
This σ_t is the local volatility/width of the residual field around the regression equilibrium.
SECTION H — NORMALIZED DISPLACEMENT AND SPIN FLIP
Define the standardized displacement:
(19) Y_t = (close_t - m_t) / σ_t
(If σ_t = 0, the script safely treats Y_t = 0.)
Spin Flip trigger uses a user threshold κ:
(20) spinFlip_t = ( |Y_t| > κ )
Directional spin flips:
(21) spinUp_t = ( Y_t > +κ )
(22) spinDn_t = ( Y_t < -κ )
The default κ=3.0 corresponds to “3σ excursions,” which are statistically extreme under a normal residual assumption (even though real markets are not perfectly normal).
SECTION I — QHO BANDS (OPTIONAL VISUALIZATION)
The indicator optionally draws the standard σ-bands around the regression equilibrium:
(23) 1σ bands: m_t ± 1·σ_t
(24) 2σ bands: m_t ± 2·σ_t
(25) 3σ bands: m_t ± 3·σ_t
These provide immediate context for the Spin Flip events.
WHAT YOU SEE ON THE CHART
1) MA1 / MA2 / GM lines (optional)
- MA1 (blue), MA2 (red), GM (green).
- GM is the equilibrium anchor for Density Zones and cross markers.
2) GM Cross Markers (optional)
- “GM↑” label markers appear on bars where close crosses above GM.
- “GM↓” label markers appear on bars where close crosses below GM.
3) Density Zone Shading (optional)
- Background shading appears while isDZ_t = true.
- This is the period where the crossing density D_t is above θ.
4) Density Zone High/Low Bounds (optional)
- Two lines (dzHi / dzLo) are drawn only while in-zone.
- These bounds bracket the full churn envelope during the density episode.
5) QHO Bands (optional)
- 1σ, 2σ, 3σ shaded zones around regression equilibrium.
- These visualize the current variance field.
6) Regression Equilibrium (LSR Centerline)
- The white centerline is the regression equilibrium m_t.
7) Spin Flip Markers
- A circle is plotted when |Y_t| > κ (beyond your chosen σ-threshold).
- Marker size is user-controlled (tiny → huge).
HOW TO USE IT
Step 1 — Pick the equilibrium anchor (GM)
- L1 and L2 define MA1 and MA2.
- GM = sqrt(MA1 * MA2) becomes your equilibrium boundary.
Typical choices:
- Faster equilibrium: L1=20, L2=50 (default-like).
- Slower equilibrium: L1=50, L2=200 (macro anchor).
Interpretation:
- GM acts like a “center of mass” between two moving averages.
- Crosses show when price flips from one side of equilibrium to the other.
Step 2 — Tune Density Zones (W and θ)
- W controls the time window measured (how far back you count crossings).
- θ controls how many crossings qualify as a “density/singularity episode.”
Guideline:
- Larger W = slower, broader density detection.
- Higher θ = only the most intense churn is labeled as a Density Zone.
Interpretation:
- A Density Zone is not “bullish” or “bearish” by itself.
- It is a condition: repeated equilibrium toggling (high churn / high compression).
- These often precede expansions, but direction is not implied by the zone alone.
Step 3 — Tune the QHO spin flip sensitivity (L and κ)
- L controls regression memory and σ estimation length.
- κ controls how extreme the displacement must be to trigger a spin flip.
Guideline:
- Smaller L = more reactive centerline and σ.
- Larger L = smoother, slower “field” definition.
- κ=3.0 = strong extreme filter.
- κ=2.0 = more frequent flips.
Interpretation:
- Spin flips mark when price exits the “normal” residual field.
- In your model language: a moment of decoherence/expansion that is statistically extreme relative to recent equilibrium.
Step 4 — Read the combined behavior (your key thesis)
A) Density Zone forms (GM churn clusters):
- Market repeatedly crosses equilibrium (GM), compressing into a bounded churn envelope.
- dzHi/dzLo show the envelope range.
B) Expansion occurs:
- Price can release away from the density envelope (up or down).
- If it expands far enough relative to regression equilibrium, a Spin Flip triggers (|Y| > κ).
C) Re-coherence:
- After a spin flip, price often returns toward equilibrium structures:
- toward the regression centerline m_t
- and/or back toward the density envelope (dzHi/dzLo) depending on regime behavior.
- The indicator does not guarantee return, but it highlights the condition where return-to-field is statistically likely in many regimes.
IMPORTANT NOTES / DISCLAIMERS
- This indicator is an analytical overlay. It does not provide financial advice.
- Density Zones are condition states derived from GM crossing frequency; they do not predict direction.
- Spin Flips are statistical excursions based on regression residuals and rolling σ; markets have fat tails and non-stationarity, so σ-based thresholds are contextual, not absolute.
- All parameters (L1, L2, W, θ, L, κ) should be tuned per asset, timeframe, and volatility regime.
PARAMETER SUMMARY
Geometric Mean / Density Zones:
- L1: MA1 length
- L2: MA2 length
- GM_t = sqrt(SMA(L1)*SMA(L2))
- W: crossing-count lookback window
- θ: crossing density threshold
- D_t = Σ crossEvent_{t-i} over W
- isDZ_t = (D_t >= θ)
- dzHi/dzLo track envelope bounds while isDZ is true
QHO / Spin Flips:
- L: regression + residual σ length
- m_t = linreg(close, L, 0)
- r_t = close_t - m_t
- σ_t = stdev(r_t, L)
- Y_t = r_t / σ_t
- spinFlip_t = (|Y_t| > κ)
Visual Controls:
- toggles for GM lines, cross markers, zone shading, bounds, QHO bands
- marker size options for GM crosses and spin flips
ALERTS INCLUDED
- Density Zone START / END
- Spin Flip UP / DOWN
- Cross Above GM / Cross Below GM
SUMMARY
This indicator treats the Geometric Mean as an equilibrium boundary and identifies “Density Zones” when price repeatedly crosses that equilibrium within a rolling window, forming a bounded churn envelope (dzHi/dzLo). It also models a regression-based equilibrium field and triggers “Spin Flips” when price makes statistically extreme σ-excursions from that field. Used together, Density Zones highlight compression/decision regions (equilibrium churn), while Spin Flips highlight extreme expansion states (σ-breaches), allowing the user to visualize how price compresses around equilibrium, releases outward, and often re-stabilizes around equilibrium structures over time.
Impulse %Impulse % — Liquidation Cascade Detector (BTC · 1H)
Impulse % identifies sharp impulsive price moves and liquidation cascades by measuring how much a candle’s range deviates from its historical average in percent.
How it works
Calculates the candle range (in %) relative to price and compares it to the average over N periods.
When the range exceeds the upper band, an Impulse is detected.
Inside each 1H candle, the indicator checks lower timeframes (1m / 5m) to classify the impulse phases:
PANIC — the first minutes of a violent move (forced liquidations, stop hunts).
CAUTION (Cascade) — continuation and “cleanup” phase with elevated risk.
Determines whether the impulse is against the trend using EMA 50 / EMA 200 — the most dangerous scenario.
Highlights risk zones to protect positions and filter new entries.
What it’s for
Avoid entering during liquidation cascades.
Exit at break-even or partially take profit during risky phases.
Recommended Settings — BTC (1H)
Calculation
Calculation TF: (empty = current)
Average Mode: By N bars
N (bars): 100
Range Type: High–Low
Bands
Upper Band (% of average): 130
Lower Band: Auto (same %)
Cascade (First Minutes)
Enable Cascade Filter: ON
When to trigger safety: Only against trend
PANIC (minutes): 3
CAUTION (minutes after PANIC): 15
Trend (EMA)
Use EMA Trend: ON
Fast EMA: 50
Slow EMA: 200
Lower TF Detection
Lower TF: 1m (or 5m if you prefer smoother signals)
Visualization
Style: Columns
Show Bands: ON
Show Band Lines & Mean: ON
How to read it (BTC · 1H)
Purple (PANIC): first minutes of liquidation — do not enter.
Yellow (CAUTION): cascade phase — high risk, manage/exit.
Normal color: no active cascade — strategy allowed.
Best practice:
1m/5m → real-time cascade detection
1H → decision level
4H → market context

Al Brooks - EMA20Instead of simply fetching data from the 60-minute or 15-minute charts, this script mathematically simulates the internal logic of those EMAs directly on your current timeframe.
Just for fun.

Opening Range Breakout with VWAP & RSI ConfirmationThis indicator identifies breakout trading opportunities based on the Opening Range Breakout (ORB) strategy combined with intraday VWAP and higher timeframe RSI confirmation.
Opening Range: Calculates the high, low, and midpoint of the first 15 or 30 minutes (configurable) after your specified market open time.
Intraday VWAP: A volume-weighted average price calculated manually and reset daily, tracking price action throughout the trading day.
RSI Confirmation: Uses RSI from a user-selected higher timeframe (1H, 4H, or Daily) to confirm signals.
Buy Signal: Triggered when VWAP breaks above the Opening Range High AND the RSI is below or equal to the buy threshold (default 30).
Sell Signal: Triggered when VWAP breaks below the Opening Range Low AND the RSI is above or equal to the sell threshold (default 70).
Visuals: Plots Opening Range levels and VWAP on the chart with clear buy/sell markers and optional labels showing RSI values.
Alerts: Provides alert conditions for buy and sell signals to facilitate timely trading decisions.
This tool helps traders capture momentum breakouts while filtering trades based on momentum strength indicated by RSI.

DeltaPulseDeltaPulse: Professional Cumulative Volume Delta Indicator
DeltaPulse is a free cumulative volume delta (CVD) indicator engineered for modern traders who demand precision, adaptability, and visual clarity. Unlike traditional CVD tools that often suffer from scaling issues, excessive noise, or poor responsiveness across timeframes, DeltaPulse delivers a streamlined, professional-grade solution that "just works" – providing actionable insights into buying and selling pressure with minimal setup.
This indicator accumulates the net difference between buying and selling volume (inferred from candle direction), normalizes it intelligently for consistent readability, and applies advanced smoothing to filter out market noise while preserving momentum signals. The result is a clean, momentum-colored line in a dedicated pane, enhanced by subtle visual cues that highlight key market dynamics.
Whether you're a day trader scalping intraday moves, a swing trader analyzing weekly trends, or an institutional analyst reviewing futures contracts, DeltaPulse adapts seamlessly to your workflow. It's designed to be your go-to tool for confirming trends, spotting divergences, and identifying order flow imbalances – all without the bloat of overcomplicated features.
Key Features
Intelligent Normalization for Universal Compatibility
Automatically adjusts scaling based on chart timeframe and symbol volume profile.
Intraday (1-5 min): Uses a 100-period volume average for responsive, lively signals.
Intraday (15+ min): 50-period average for balanced sensitivity.
Daily/Weekly+: 20-period average for clean, long-term perspective.
Ensures the indicator remains visually meaningful and non-flat on any asset – from low-volume penny stocks to high-liquidity indices like ES or NQ.
Advanced Smoothing Options
Six moving averages to match your trading style:
EMA - Quick reactions to recent delta shifts
SMA - Simple Moving Average - Stable, noise-resistant baseline
WMA - Weighted Moving Average - Emphasizes recent data with linear weighting
HMA - Hull Moving Average - Ultra-smooth yet lag-free – ideal for momentum trading
RMA - Running Moving Average (Wilder's) - Trend-following with minimal whipsaws
VWMA - Volume-Weighted Moving Average - Highlights high-volume delta moves
Lower values increase reactivity; higher values enhance smoothness.
Flexible Reset Mechanisms
Session Reset: Clears CVD at the first regular trading bar each day – perfect for intraday analysis.
Weekly Reset: Resets at the start of each new week – suited for swing and position trading.
No manual intervention required; the indicator handles resets reliably across all timeframes.
Background Shading:
Light green tint above zero; light red below.
Extreme highlights when smoothed CVD exceeds 90% of its 80-bar high/low – flags potential exhaustion or absorption zones.
How It Works
DeltaPulse calculates a simple yet effective volume delta on each bar:
Bullish Bar (close ≥ open): Adds full volume as positive delta.
Bearish Bar (close < open): Subtracts full volume as negative delta.
This raw delta accumulates into a running total (CVD), resetting based on your chosen mode. The total is then:
Normalized against a timeframe-adaptive volume average to ensure consistent scaling.
Smoothed using your selected MA type for noise reduction and trend clarity.
Plotted with momentum-based coloring and visual enhancements.
The output is a single, intuitive line that reveals the underlying battle between buyers and sellers – far more reliably than raw volume bars or basic oscillators.
Trading Applications
DeltaPulse shines in revealing order flow dynamics that price action alone often conceals. Here are proven ways to integrate it:
Trend Confirmation & Momentum Trading
Bullish Setup: Rising green line above zero confirms buyer control – enter longs on pullbacks to support.
Bearish Setup: Falling red line below zero signals seller dominance – short on rallies to resistance.
Zero Line Crosses as Reversal Signals
A crossover from negative to positive territory often marks a sentiment shift – use for entry triggers.
Combine with volume spikes or key levels for high-probability setups.
Enhancement: VWMA mode amplifies signals on high-volume breakouts.
Absorption & Exhaustion Zones
Watch for extreme background highlights: A spike to highs followed by reversal suggests large players absorbing supply.
Ideal for fade trades near overextended levels (e.g., after news events).
Avoid low-volume or illiquid symbols, as delta inference relies on reliable candle data.
Timeframe-Agnostic: Solves the common CVD pitfall of being "dead" on intraday charts or erratic on daily ones through smart, automatic normalization.
Lag-Free Responsiveness: The default HMA smoothing strikes a rare balance – smoother than EMA, faster than SMA – without the computational overhead of exotic filters.
Zero Clutter: No histograms, no extraneous plots, no overwhelming alerts. Just pure, distilled order flow intelligence.

Sinals 15m - RSI 7 e 9This strategy is designed to capture continuation moves on the 15-minute chart by combining trend filters, momentum indicators, and strong-candle confirmation. The core idea is to enter trades shortly after EMA crossovers that signal direction, as long as momentum and candle strength support the move.

MACD-V Multi-Timeframe Confluence DashboardThis indicator identifies high-probability trade entries by analyzing momentum alignment across multiple timeframes using the MACD-V (Volatility Normalized MACD) formula. It features a fully customizable signal engine that allows traders to specify exactly which timeframes must agree before a trade signal is generated.
Optimized Defaults
By default, the indicator is tuned to the 5-minute, 15-minute, and 1-hour timeframes. We have found this specific combination performs best for identifying robust trends while filtering out noise. However, the strategy is fully flexible—users can easily adjust these settings to fit scalping (1m/5m) or swing trading (4H/Daily) styles.
Indicator Features
Dynamic Confluence: A Buy or Sell signal (displayed as a large + on the chart) is generated only when all selected timeframes are in agreement. This ensures you are trading with the dominant trend across multiple time scales.
Alternating Signal Filter: To prevent repetitive alerts during strong trends, the script uses a smart filter: a new Buy signal will only trigger if the last confirmed signal was a Sell (and vice versa).
Live Dashboard: An on-screen table displays the real-time status of every timeframe (Trend, Curl, and MACD Value). Timeframes currently active in your strategy are highlighted in yellow.
Local Entry Arrows (Optional): The script includes smaller red/green arrows that indicate simple MACD line crosses on the current chart's timeframe. These can be useful for precise timing but can be noisy in choppy markets. These are turned off by default to keep the chart clean, but can be enabled in the "Visuals" settings if you require granular entry signals.
How to Use
Check the Dashboard: Look for the yellow-highlighted rows in the table to see which timeframes are currently driving your signals.
Wait for the Cross (+): A green + indicates bullish momentum is aligned across all your chosen timeframes.
Refine (Optional): Turn on "Show Local Arrows" if you want to see the specific moment the MACD crosses on your current timeframe to fine-tune your entry.

True vs False Breakout (Vol + Body Shape) **Indicator Description: True vs. False Breakout Detector**
This indicator helps identify the quality of a breakout by analyzing price action and volume.
**★ Green Arrow: "True Breakout (Strong Candle)"**
This represents a high-confidence breakout signal.
* **Criteria:** Price Breakout + Volume Surge + Strong Candle Close (minimal to no upper wick).
* **Significance:** Indicates strong bullish momentum.
**● Grey Dot: "Weak Breakout"**
Appears when price breaks resistance but shows signs of weakness.
* **Criteria:** Breakout with low volume OR a long upper wick (rejection).
* **Meaning:** "Price made a new high, but the move is untrustworthy."
* **Action:** Do not chase the long position. Be cautious and look for potential reversals.
**▼ Red Label: "False Breakout (Reversal)"**
* **Signal:** Appears when a Weak Breakout (Grey Dot) is followed by bearish price action.
* **Action:** This indicates a confirmed False Breakout and presents a prime shorting opportunity.
-------------------------------------------------------------------------------------------
★指标描述:真假突破辨别。
★绿色箭头 "真突破 (强K线)":
这是你要的完美信号。
它意味着:价格破位 + 成交量放大 + K线收盘坚决(几乎没有上影线)。
对应刚才的行情: 刚才那根1H大阳线应该会触发这个信号。
灰色圆点 "弱势突破" (新增):
如果价格突破了阻力,但是没量,或者留了长上影线(像你之前描述的那几根15分钟线),指标会标记灰色圆点。
含义: “虽然价格破了新高,但我不信任它”。这时候千万不要追多,反而要准备做空。
红色标签 "假突破 (反转)":
当灰色圆点(弱势突破)出现后,紧接着出现红色标签,就是绝佳的做空点。
