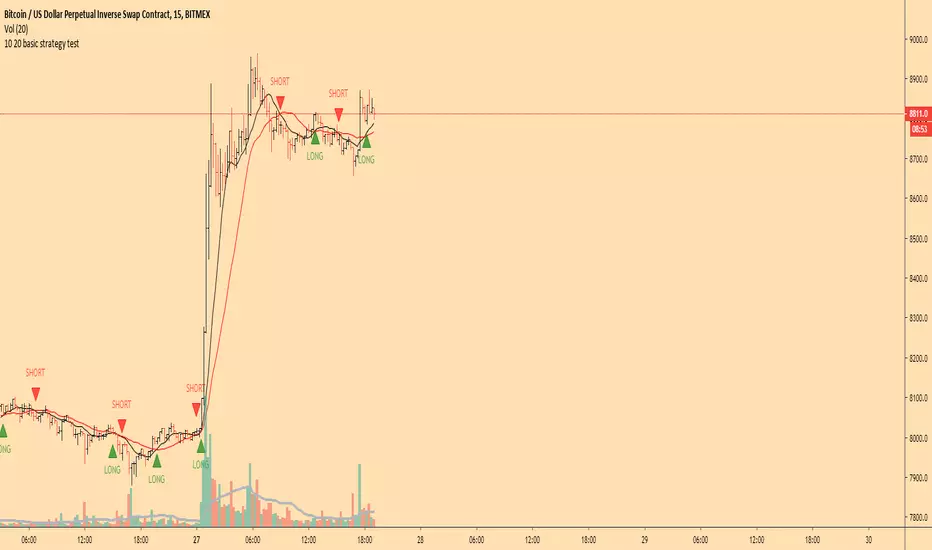
Guppy MMA 3, 5, 8, 10, 12, 15 and 30, 35, 40, 45, 50, 60Guppy Multiple Moving Average
Short Term EMA 3, 5, 8, 10, 12, 15
Long Term EMA 30, 35, 40, 45, 50, 60
Use for SFTS Class
Pesquisar nos scripts por "德国10年期国债"


10-2 Year Treasury Yield Spread by zdmreLong-term bond yield reflects inflation. Short-term bond yields are tools used to predict Fed's interest rate policy. Spread between the two represents four cycles of an economy.
1. Growth
Short-term yield rises as interest rates rise. Spread narrows.
2. Slow growth
Central bank raises interest rates faster and short-term yield exceeds long-term yield. Spread turns negative.
3. Recession
High interest rates lead to more defaults. Inflation caps consumption. Central bank lowers interest rate to stimulate the economy and short-term yield falls. Spread widens.
4. Recovery
Central bank continues easing. Spread remains wide and yield curve remains steep.
0 = Recession Risk
2.6 = Recovery Plan
DYOR


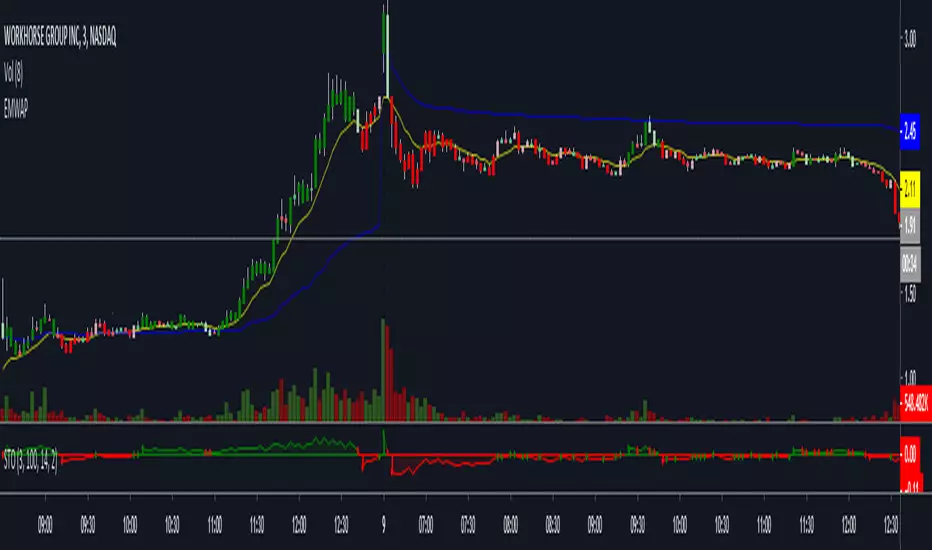
6 Figures Scalping 2x MACD10-11-2019
This script plots a double MACD in a new indicator pane
The default settings:
Pink = STD MACD , settings 12-26-9
Green - Fast MACD, settings 5-15-1
The MACD settings can be changed in the indicators setting window

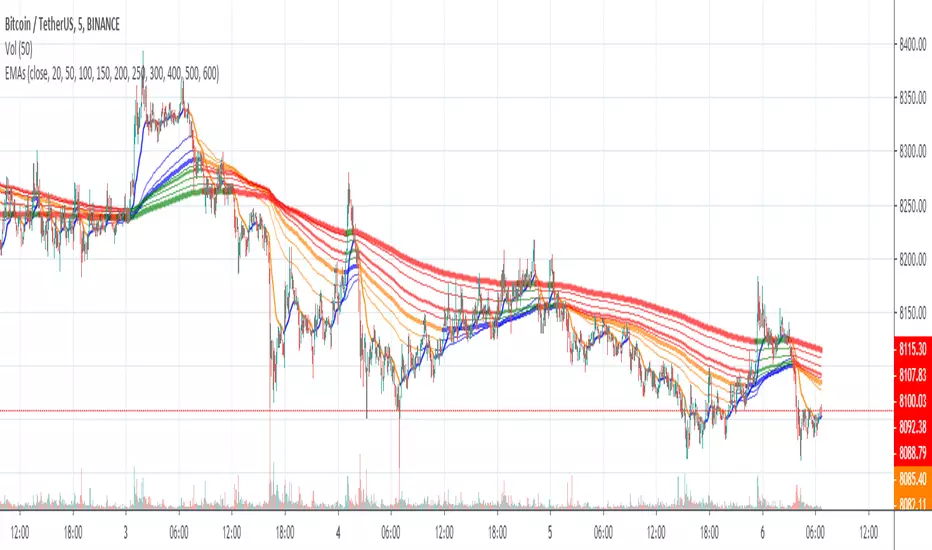
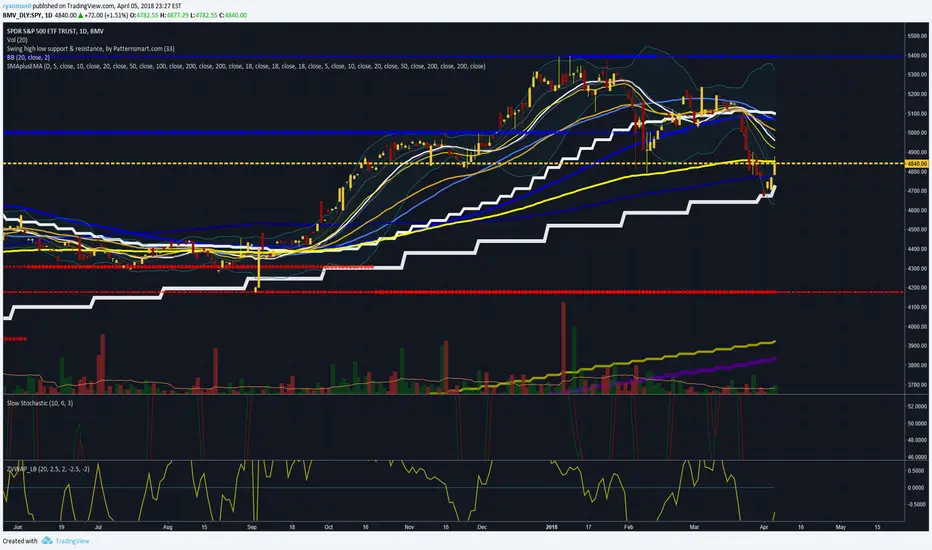
10/20/50/100/200 SMA'sMultiple MA's to get a good feel for momentum and interim supports and resistances


Moving Average x10 (SMA, EMA)10 configurable Simple and Exponential moving averages combined in one indicator

SMA RIBBON10 SMA's arranged in a ribbon. Color coded depending on price close. Free to use, open source. As seen in some charts.


10Y Bond Yield Spread (beta)10-Year Bond Yield Spread using Quandl data
See also:
- seekingalpha.com
- www.babypips.com
- www.forexfactory.com

10 Simple & 6 Exponential Moving Averages (w/ 18 day,week,month)* This is for the trader who wants tons of moving averages on their chart from one indicator
* Using the options, you should be able ot turn off some of them if the screen is too noisy for you
* You should also be able to change colors and thickness of the bars
* The thicker bars are for longer term averages
* This version is similar to my other script except it adds the 18 day, 18 week, and 18 Month SMa
* I added them after watching ira Epstein's YouTube videos
* Let me know if there are any bugs or things that need to be change

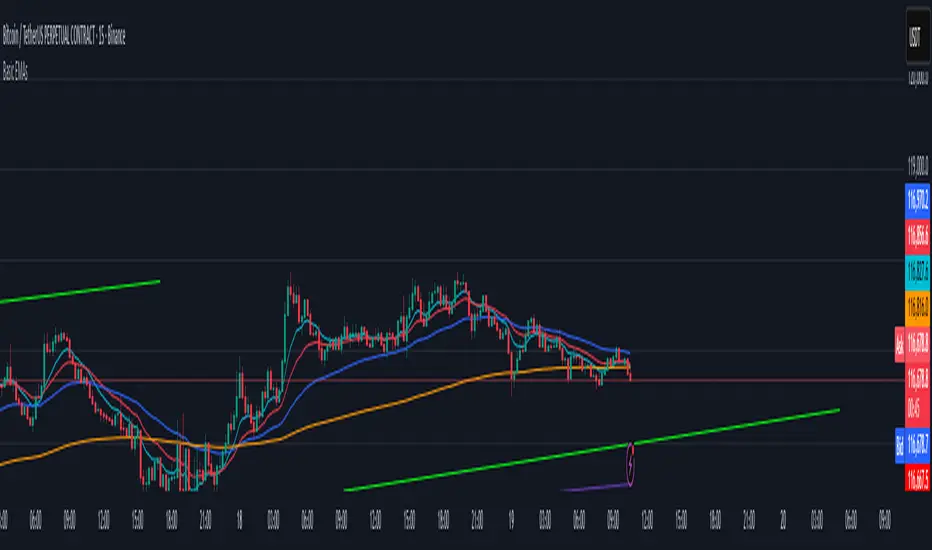
Double Top/Bottom Screener - Clean Today Only v5 //@version=6
indicator("Double Top/Bottom Screener - Clean Today Only", overlay=true, max_lines_count=100)
// Inputs
leftBars = input.int(5, "Left Bars", minval=3, maxval=10)
rightBars = input.int(5, "Right Bars", minval=3, maxval=10)
tolerance = input.float(0.02, "Max Difference (e.g., 0.02 for 2 cents)", step=0.01)
atrLength = input.int(14, "ATR Length for Normalized Distance", minval=1)
requiredPeaks = input.int(3, "Required Identical Peaks", minval=2, maxval=5)
// Arrays to store today's swing levels only
var array todaySwingLevels = array.new(0)
var array swingCounts = array.new(0)
var array swingLines = array.new(0)
var array isResistance = array.new(0)
var array swingBars = array.new(0)
var bool hasDoubleTop = false
var bool hasDoubleBottom = false
var float doubleTopLevel = na
var float doubleBottomLevel = na
var float nearestDoubleLevel = na
var int currentDay = na
// Detect significant swings only
swingHigh = ta.pivothigh(high, leftBars, rightBars)
swingLow = ta.pivotlow(low, leftBars, rightBars)
// Track current day
currentDay := dayofmonth
isNewDay = currentDay != currentDay
// Clear everything on new day
if barstate.isfirst or isNewDay
// Delete all existing lines
if array.size(swingLines) > 0
for i = array.size(swingLines) - 1 to 0
line.delete(array.get(swingLines, i))
// Clear all arrays
array.clear(todaySwingLevels)
array.clear(swingCounts)
array.clear(swingLines)
array.clear(isResistance)
array.clear(swingBars)
// Reset flags
hasDoubleTop := false
hasDoubleBottom := false
doubleTopLevel := na
doubleBottomLevel := na
nearestDoubleLevel := na
// Function to find matching level within today's swings only
findMatchingLevel(newLevel, isHigh) =>
matchIndex = -1
if array.size(todaySwingLevels) > 0
for i = 0 to array.size(todaySwingLevels) - 1
existingLevel = array.get(todaySwingLevels, i)
existingIsResistance = array.get(isResistance, i)
if math.abs(newLevel - existingLevel) <= tolerance and existingIsResistance == isHigh
matchIndex := i
break
matchIndex
// Process swing highs (resistance levels) - today only
if not na(swingHigh)
matchIndex = findMatchingLevel(swingHigh, true)
if matchIndex >= 0
// Found matching resistance level
newCount = array.get(swingCounts, matchIndex) + 1
array.set(swingCounts, matchIndex, newCount)
// Delete old line and create new one with appropriate color
line.delete(array.get(swingLines, matchIndex))
lineColor = newCount >= requiredPeaks ? color.yellow : color.red
// Start line from the original swing bar, not current bar
originalBar = array.get(swingBars, matchIndex)
newLine = line.new(originalBar, swingHigh, bar_index + 20, swingHigh,
color=lineColor, width=2, extend=extend.right)
array.set(swingLines, matchIndex, newLine)
// Update pattern detection
if newCount >= requiredPeaks
hasDoubleTop := true
doubleTopLevel := swingHigh
else
// New resistance level - add to today's levels
array.push(todaySwingLevels, swingHigh)
array.push(swingCounts, 1)
array.push(isResistance, true)
array.push(swingBars, bar_index)
// Create red horizontal line starting from swing bar
newLine = line.new(bar_index, swingHigh, bar_index + 20, swingHigh,
color=color.red, width=2, extend=extend.right)
array.push(swingLines, newLine)
// Process swing lows (support levels) - today only
if not na(swingLow)
matchIndex = findMatchingLevel(swingLow, false)
if matchIndex >= 0
// Found matching support level
newCount = array.get(swingCounts, matchIndex) + 1
array.set(swingCounts, matchIndex, newCount)
// Delete old line and create new one with appropriate color
line.delete(array.get(swingLines, matchIndex))
lineColor = newCount >= requiredPeaks ? color.yellow : color.green
// Start line from the original swing bar, not current bar
originalBar = array.get(swingBars, matchIndex)
newLine = line.new(originalBar, swingLow, bar_index + 20, swingLow,
color=lineColor, width=2, extend=extend.right)
array.set(swingLines, matchIndex, newLine)
// Update pattern detection
if newCount >= requiredPeaks
hasDoubleBottom := true
doubleBottomLevel := swingLow
else
// New support level - add to today's levels
array.push(todaySwingLevels, swingLow)
array.push(swingCounts, 1)
array.push(isResistance, false)
array.push(swingBars, bar_index)
// Create green horizontal line starting from swing bar
newLine = line.new(bar_index, swingLow, bar_index + 20, swingLow,
color=color.green, width=2, extend=extend.right)
array.push(swingLines, newLine)
// Remove broken levels immediately (strict enforcement)
if array.size(todaySwingLevels) > 0
for i = array.size(todaySwingLevels) - 1 to 0
level = array.get(todaySwingLevels, i)
isRes = array.get(isResistance, i)
// Check if level is broken (even slightly)
levelBroken = isRes ? close > level : close < level
if levelBroken
// Delete line and remove from arrays
line.delete(array.get(swingLines, i))
array.remove(swingLines, i)
array.remove(todaySwingLevels, i)
array.remove(swingCounts, i)
array.remove(isResistance, i)
array.remove(swingBars, i)
// Reset pattern flags if broken level was part of pattern
if level == doubleTopLevel
hasDoubleTop := false
doubleTopLevel := na
if level == doubleBottomLevel
hasDoubleBottom := false
doubleBottomLevel := na
// Calculate pattern signal
patternSignal = (hasDoubleTop or hasDoubleBottom) ? 1 : 0
// Find nearest double level (only from unbroken levels)
if patternSignal == 1
if hasDoubleTop and not na(doubleTopLevel)
nearestDoubleLevel := doubleTopLevel
if hasDoubleBottom and not na(doubleBottomLevel)
if na(nearestDoubleLevel)
nearestDoubleLevel := doubleBottomLevel
else
nearestDoubleLevel := math.abs(close - doubleBottomLevel) < math.abs(close - nearestDoubleLevel) ? doubleBottomLevel : nearestDoubleLevel
else
nearestDoubleLevel := na
// Distance calculation
atr = ta.atr(atrLength)
distanceNormalizedATR = not na(nearestDoubleLevel) and not na(atr) and atr > 0 ? math.abs(close - nearestDoubleLevel) / atr : na
// Outputs (minimal plotting)
plot(patternSignal, title="Pattern Signal", color=patternSignal == 1 ? color.purple : na, style=plot.style_circles)
plot(nearestDoubleLevel, title="Nearest Double Level Price", color=color.orange)
plot(distanceNormalizedATR, title="Normalized Distance (ATR)", color=color.blue)
// Background highlight for pattern
bgcolor(patternSignal == 1 ? color.new(color.purple, 80) : na)
// Alert for pattern detection
if patternSignal == 1 and barstate.isconfirmed
alert("Double Pattern detected on " + syminfo.ticker + " at " + str.tostring(close), alert.freq_once_per_bar_close)
// Clean information table
if barstate.islast
var table infoTable = table.new(position.top_right, 2, 4, bgcolor=color.new(color.black, 70))
table.cell(infoTable, 0, 0, "Pattern:", bgcolor=color.new(color.gray, 50), text_color=color.white)
table.cell(infoTable, 1, 0, str.tostring(patternSignal), bgcolor=patternSignal == 1 ? color.new(color.purple, 50) : color.new(color.gray, 50), text_color=color.white)
table.cell(infoTable, 0, 1, "Level:", bgcolor=color.new(color.gray, 50), text_color=color.white)
table.cell(infoTable, 1, 1, str.tostring(nearestDoubleLevel, "#.####"), bgcolor=color.new(color.orange, 50), text_color=color.white)
table.cell(infoTable, 0, 2, "Unbroken Swings:", bgcolor=color.new(color.gray, 50), text_color=color.white)
table.cell(infoTable, 1, 2, str.tostring(array.size(todaySwingLevels)), bgcolor=color.new(color.gray, 50), text_color=color.white)
// Count double levels
doubleCount = 0
if array.size(swingCounts) > 0
for i = 0 to array.size(swingCounts) - 1
if array.get(swingCounts, i) >= requiredPeaks
doubleCount += 1
table.cell(infoTable, 0, 3, "Double Levels:", bgcolor=color.new(color.gray, 50), text_color=color.white)
table.cell(infoTable, 1, 3, str.tostring(doubleCount), bgcolor=color.new(color.yellow, 50), text_color=color.black)

Double Top/Bottom Screener - Today Only V4//@version=6
indicator("Double Top/Bottom Screener - Today Only", overlay=true, max_lines_count=500)
// Inputs
leftBars = input.int(5, "Left Bars")
rightBars = input.int(5, "Right Bars")
tolerance = input.float(0.02, "Max Difference (e.g., 0.02 for 2 cents)", step=0.01)
atrLength = input.int(14, "ATR Length for Normalized Distance", minval=1)
requiredPeaks = input.int(3, "Required Identical Peaks", minval=2, maxval=5)
// Declarations of persistent variables and arrays
var array resistanceLevels = array.new(0)
var array resistanceCounts = array.new(0)
var array supportLevels = array.new(0)
var array supportCounts = array.new(0)
var array resLines = array.new(0)
var array supLines = array.new(0)
var bool hasDoubleTop = false
var bool hasDoubleBottom = false
var float doubleTopLevel = na
var float doubleBottomLevel = na
var int todayStart = na
var float nearestDoubleLevel = na // Explicitly declared as na by default
// Step 1: Identify Swing Highs/Lows
swingHigh = ta.pivothigh(high, leftBars, rightBars)
swingLow = ta.pivotlow(low, leftBars, rightBars)
// Today's premarket start (04:00 AM ET)
todayStart := timestamp(syminfo.timezone, year, month, dayofmonth, 4, 0, 0)
// Clear arrays and delete lines on the first bar or new day
if barstate.isfirst or (dayofmonth != dayofmonth and time >= todayStart)
// Delete all existing lines only if arrays are not empty
if array.size(resLines) > 0
for i = array.size(resLines) - 1 to 0
line.delete(array.get(resLines, i))
if array.size(supLines) > 0
for i = array.size(supLines) - 1 to 0
line.delete(array.get(supLines, i))
// Clear arrays
array.clear(resistanceLevels)
array.clear(supportLevels)
array.clear(resistanceCounts)
array.clear(supportCounts)
array.clear(resLines)
array.clear(supLines)
// Reset flags and levels
hasDoubleTop := false
hasDoubleBottom := false
doubleTopLevel := na
doubleBottomLevel := na
nearestDoubleLevel := na // Ensure reset on new day
// Add new swings only if today and after premarket
if not na(swingHigh) and time >= todayStart and dayofmonth == dayofmonth
bool isEqualHigh = false
int peakIndex = -1
float prevLevel = na
if array.size(resistanceLevels) > 0
for i = 0 to array.size(resistanceLevels) - 1
prevLevel := array.get(resistanceLevels, i)
if math.abs(swingHigh - prevLevel) <= tolerance
isEqualHigh := true
peakIndex := i
break
if isEqualHigh and peakIndex >= 0
array.set(resistanceCounts, peakIndex, array.get(resistanceCounts, peakIndex) + 1)
if array.get(resistanceCounts, peakIndex) == requiredPeaks
hasDoubleTop := true
doubleTopLevel := prevLevel
else
array.push(resistanceLevels, swingHigh)
array.push(resistanceCounts, 1)
line newResLine = line.new(bar_index - rightBars, swingHigh, bar_index, swingHigh, color=color.red, width=2, extend=extend.none)
array.push(resLines, newResLine)
if not na(swingLow) and time >= todayStart and dayofmonth == dayofmonth
bool isEqualLow = false
int peakIndex = -1
float prevLevel = na
if array.size(supportLevels) > 0
for i = 0 to array.size(supportLevels) - 1
prevLevel := array.get(supportLevels, i)
if math.abs(swingLow - prevLevel) <= tolerance
isEqualLow := true
peakIndex := i
break
if isEqualLow and peakIndex >= 0
array.set(supportCounts, peakIndex, array.get(supportCounts, peakIndex) + 1)
if array.get(supportCounts, peakIndex) == requiredPeaks
hasDoubleBottom := true
doubleBottomLevel := prevLevel
else
array.push(supportLevels, swingLow)
array.push(supportCounts, 1)
line newSupLine = line.new(bar_index - rightBars, swingLow, bar_index, swingLow, color=color.green, width=2, extend=extend.none)
array.push(supLines, newSupLine)
// Monitor and remove broken levels/lines; reset pattern if the equal level breaks
if array.size(resistanceLevels) > 0
for i = array.size(resistanceLevels) - 1 to 0
float level = array.get(resistanceLevels, i)
if close > level
line.delete(array.get(resLines, i))
array.remove(resLines, i)
array.remove(resistanceLevels, i)
array.remove(resistanceCounts, i)
if level == doubleTopLevel
hasDoubleTop := false
doubleTopLevel := na
nearestDoubleLevel := na // Reset if level breaks
if array.size(supportLevels) > 0
for i = array.size(supportLevels) - 1 to 0
float level = array.get(supportLevels, i)
if close < level
line.delete(array.get(supLines, i))
array.remove(supLines, i)
array.remove(supportLevels, i)
array.remove(supportCounts, i)
if level == doubleBottomLevel
hasDoubleBottom := false
doubleBottomLevel := na
nearestDoubleLevel := na // Reset if level breaks
// Limit arrays (after removals)
if array.size(resistanceLevels) > 10
line oldLine = array.shift(resLines)
line.delete(oldLine)
array.shift(resistanceLevels)
array.shift(resistanceCounts)
if array.size(supportLevels) > 10
line oldLine = array.shift(supLines)
line.delete(oldLine)
array.shift(supportLevels)
array.shift(supportCounts)
// Pattern Signal: 1 only if the exact required number of peaks is met
patternSignal = (hasDoubleTop or hasDoubleBottom) ? 1 : 0
// New: Nearest Double Level Price - Only update if pattern is active today and on current day
if time >= todayStart and dayofmonth == dayofmonth // Restrict to today
if patternSignal == 1 // Only set if pattern is active
if hasDoubleTop and not na(doubleTopLevel)
nearestDoubleLevel := doubleTopLevel
if hasDoubleBottom and not na(doubleBottomLevel)
nearestDoubleLevel := na(nearestDoubleLevel) ? doubleBottomLevel : (math.abs(close - doubleBottomLevel) < math.abs(close - nearestDoubleLevel) ? doubleBottomLevel : nearestDoubleLevel)
else
nearestDoubleLevel := na // Reset to na if no pattern today
else
nearestDoubleLevel := na // Reset for all historical bars
// New: Distance to Nearest Level (using ATR for normalization)
var float atr = ta.atr(atrLength)
var float distanceNormalizedATR = na
if not na(nearestDoubleLevel) and not na(atr) and atr > 0
distanceNormalizedATR := math.abs(close - nearestDoubleLevel) / atr
// Outputs
plot(patternSignal, title="Pattern Signal", color=patternSignal == 1 ? color.purple : na, style=plot.style_circles)
plot(nearestDoubleLevel, title="Nearest Double Level Price", color=color.orange)
plot(distanceNormalizedATR, title="Normalized Distance (ATR)", color=color.green)
bgcolor(patternSignal == 1 ? color.new(color.purple, 80) : na)
if patternSignal == 1 and barstate.isconfirmed
alert("Double Pattern detected on " + syminfo.ticker + " at " + str.tostring(close), alert.freq_once_per_bar_close)
if barstate.islast
var table infoTable = table.new(position.top_right, 1, 3, bgcolor=color.new(color.black, 50))
table.cell(infoTable, 0, 0, "Pattern: " + str.tostring(patternSignal), bgcolor=patternSignal == 1 ? color.purple : color.gray)
table.cell(infoTable, 0, 1, "Level: " + str.tostring(nearestDoubleLevel, "#.##"), bgcolor=color.orange)
table.cell(infoTable, 0, 2, "ATR Dist: " + str.tostring(distanceNormalizedATR, "#.##"), bgcolor=color.green)

Multi-Asset Arbitrage CalculatorMulti-Asset Arbitrage Calculator
📊 Overview
A comprehensive Pine Script indicator designed to identify and monitor arbitrage opportunities across multiple trading pairs in real-time. This tool calculates potential profit percentages from various transaction paths while accounting for trading fees and market inefficiencies.
🎯 Purpose
- Arbitrage Detection : Automatically identifies price discrepancies between related trading pairs
- Multi-Path Analysis : Supports up to 10 simultaneous arbitrage loops with different transaction sequences
- Fee Integration : Incorporates comprehensive fee structures for realistic profit calculations
- Real-Time Monitoring : Provides continuous monitoring with customizable alert thresholds
🚀 Key Features
Flexible Transaction Paths
- Triangular Arbitrage : A→B→C→A patterns for three-asset opportunities
- Direct Pairs : Simple A→B conversions
- Reverse Paths : Inverse transaction sequences
- Custom Routing : Multiple path options for diverse market scenarios
Comprehensive Fee Structure
- Start/End transaction fees
- Deposit/Withdrawal fees
- Inter-asset conversion fees
- Configurable percentage-based calculations
Professional Tools
- Moving Average Smoothing: Reduces noise with configurable MA periods
- Alert System : Individual and combined alert conditions
- Weekend Detection : Visual highlighting for market hours
- Clean Interface : Organized input groups for easy configuration
📋 Supported Transaction Types
1. `A→B→C→A` - Standard triangular arbitrage
2. `B→A→C→A` - Reverse entry triangular
3. `A→B→A→C` - Split conversion path
4. `A→C→B→A` - Alternative triangular route
5. `A→C→A→B` - Modified split path
6. `A→B` - Direct pair conversion
7. `A→B (Inverse)` - Inverse direct conversion
8. `B→A (Inverse)` - Reverse inverse conversion
🛠️ Configuration Options
General Settings
- Alert threshold percentage
- Moving average period
- Enable/disable individual loops
Per Loop Settings
- Transaction path selection
- Three symbol inputs (A, B, C)
- Six fee parameters (Start, Deposit, Step1, Step2, End, Withdraw)
- Individual on/off controls
📈 Use Cases
- Cross-Exchange Arbitrage : Identify price differences between exchanges
- Currency Triangulation : Find inefficiencies in forex/crypto triangular paths
- Fee Analysis : Understand the impact of trading costs on profitability
- Market Research : Study price relationships and correlations
⚙️ Technical Specifications
- Pine Script Version : v6
- Chart Type : Oscillator (overlay=false)
- Data Source : Real-time price feeds via TradingView
- Calculations : Percentage-based profit/loss with fee adjustments
- Alerts : TradingView alert system integration
📊 Visual Elements
- Clean Charts : Plots hidden by default for uncluttered interface
- Weekend Highlighting : Yellow background during market closures
- Color Coding : Distinct colors for each arbitrage loop
- MA Overlay : Optional moving average display
🔧 Installation & Setup
1. Add indicator to TradingView chart
2. Configure desired number of arbitrage loops
3. Set symbol pairs for each active loop
4. Adjust fee parameters based on your broker/exchange
5. Set alert threshold percentage
6. Enable alerts for desired loops
⚠️ Important Notes
- Real-time Data : Requires live market data for accurate calculations
- Fee Accuracy : Ensure fee parameters match your actual trading costs
- Market Hours : Consider exchange operating hours and liquidity
- Risk Management : This is an analysis tool, not investment advice
