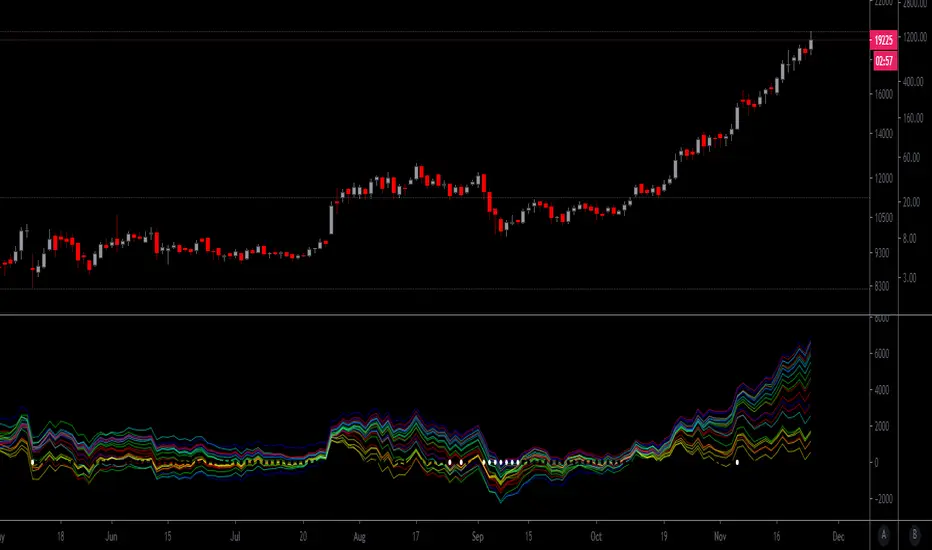
SPY Ninja Oscillator
SPY Ninja Oscillator correlates the true strength index exponential moving averages of SPY (green) and VIX (red) together. In doing so we can determine the start of trend shifts via SPY / VIX convergence in addition to crossover, with potential market entries and exits represented by the vertical green and red bars.
MACD and RSI have been scaled proportionally to the oscillator range ( for rsi: (rsi-50)*. 01 , and for macd: macd /3) and when overlaid and used in conjunction with the market vertical entry and exit signals, potential trend prediction becomes much more apparent.
Pesquisar nos scripts por "同花顺软件+美国+VIX+恐慌指数+行情代码"

Normalized Volatility IndicatorFrom an article by Rajesh Kayakkal:
"Early bear phase signals can help you get out of the market before it turns down. This indicator tells you how.
There are many ways to identify the trend of a financial market, the most common being the 200-day exponential moving average (Ema). When price is trending down below the 200-day Ema, the market is believed to be in a bear phase. If the market is trending up above the 200-day Ema, it is considered to be in a bull phase.
Since every indicator fails at times, I wanted to find other indicators to confirm a trend. In my quest for another indicator to determine the trend for the financial markets, I found the Cboe Volatility Index (Vix) to be a good indicator of the market direction. The Vix is calculated from the weighted average of the implied volatilities of various options on the Standard & Poor’s 500 index futures.
J. Welles Wilder’s average true range can also give an indication of the financial market trends; that is, when the market is in a bull phase, the average true range narrows, and when it is in a bear phase, the average true range expands. The normalized volatility indicator (Nvi) is based on this behavior.
Normalized volatility indicator (Nvi)
Average true range (Atr) varies depending on time. But how do we determine the phase of the financial market with Atr? Perhaps some type of ratio could give us a clue. A ratio presents a relationship of a quantity with respect to another. I did some research based on a ratio of the 64-day average true range and the end-of-day value of equity indexes such as the Standard & Poor’s 500 (Spx). I selected the 64-day period since it is close to the average number of trading days in a quarter. The ratio of the 64-day average true range and closing price does discount seasonal variations in the average true range and gives a single number that can be used to compare volatility of an instrument across many decades. I call this ratio the normalized volatility indicator.
I found an interesting correlation between Nvi and cycles of major equity market indexes. The formula for the Nvi is:
Nvi = 64 - Day average true range/End-of-day price * 100
The NVI gave advanced signals before the cyclical bear phase of SPX commenced in October 2000 and was almost on the spot with the bull phase that began in 2003 and the current secular bear market cycle, which started in November 2007."
Includes options to show inverse NVI and change the ATR length and smoothing.

RSI of VWAP [SHORT selling]This is SHORT selling version of RSIofVWAP strategy. Settings and Logic are totally different from LONG side version , hence I am publishing it as a new strategy.
Settings
============
VWAP of RSI Length 15
Slow EMA Length 200
Short entry level 25
Cover short level 70
stop loss 5
SHORT Entry
============
condition1 : When RSIofVWAP crossdown below 25 and VWAP is below ema200
condition2: When weekly RSIofVWAP crossdown 70 and VWAP (note : session vwap , not weekly vwap) is below ema200
condition3: Use VIX value , if you want to short when the price is above ema200
vwap RSI crossing down 70 and VIX RSI is cossing up 70
enter short ... This is like falling knife :-)
I need to add the code -- later
if any of above condition is TRUE , SHORT entry will be taken
Take Profit
============
When close less than short entry price and RSIofVWAp is crossing up 25 , take profit ...close 1/3 of the position
Exit
============
When RSIofVWAP crossing up 70 level
Stop Loss
============
Stop Loss is set to 5%
Note:
1. When strategy is in SHORT position , background and bar color changes to gray
2. When strategy is already in short position , possible entries are shown in yellow background
3. RSI Length 15 is working most of the equities on hourly chart. ( RSI length 9 and 14 also works good , but not for all ... You may want to try which setting works for your symbol)
4. weekly VWAP (blue color) is also plotted by default ... you can disable it if you dont want to see it. But there is advantage keeping it on the chart , you can notice whenever weekly VWAP crosses above 70 line , trend is UP ... if you have LONG position you can hold on it ... Hurray :-)
Warning
============
For the educational purposes only

Volatility Rainbow [Nic]What is this
The volatility rainbow tracks divergences in a security and its volatility index. This can be used to identify periods of heightened implied (future) risk.
About Volatility
The volatility is calculated by looking at put / call ratios. When VIX goes up it means that puts are outpacing calls. This is a bearish signal.
About Correlation
When the security goes up while the VIX goes up, the divergence on the plot will increase and turn a color. This should be a warning.
Colors
RED - DIA
BLUE - SPX
GREEN - IWM
GOLD - GLD
YELLOW - QQQ
ORANGE - TLT
White- VVIX
Related

Volatility Prism [Nic]What is this
The volatility rainbow tracks divergences in a security and its volatility index. This can be used to identify periods of heightened implied (future) risk.
About Volatility
The volatility is calculated by looking at put / call ratios. When VIX goes up it means that puts are outpacing calls. This is a bearish signal.
About Correlation
When the security goes up while the VIX goes up, the divergence on the plot will increase and turn a color. This should be a warning.
Volatility Rainbow
This is a similar indicator, but this one merges all signals into a single line.

Distance From-22-Moving Averages over CMOODYwilliamsVIXFIXThis script is a mean reversion script where each of the moving averages represent the price and Chris Moody's Williams Vix Fix ZERO line represents the moving averages. There are 4 moving average types included: EMA , SMA , WMA , HMA .
You can set up to your liking by having all of the averages as any or all of the 4 options.
This script is a great way to spot bearish/bullish divergences in price action.
This script is also excellent at indicating periods of price action when volatility is extremely low - all the plots get very tight instead of spread out.
I have copy/pasted a public script by Chris Moody which is the Williams Vix Fix. This indicator shows a white circle as a "top" or "bottom" based on the current price distance off the mean (in simple terms).
Thank you Chris Moody!
Implied Volatility SuiteThis is an updated, more robust, and open source version of my 2 previous scripts : "Implied Volatility Rank & Model-Free IVR" and "IV Rank & IV Percentile".
This specific script provides you with 4 different types of volatility data: 1)Implied volatility, 2) Implied Volatility Rank, 3)Implied Volatility Percentile, 4)Skew Index.
1) Implied Volatility is the market's forecast of a likely movement, usually 1 standard deviation, in a securities price.
2) Implied Volatility Rank, ranks IV in relation to its high and low over a certain period of time. For example if over the past year IV had a high of 20% and a low of 10% and is currently 15%; the IV rank would be 50%, as 15 is 50% of the way between 10 & 20. IV Rank is mean reverting, meaning when IV Rank is high (green) it is assumed that future volatility will decrease; while if IV rank is low (red) it is assumed that future volatility will increase.
3) Implied Volatility Percentile ranks IV in relation to how many previous IV data points are less than the current value. For example if over the last 5 periods Implied volatility was 10%,12%,13%,14%,20%; and the current implied volatility is 15%, the IV percentile would be 80% as 4 out of the 5 previous IV values are below the current IV of 15%. IV Percentile is mean reverting, meaning when IV Percentile is high (green) it is assumed that future volatility will decrease; while if IV percentile is low (red) it is assumed that future volatility will increase. IV Percentile is more robust than IV Rank because, unlike IV Rank which only looks at the previous highs and lows, IV Percentile looks at all data points over the specified time period.
4)The skew index is an index I made that looks at volatility skew. Volatility Skew compares implied volatility of options with downside strikes versus upside strikes. If downside strikes have higher IV than upside strikes there is negative volatility skew. If upside strikes have higher IV than downside strikes then there is positive volatility skew. Typically, markets have a negative volatility skew, this has been the case since Black Monday in 1987. All negative skew means is that projected option contract prices tend to go down over time regardless of market conditions.
Additionally, this script provides two ways to calculate the 4 data types above: a)Model-Based and b)VixFix.
a) The Model-Based version calculates the four data types based on a model that projects future volatility. The reason that you would use this version is because it is what is most commonly used to calculate IV, IV Rank, IV Percentile, and Skew; and is closest to real world IV values. This version is what is referred to when people normally refer to IV. Additionally, the model version of IV, Rank, Percentile, and Skew are directionless.
b) The VixFix version calculates the four data types based on the VixFix calculation. The reason that you would use this version is because it is based on past price data as opposed to a model, and as such is more sensitive to price action. Additionally, because the VixFix is meant to replicate the VIX Index (except it can be applied to any asset) it, just like the real VIX, does have a directional element to it. Because of this, VixFix IV, Rank, and Percentile tend to increase as markets move down, and decrease as markets move up. VixFix skew, on the other hand, is directionless.
How to use this suite of tools:
1st. Pick the way you want your data calculated: either Model-Based or VixFix.
2nd. Input the various length parameters according to their labels:
If you're using the model-based version and are trading options input your time til expiry, including weekends and holidays. You can do so in terms of days, hours, and minutes. If you're using the model-based version but aren't trading options you can just use the default input of 365 days.
If you're using the VixFix version, input how many periods of data you want included in the calculation, this is labeled as "VixFix length". The default value used in this script is 252.
3rd. Finally, pick which data you want displayed from the dropdown menu: Implied Volatility, IV Rank, IV Percentile, or Volatility Skew Index.

Volatility based Standarde Deviation and Fib. Pivot PointsThis indicator plots Standard deviation levels and Fib. Pivot Points. I prefer to use only SD levels but Fib. levels also come handy in providing support and resistance.
How to use this indicator:
You have to manually enter instrument's Closing Price / Settlement Price and VIX closing price to draw each day's levels.
For NQ, I use VXN closign price and for ES or RTY, I use VIX closing price.
This indicator can be used on individual stocks and forex pairs.

ANN MACD : 25 IN 1 SCRIPTIn this script, I tried to fit deep learning series to 1 command system up to the maximum point.
After selecting the ticker, select the instrument from the menu and the system will automatically turn on the appropriate ann system.
Listed instruments with alternative tickers and error rates:
WTI : West Texas Intermediate (WTICOUSD , USOIL , CL1! ) Average error : 0.007593
BRENT : Brent Crude Oil (BCOUSD , UKOIL , BB1! ) Average error : 0.006591
GOLD : XAUUSD , GOLD , GC1! Average error : 0.012767
SP500 : S&P 500 Index (SPX500USD , SP1!) Average error : 0.011650
EURUSD : Eurodollar (EURUSD , 6E1! , FCEU1!) Average error : 0.005500
ETHUSD : Ethereum (ETHUSD , ETHUSDT ) Average error : 0.009378
BTCUSD : Bitcoin (BTCUSD , BTCUSDT , XBTUSD , BTC1!) Average error : 0.01050
GBPUSD : British Pound (GBPUSD,6B1! , GBP1!) Average error : 0.009999
USDJPY : US Dollar / Japanese Yen (USDJPY , FCUY1!) Average error : 0.009198
USDCHF : US Dollar / Swiss Franc (USDCHF , FCUF1! ) Average error : 0.009999
USDCAD : Us Dollar / Canadian Dollar (USDCAD) Average error : 0.012162
SOYBNUSD : Soybean (SOYBNUSD , ZS1!) Average error : 0.010000
CORNUSD : Corn (ZC1! ) Average error : 0.007574
NATGASUSD : Natural Gas (NATGASUSD , NG1!) Average error : 0.010000
SUGARUSD : Sugar (SUGARUSD , SB1! ) Average error : 0.011081
WHEATUSD : Wheat (WHEATUSD , ZW1!) Average error : 0.009980
XPTUSD : Platinum (XPTUSD , PL1! ) Average error : 0.009964
XU030 : Borsa Istanbul 30 Futures ( XU030 , XU030D1! ) Average error : 0.010727
VIX : S & P 500 Volatility Index (VX1! , VIX ) Average error : 0.009999
YM : E - Mini Dow Futures (YM1! ) Average error : 0.010819
ES : S&P 500 E-Mini Futures (ES1! ) Average error : 0.010709
GAZP : Gazprom Futures (GAZP , GZ1! ) Average error : 0.008442
SSE : Shangai Stock Exchange Composite (Index ) ( 000001 ) Average error : 0.011287
XRPUSD : Ripple (XRPUSD , XRPUSDT ) Average error : 0.009803
Note 1 : Australian Dollar (AUDUSD , AUD1! , FCAU1! ) : Instrument has been removed because it has an average error rate of over 0.13.
The average error rate is 0.1850.
I didn't delete it from the menu just because there was so much request,
You can use.
Note 2 : Friends have too many requests, it took me a week in total and 1 other script that I'll share in 2 days.
Reaching these error rates is a very difficult task, and when I keep at a low learning rate, they are trained for a very long time.
If I don't see the error rate at an average low, I increase the layers and go back into a longer process.
It takes me 45 minutes per instrument to command artificial neural networks, so I'll release one more open source, and then we'll be laying 70-80 percent of the world trade volume with artificial neural networks.
Note 3 :
I would like to thank wroclai for helping me with this script.
This script is subject to MIT License on behalf of both of us.
You can review my original idea scripts from my Github page.
You can use it free but if you are going to modify it, just quote this script .
I hope it will help everyone, after 1-2 days I will share another ann script that I think is of the same importance as this, stay tuned.
Regards , Noldo .

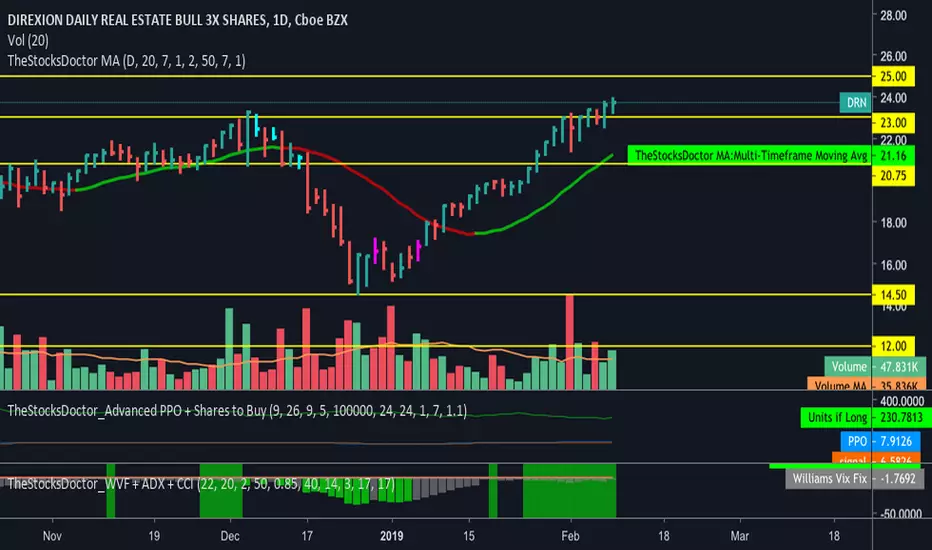
TheStocksDoctor_WVF + ADX + CCIThis script is a modified version of CM Williams Vix Fix for which I have added an indicator that shows when ADX and CCI are both indicating positive momentum - highlighted by green bars. This is part of TheStocksDoctor Trading System.
Inputs are as follows:
Lookback period Standard Deviation High ---> 22
Bolinger Band Length ---> 20
Bollinger Band Standard Dev.. ---> 2
Lookback period percentile high ---> 50
Highest Percentile ---> 0.85
----Highlight bars Below... --->
Show Highlight bar if WVF WAS true is now False --->
Show highlight bar if WVF IS True --->
----Highlight bars Below Use Filtered... --->
Show highlight bar for filtered entry --->
Show highlight bar for AGGRESSIVE Filtered Entry? --->
Check below to Turn all Bars Gray --->
Check box to Turn Bars gray? --->
Long-term look back current bar has to close Below... ---> 40
Medium-term look back current bar has to close below... ---> 14
Entry price action strength --close... ---> 3
--------Turn On/Off Alerts below... --->
---To activate alerts you HAVE To Check... --->
---You can un Check the box BELOW... --->
Show Williams Vix Fix Histogram... --->
Show Alert WVF = True? --->
Show Alert WVF wa true now False? --->
Show Alert WVF Filtered? --->
Show Alert WVF AGGRESSIVE Filter? --->
ADX Smoothing ---> 17
DI Length ---> 17
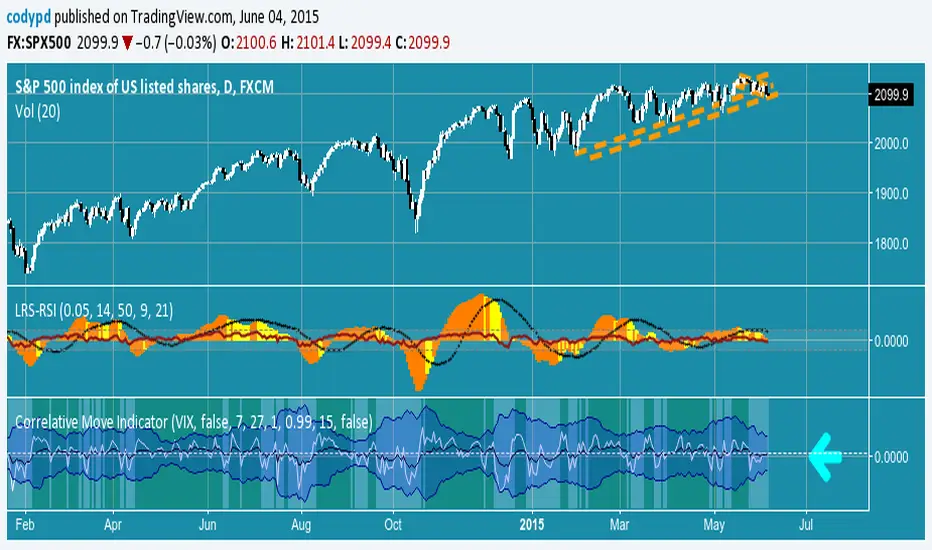
Correlative Move IndicatorEDIT: When loading this indicator it uses a default symbol for comparison of SPX. On Tradingview SPX is a Daily price (unless you buy real time) so you will see "Loading ..." and never see data. Move out to a daily time frame -or- switch the symbol to something available intraday. /EDIT
Correlates the movement of the price you are graphing to the price of someting else that you pick (default is SPX, see EDIT above)
Comments in code explain what I did. If correlations are too tight for CC to show anything but a flat line try this.
Please comment / improve.
=====================
// A simple indicator that looks complex (impress your friends)
// Provides rate of change in the propensity of something
// to move in correlation with whatever you are graphing.
// Inputs are:
// "Compared symbol" - standard Trading View symbol input. You can input ratios & formulas if you like; Defaults to SPX
// "Invert?" - by default the indicator shows the item you have charted as numerator and the "Compared symbol"
// the denominator. So if you graphed "UVXY" and open this indicator with default compared symbol "SPX" then
// the base relationship is UVXY/SPX. Click the box if you want SPX/UVXY (for example) instead.
// "Fast EMA Period" - the period for the fast EMA (white line). default = 7
// "Slow EMA Period" - the period for the slow EMA (black line). default = 27. Important: the bakground color of the indicator
// changes based on this EMA hitting threshold values below.
// "+ threshold" - > threshold for green background. default = 1.0
// "- threshold" - < threshold for red background. default = 0.99
// "BBand Period" - number of periods back for BBand (1 std deviation) calculation. default = 15
// Does not measure correlation per se - it measures change in that correlation.
// If two things do not correlate well in the first place then you will see a lot of noise
// and I wish you much luck in interpreting it.
// However, if two things do correlate well (like VXX and VIX) then this will help you detect
// circumstances where that correlation is unstable. Such instability can signal change in direction.
// I developed it to track real time changes in contango / backwardation in various VIX futures instruments which I trade.
// Tip - always try invert - sometimes the correlation changes become clearer. That can be because the threshold bias
// towards "+" with the defaults here, so think about what the "logical" relationship is and adjust the thresholds, or invert,
// or do both. Just remember - the indicator is below the item you are charting, so the default "source"/"compared"
// relationship is intuitive as you look at the screen. Volatility traders, however, will find "invert" useful with default
// thresholds signalling "green" for contango and "red" for backwardation.
// Short and long ema trends added for smoothing and trend change indications.
// Background color changes to green when correlation changing "positively" and red when "negatively" and white when near 1.
// Think of the value "1" as representing the base "1 to 1" correlation between two things. That doesn't mean same price -
// it means same rate and direction in change in price.
// 1 std deviation is used to build a basic Bollinger Band in blue. The number of periods for calculating that is an input.
// You may find a change in correlation signal outside a Bollinger Band signals a direction change. TV alerts can be
// set for such events.
CM ATR PercentileRankCM ATR PercentileRank - Great For Showing Market Bottoms.
When Increased Volatility to the Downside Reaches Extreme Levels it’s Usually a Sign of a Market Bottom.
This Indicator Takes the ATR and uses a different LookBack Period to calculate the Percentile Rank of ATR Which is a Great Way To Calculate Volatility
Be Careful Of Using w/ Market Tops. Not As Reliable.
***Ability to Control ATR Period and set PercentileRank to Different Lookback Period
***Ability to Plot Histogram Just Showing Percentiles or Histogram Based on Up/Down Close
Fuchsia Lines = Greater Than 90th Percentile of Volatility based on ATR and LookBack Period.
Red Lines = Warning — 80-90th Percentile
Orange Lines = 70-80th Percentile
Other Useful Indicators
Williams Vix Fix
CM_RSI EMA Is a Great Filter for Williams Vix Fix

Alpha Options System# Apex Options Sniper - Advanced Multi-Signal Day Trading System
## 🎯 Overview
**Apex Options Sniper** is a professional-grade, multi-signal trading indicator specifically engineered for high-probability day trading of weekly options. This comprehensive system combines 10+ technical indicators into a sophisticated scoring algorithm that identifies optimal entry points with institutional-level precision.
Perfect for traders of SPY, QQQ, and high-volume stocks, this indicator eliminates guesswork by providing clear BUY CALLS and BUY PUTS signals based on multiple technical confluences.
---
## 🚀 Key Features
### **Multi-Signal Confluence Engine**
- **10+ Technical Indicators** working in harmony
- **Weighted Scoring System** (0-30+ points) for signal strength
- **Real-time Signal Classification**: Strong vs Moderate signals
- **False Signal Reduction** through multi-confirmation requirements
### **Advanced Momentum Analysis**
- ✅ RSI with Divergence Detection (bullish & bearish)
- ✅ Stochastic Oscillator (oversold/overbought + crossovers)
- ✅ MACD with crossover and momentum confirmation
- ✅ Automatic divergence spotting for reversal trades
### **Sophisticated Trend Detection**
- ✅ Triple EMA System (9/21/50) with alignment scoring
- ✅ SuperTrend Indicator with trend flip alerts
- ✅ VWAP for institutional price levels
- ✅ Multi-timeframe trend confirmation
### **Professional Volume Analysis**
- ✅ Volume Spike Detection (vs 20-period average)
- ✅ OBV (On-Balance Volume) with divergence detection
- ✅ Order Flow Analysis (buy vs sell pressure)
- ✅ Relative volume ratio display
### **Advanced Pattern Recognition**
- ✅ Bollinger Band Squeeze detection (volatility expansion)
- ✅ BB breakout signals (major move initiation)
- ✅ Automatic Support & Resistance levels (pivot-based)
- ✅ Price reaction scoring at key levels
### **Built-in Risk Management**
- ✅ ATR-based Stop Loss calculations
- ✅ Customizable Risk:Reward ratios
- ✅ Position sizing recommendations
- ✅ Real-time profit target calculations
### **Comprehensive Visual Dashboard**
- ✅ Live scoring breakdown for all indicators
- ✅ Individual signal strength display
- ✅ Bull vs Bear score comparison
- ✅ Color-coded signal status
- ✅ Risk management metrics
---
## 📊 How It Works
### **Scoring System**
The indicator assigns points based on technical conditions:
| **Category** | **Max Points** | **Conditions** |
|-------------|---------------|----------------|
| Momentum (RSI/Stoch) | 8 | Oversold/overbought + divergences |
| MACD | 4 | Crossovers + momentum direction |
| Trend (EMAs) | 6 | EMA alignment + SuperTrend |
| Volume | 4 | Spikes + OBV divergences |
| Order Flow | 2 | Buy/sell pressure imbalance |
| Bollinger Bands | 2 | Squeeze + breakouts |
| Support/Resistance | 2 | Price at key levels |
| VWAP | 1 | Above/below institutional level |
### **Signal Thresholds**
- **🚀 STRONG CALLS**: Bull score ≥6, Net score ≥4
- **📈 CALLS**: Bull score ≥4, Net score ≥2
- **🔥 STRONG PUTS**: Bear score ≥6, Net score ≤-4
- **📉 PUTS**: Bear score ≥4, Net score ≤-2
### **Multi-Timeframe Filter**
Optional higher timeframe confirmation reduces false signals by ensuring the broader trend supports your trade direction.
---
## 🎮 How to Use
### **Installation**
1. Open TradingView Pine Editor
2. Paste the complete indicator code
3. Click "Add to Chart"
4. Customize settings to your preference
### **Recommended Settings**
**For SPY/QQQ Day Trading:**
- Timeframe: 1-minute or 5-minute
- Strong Signal Threshold: 6
- Moderate Signal Threshold: 4
- Multi-timeframe Confluence: ON
**For Individual Stocks:**
- Timeframe: 5-minute or 15-minute
- Increase SuperTrend multiplier to 3.5-4.0
- Enable all advanced features
**For Scalping:**
- Timeframe: 1-minute
- Use STRONG signals only (6+)
- Tight stop loss (1.0-1.5 ATR multiplier)
### **Best Trading Times**
- **9:30-11:00 AM EST** - Highest volume, strongest signals
- **2:00-4:00 PM EST** - Afternoon momentum plays
- Avoid 11:30 AM-1:30 PM EST (lunch chop)
---
## 📈 Signal Interpretation
### **What You'll See on Chart:**
**Visual Signals:**
- 🟢 **Green Triangle (CALLS)**: Bullish entry point
- 🟢 **Large Green Triangle (STRONG CALLS)**: High-confidence bullish entry
- 🔴 **Red Triangle (PUTS)**: Bearish entry point
- 🔴 **Large Red Triangle (STRONG PUTS)**: High-confidence bearish entry
- 💎 **Small Diamonds**: RSI/OBV divergences (reversal warning)
**Dashboard Information:**
- Individual indicator values and signals
- Real-time score breakdown
- Bull/Bear score totals
- ATR stop loss levels
### **Entry Rules:**
✅ **High Probability Trades (Take These):**
- Strong signal (6+ score)
- 3+ indicators confirming
- Volume spike present
- SuperTrend aligned
- Higher timeframe confirms
⚠️ **Moderate Trades (Smaller Position):**
- Moderate signal (4-5 score)
- 2+ indicators confirming
- Normal volume
- Mixed trend signals
❌ **Avoid These:**
- Conflicting signals (Bull score ≈ Bear score)
- Low volume
- During major news events
- Bollinger squeeze without breakout direction
---
## 🛡️ Risk Management Guide
### **Position Sizing:**
- **Strong Signals (6+)**: 3-5% of portfolio
- **Moderate Signals (4-5)**: 2-3% of portfolio
- **Low Conviction**: 1-2% or skip
### **Stop Loss Strategy:**
- Use ATR-based stops (displayed in dashboard)
- Default: 1.5x ATR from entry
- Weekly options: 30-50% premium loss maximum
- Never hold through stop loss hoping for recovery
### **Profit Targets:**
- **Quick Scalps**: 25-50% gain (15-30 min)
- **Day Trades**: 50-100% gain (same day exit)
- **Swing**: 100-200% gain (1-2 days max for weeklies)
- **Take partial profits** at first target, let rest run
### **Time Decay Management (Weekly Options):**
- Monday-Wednesday: Hold overnight acceptable on strong signals
- Thursday: Close by EOD unless very strong conviction
- Friday: Avoid holding overnight, theta decay accelerates
---
## 🔔 Alert Configuration
### **Recommended Alerts:**
**Essential Alerts:**
1. 🚀 Strong Buy Calls
2. 🔥 Strong Buy Puts
**Advanced Alerts:**
3. 💎 RSI Bullish Divergence
4. ⚠️ RSI Bearish Divergence
5. 🔶 Bollinger Band Squeeze
6. ✅ SuperTrend Bull Flip
7. ❌ SuperTrend Bear Flip
**Alert Setup:**
- Set frequency: "Once Per Bar Close"
- Enable for all devices
- Use webhook for automation (optional)
---
## 💡 Pro Trading Tips
### **Maximize Win Rate:**
1. **Wait for confluence** - Best trades have 3+ indicators aligned
2. **Respect the dashboard** - Check WHY it's signaling (which indicators)
3. **Volume is king** - Signals with volume spikes are significantly more reliable
4. **Use BB Squeeze** - When squeeze + signal = explosive directional move
5. **SuperTrend flips** - Major trend change confirmations, very powerful
6. **Watch for divergences** - Diamond markers = hidden reversal opportunities
### **Common Mistakes to Avoid:**
❌ Trading every signal (be selective)
❌ Ignoring volume (volume confirms everything)
❌ Fighting the higher timeframe trend
❌ Oversizing positions on moderate signals
❌ Holding weekly options too long (theta decay)
❌ Trading during lunch hour (11:30-1:30 EST)
### **Advanced Techniques:**
- **Divergence + Support/Resistance** = Highest probability reversals
- **BB Squeeze + EMA alignment** = Explosive trend continuations
- **SuperTrend flip + Volume spike** = Major trend change entries
- **Multiple timeframe analysis** - Check 5m signal on 1m chart for precision entries
---
## 📊 Indicator Components Explained
### **RSI (Relative Strength Index)**
- Measures momentum and overbought/oversold conditions
- Divergences signal potential reversals before they happen
- Score: 2-3 points for extremes and divergences
### **Stochastic Oscillator**
- Confirms momentum extremes
- Crossovers provide entry timing
- Score: 1-2 points
### **MACD (Moving Average Convergence Divergence)**
- Trend following momentum indicator
- Crossovers signal momentum shifts
- Score: 1-3 points based on signal strength
### **EMA System (9/21/50)**
- Dynamic support and resistance
- Alignment shows trend strength
- Price position relative to EMAs scores 1-2 points
### **SuperTrend**
- Volatility-based trend indicator
- Reduces whipsaws in choppy conditions
- Trend flips are major signals (2 points)
### **Bollinger Bands**
- Volatility measurement
- Squeeze = calm before the storm
- Breakouts = directional move initiation (2 points)
### **Volume Analysis**
- Confirms price movement legitimacy
- Spikes validate signals (2 points)
- OBV divergences predict reversals (2 points)
### **Order Flow**
- Buy vs sell pressure measurement
- Institutional footprint detection
- Score: 2 points for strong imbalances
---
## 🎓 Learning Path
### **Beginner (Week 1-2):**
- Use STRONG signals only
- Focus on high-volume stocks (SPY/QQQ)
- Trade only first hour of market
- Use paper trading first
### **Intermediate (Week 3-4):**
- Add moderate signals to your arsenal
- Learn to read the dashboard
- Understand why each signal triggers
- Start combining with support/resistance
### **Advanced (Month 2+):**
- Use divergence signals
- Trade BB squeeze breakouts
- Optimize settings for your style
- Develop your own confluence rules
---
## ⚙️ Customization Guide
### **Adjustable Parameters:**
**Momentum Settings:**
- RSI Length (default: 14)
- RSI Oversold/Overbought levels (30/70)
- Stochastic Length (14)
**Trend Settings:**
- EMA periods (9/21/50)
- SuperTrend ATR Length (10)
- SuperTrend Multiplier (3.0)
**Volume Settings:**
- Volume MA Length (20)
- Volume Spike Threshold (1.5x)
**Advanced Settings:**
- Bollinger Band Length (20)
- BB Standard Deviation (2.0)
- Pivot Lookback (10)
**Signal Thresholds:**
- Strong Signal Score (default: 6)
- Moderate Signal Score (default: 4)
**Risk Management:**
- ATR Length (14)
- Stop Loss Multiplier (1.5)
- Risk:Reward Ratio (2.0)
---
## 📈 Performance Optimization
### **For Volatile Markets (VIX > 25):**
- Increase SuperTrend multiplier to 4.0
- Raise signal thresholds (+1 point)
- Tighten stop losses (1.0-1.2 ATR)
### **For Ranging Markets:**
- Focus on RSI extremes and divergences
- Use BB squeeze signals
- Ignore moderate signals
- Wait for support/resistance confirmation
### **For Trending Markets:**
- Follow SuperTrend direction religiously
- Use EMA alignment signals
- Allow wider stops (2.0 ATR)
- Take partial profits, let winners run
---
## 🔍 Troubleshooting
**Too Many Signals:**
- Increase signal thresholds to 7/5
- Enable multi-timeframe filter
- Trade only STRONG signals
**Missing Signals:**
- Decrease thresholds to 5/3
- Disable multi-timeframe filter
- Check that all features are enabled
**Whipsaw in Choppy Markets:**
- Increase SuperTrend multiplier
- Require volume spike confirmation
- Avoid trading 11:30 AM-1:30 PM EST
---
## 🏆 Best Practices
✅ **Always check:**
1. Dashboard shows why signal triggered
2. Volume confirms the move
3. Not during news events
4. Adequate time until expiration
✅ **Risk Management:**
1. Never risk more than 2% per trade
2. Use stops religiously
3. Take profits at targets
4. Don't revenge trade
✅ **Journal Your Trades:**
1. Entry price and signal strength
2. Which indicators triggered
3. Exit price and profit/loss
4. What worked and what didn't
---
## 📞 Support & Updates
This indicator is designed to evolve with market conditions. Recommended to:
- Review settings monthly
- Backtest on your favorite instruments
- Adjust thresholds based on your risk tolerance
- Keep a trading journal to track performance
---
## ⚠️ Disclaimer
This indicator is a tool for technical analysis and should not be used as the sole basis for trading decisions. Options trading involves substantial risk and is not suitable for all investors. Past performance does not guarantee future results. Always:
- Do your own research and due diligence
- Never invest more than you can afford to lose
- Consider consulting with a financial advisor
- Practice with paper trading before using real money
- Understand options Greeks (Delta, Theta, Gamma, Vega)
- Be aware of earnings dates and major news events
**No indicator is 100% accurate. Use proper risk management and trade responsibly.**
---
## 📊 Version History
**v1.0 - Initial Release**
- Multi-signal confluence system
- 10+ technical indicators
- Advanced dashboard
- ATR-based risk management
- Comprehensive alert system
---
## 🎯 Final Thoughts
**Apex Options Sniper** transforms complex technical analysis into clear, actionable signals. By combining multiple proven indicators with sophisticated scoring logic, it helps traders identify high-probability setups while managing risk effectively.
**Success Keys:**
- Quality over quantity (be selective)
- Risk management is everything
- Volume confirms the signal
- Confluence increases probability
- Discipline beats emotion
**Trade smart. Trade with confidence. Trade with Apex Options Sniper.**
---
*For questions, suggestions, or to share your success stories, please comment below or send a message.*
**Happy Trading! 🚀📈**

Druckenmiller Alpha-Physics [Dual-Core]Stop trading in a vacuum. Start trading like a Macro Fund Manager.
The Druckenmiller Alpha-Physics engine is a professional-grade dashboard designed to solve the single biggest problem in trading: Context. Most traders buy a "dip" only to realize it was a crash, or sell a "rip" only to watch it fly higher.
This tool solves this by synthesizing Market Physics (Velocity & Acceleration) across two distinct timeframes (Weekly Macro & Daily Tactical) and filtering every signal through a Global Liquidity Shield.
It is engineered based on the trading philosophy of Stanley Druckenmiller: “I don’t care about the news. I care about the liquidity and the acceleration of the trend.”
How It Works (The Dual-Core Logic)
The engine runs 27 distinct sector assets through a dual-loop physics processor:
The Macro Core (Weekly): Analyzes the 18-month trend. Is the "Tide" coming in or going out?
The Tactical Core (Daily): Analyzes the 3-day price action. Is the "Wave" crashing or rising?
It then synthesizes these two data streams into a single Action Signal.
The Signals (How to Read)
The dashboard tells you exactly what to do based on the conflict between Macro and Micro:
🟢 BUY PULLBACK (The "Alpha" Trade):
Logic: Macro is RIPPING (Bullish) + Tactical is TOP/CRASH (Bearish).
Meaning: You are buying a long-term leader on a short-term discount.
🔵 STINK BID (The "Bottom" Trade):
Logic: Macro is TURNING UP + Tactical is CRASHING.
Meaning: The physics have shifted positive, but price is still dumping. Place limit orders -5% lower to catch the panic bottom.
🔴 SELL RIP (The "Trap" Trade):
Logic: Macro is TOPPING (Bearish) + Tactical is RIPPING (Bullish).
Meaning: The long-term trend is dead. Sell into this short-term rally immediately.
⚪ HOLD: All systems go. Sit on your hands and ride the trend.
The "Invisible" Liquidity Shield
The most dangerous time to buy is when the Fed is draining liquidity. This script monitors the 10-Year Treasury Yield (TNX) and VIX in real-time.
If Liquidity is OK (Navy Header): Signals are valid. Green means Go.
If Liquidity is TIGHT (Maroon Header): The entire dashboard enters "Defense Mode." Buy signals are tinted Maroon to warn you that you are fighting the Fed.
Included Universe (The "Ultimate" List)
Includes 27 institutional-grade tickers covering every corner of the market:
Growth: XLK, SMH, IGV, GRID, QTUM
Cyclical: JETS, XHB, KRE, XLI, XLF
Commodities: GDX, URA, XLE, XLB, TAN
Risk/Safety: IBIT, TLT, XLV, XLP
Note: This script uses dynamic request handling optimized for Pine Script v6. It is designed for Premium/Ultimate plans due to the high volume of data processing (54+ simultaneous streams).

USD Liquidity Regime for BTC Perps (Dual) V1USD Liquidity Regime for BTC Perps (Dual)
This intents to be a BTC Perps USD Liquidity Regime macro indicator.
As it names states it is designed for BTCUSDT perpetual futures traders.
It attempts to tracks USD strength (DXY, UUP, yields, VIX composite) as liquidity proxy:
Lower index = weak USD = Risk-On (green background/histogram = long tailwind for BTC).
Higher = strong USD = Risk-Off (red = caution longs, shorts favor).
How to use:
Green background/histogram: Favor longs — rallies likely, dips bought.
Red: Caution longs — corrections hurt, short bias possible.
Blue line (index) vs red SMA: Crosses signal regime shifts.
Histogram strength: Bigger bars = stronger bias.
This is not intended as financial advise or trigger signal tool.
This is a work in progress
Its value is limited, if you do not understand any or some of the words above please do not use this indicator. If you did, then you understand you are not supposed to use this alone to make decisions.
Feel free to ask any questions, this is a work in progress.
Feel free to suggest improvements.
Educational macro context tool — not signals/advice.
Ok for avoiding going against the USD trend dominance by following liquidity.
By @frank_vergaram

EM Levelsstdv levels for you using VIX and VXN for ES and NQ so hopefully it helps you try it out and have fun

VixTrixVixTrix - Because markets move in both directions.
VixTrix was born from a fundamental limitation in traditional volatility indicators: they only measure downside panic, completely missing the greed-driven extremes that form market tops.
How It Works:
Dual-Component Analysis:
vixBear = Panic selling intensity (distance from recent highs)
vixBull = FOMO buying intensity (distance from recent lows)
Oscillator = vixBear - vixBull = Net fear/greed imbalance
When the oscillator is positive, fear dominates (potential bottom forming). When negative, greed dominates (potential top forming).
Professional-Grade Filtering:
The magic happens with the symmetric RMS (Root Mean Square) bands. Unlike fixed percentage bands or standard deviation, RMS:
Creates mathematically symmetric positive/negative thresholds
Naturally adapts to changing volatility regimes
Provides statistical significance to extremes
VixTrix also adds selectable MA smoothing for the RMS calculation:
WMA (default): Balanced – middle-ground approach
VWMA: Volume-weighted – filters low-volume noise
EMA: Responsive – catches quick reversals
SMA: Stable – for swing trading
HMA: Fast and smooth – ideal for day trading
Signals require triple confirmation:
Statistical Extreme: Oscillator beyond RMS band
Price Action Confirmation: Correct candle color (bullish for bottoms, bearish for tops)
Momentum Continuation: Oscillator still moving toward extreme (exhaustion)
This multi-filter approach reduces premature entries and false signals while maintaining early positioning at potential reversal points.
Why This Matters for Your Trading:
In bull markets, traditional fear indicators sit near zero, giving no warning of impending tops.
VixTrix identifies when greed becomes excessive – when FOMO buying reaches statistical extremes that often precede corrections.
In range-bound markets, VixTrix excels at identifying overreactions in both directions, providing high-probability mean reversion opportunities.
During crashes, it captures the panic selling with the same precision as VixFix, but with better timing through its momentum confirmation.
VixTrix spots continuations through:
"No Signal" = Healthy Trend – Oscillator stays between RMS bands (no exhaustion)
Failed Extremes – Touches band but no triple confirmation = trend likely continues
Hidden Divergence – Price makes higher low while oscillator makes shallower low = uptrend continues
Controlled Emotions – Oscillator negative but not extreme in uptrends (greed present but not excessive)
Key Insight: When VixTrix doesn't give a signal during a pullback, institutions aren't panicking – they're just pausing before resuming the trend.
Green columns = Bullish exhaustion (potential bottoms)
Red columns = Bearish exhaustion (potential tops)
Golden RMS bands = Dynamic thresholds adapting to current volatility
Background highlights = Active signal conditions
The Result: A professional-grade oscillator that works in all market conditions – trending up, trending down, or ranging – by measuring the complete emotional spectrum driving price action.

ORB + FVG A+ PRO (All-in-One) [QQQ]Configurable ORB + FVG + filters (VIX, ORB range, relative volume) + A+ PRO (retest at the FVG edge + rejection) + anti-fakeout + orange reminder “CONFIRM POC/HVN (Volume Profile)” right when the A+ signal appears

Standard Deviation Levels with Settlement Price and VolatilityStandard Deviation Levels with Settlement Price and Volatility.
This indicator plots the standard deviation levels based on the settlement price and the implied volatility. It works for all Equity Stocks and Futures.
For Futures
Symbol Volatility Symbol (Implied Volatility)
NQ VXN
ES VIX
YM VXD
RTY RVX
CL OVX
GC GVZ
BTC DVOL
The plot gives you an ideas that the price has what probability staying in the range of 1SD,2SD,3SD ( In normal distribution method)
Please provide the feedback or comments if you find any improvements

Macro-Sentiment (Macro_Serie 1:7)Part of a 7-indicator macro series. Combines yield curve dynamics, VIX structure, employment data (jobless claims, NFP), ISM manufacturing, US-Japan carry trade flows, and consumer sentiment into a single adaptive stress score. Color-coded regimes guide strategy from "Aggressive" to "Buy the Crash."

ART MACRO PEEK 2025-Info v2 With this indicator you will be able to understand what the (vix, btc, triple aaa, dxy) looks like before entering market in one glance, it will act more like market thermometer.

Self-Organized Criticality - Avalanche DistributionHere's all you need to know: This indicator applies Self-Organized Criticality (SOC) theory to financial markets, measuring the power-law exponent (alpha) of price drawdown distributions. It identifies whether markets are in stable Gaussian regimes or critical states where large cascading moves become more probable.
Self-Organized Criticality
SOC theory, introduced by Per Bak, Tang, and Wiesenfeld (1987), describes how complex systems naturally evolve toward critical (fragile) states. An example is a sand pile: adding grains creates avalanches whose sizes follow a power-law distribution rather than a normal distribution.
Financial markets exhibit similar behavior. Price movements aren't purely random walks—they display:
Fat-tailed distributions (more extreme events than Gaussian models predict)
Scale invariance (no characteristic avalanche size)
Intermittent dynamics (periods of calm punctuated by large cascades)
Power-Law Distributions
When a system is in a critical state, the probability of an avalanche of size s follows:
P(s) ∝ s^(-α)
Where:
α (alpha) is the power-law exponent
Higher α → distribution resembles Gaussian (large events rare)
Lower α → heavy tails dominate (large events common)
This indicator estimates α from the empirical distribution of price drawdowns.
Mathematical Method
1. Avalanche Detection
The indicator identifies local price peaks (highest point in a lookback window), then measures the percentage drawdown to the next trough. A dynamic ATR-based threshold filters out noise—small drops in calm markets count, but the bar rises in volatile periods.
2. Logarithmic Binning
Avalanche sizes are sorted into logarithmically-spaced bins (e.g., 1-2%, 2-4%, 4-8%) rather than linear bins. This captures power-law behavior across multiple scales - a 2% drop and 20% crash both matter. The indicator creates 12 adaptive bins spanning from your smallest to largest observed avalanche.
3. Bin-to-Bin Ratio Estimation
For each pair of adjacent bins, we calculate:
α ≈ log(N₁/N₂) / log(s₂/s₁)
Where N₁ and N₂ are avalanche counts, s₁ and s₂ are bin sizes.
Example: If 2% drops happen 4× more often than 4% drops, then α ≈ log(4)/log(2) ≈ 2.0.
We get 8-11 independent estimates and average them. This is more robust than fitting one line through all points—outliers can't dominate.
4. Rolling Window Analysis
Alpha recalculates using only recent avalanches (default: last 500 bars). Old data drops out as new avalanches occur, so the indicator tracks regime shifts in real-time.
Regime Classification
🟢 Gaussian α ≥ 2.8 Normal distribution behavior; large moves are rare outliers
🟡 Transitional 1.8 ≤ α < 2.8 Moderate fat tails; system approaching criticality
🟠 Critical 1.0 ≤ α < 1.8 Heavy tails; large avalanches increasingly common
🔴 Super-Critical α < 1.0 Extreme tail risk; system prone to cascading failures
What Alpha Tells You
Declining alpha → Market moving toward criticality; tail risk increasing
Rising alpha → Market stabilizing; returns to normal distribution
Persistent low alpha → Sustained fragility; heightened crash probability
Supporting Metrics
Heavy Tail %: Concentration of total drawdown in largest 10% of events
Populated Bins: Data coverage quality (11-12 out of 12 is ideal)
Avalanche Count: Sample size for statistical reliability
Limitations
This is a distributional measure, not a timing indicator. Low alpha indicates increased systemic risk but doesn't predict when a cascade will occur. Only that the probability distribution has shifted toward larger events.
How This Differs from the Per Bak Fragility Index
The SOC Avalanche Distribution calculates the power-law exponent (alpha) directly from price drawdown distributions - a pure mathematical analysis requiring only price data. The Per Bak Fragility Index aggregates external stress indicators (VIX, SKEW, credit spreads, put/call ratios) into a weighted composite score.
Technical Notes
Default settings optimized for daily and weekly timeframes on major indices
Requires minimum 200 bars of history for stable estimates
ATR-based dynamic sizing prevents scale-dependent bias
Alerts available for regime transitions and super-critical entry
References
Bak, P., Tang, C., & Wiesenfeld, K. (1987). Self-organized criticality: An explanation of the 1/f noise. Physical Review Letters.
Sornette, D. (2003). Why Stock Markets Crash: Critical Events in Complex Financial Systems. Princeton University Press.

$TGM | Topological Geometry Mapper (Custom)TGM | Topological Geometry Mapper (Custom) – 2025 Edition
The first indicator that reads market structure the way institutions actually see it: through persistent topological features (Betti-1 collapse) instead of lagging price patterns.
Inspired by algebraic topology and persistent homology, TGM distills regime complexity into a single, real-time proxy using the only two macro instruments that truly matter:
• CBOE:VIX – market fear & convexity
• TVC:DXY – dollar strength & global risk appetite
When the weighted composite β₁ persistence drops below the adaptive threshold → market structure radically simplifies. Noise dies. Order flow aligns. A directional explosion becomes inevitable.
Features
• Structural Barcode Visualization – instantly see complexity collapsing in real time
• Dynamic color system:
→ Neon green = long breakout confirmed
→ red = short breakout confirmed
→ yellow = simplification in progress (awaiting momentum)
→ deep purple = complex/noisy regime
• Clean HUD table with live β₁ value, threshold, regime status and timestamp
• Built-in high-precision alerts (Long / Short / Collapse)
• Zero repaint – uses only confirmed data
• Works on every timeframe and every market
Best used on:
BTC, ETH, ES/NQ, EURUSD, GBPUSD, NAS100, SPX500, Gold – anywhere liquidity is institutional.
This is not another repainted RSI or MACD mashup.
This is structural regime detection at the topological level.
Welcome to the future of market geometry.
Made with love for the real traders.
Open-source. No paywalls. No BS.
#topology #betti #smartmoney #ict #smc #orderflow #regime #institutional
