Stock ScreenerMissing great trade opportunities is annoying, and unless you have 12 screens or only trade one market, you are missing a lot of trades. To fix that, we created this stock screener so you get notified instantly of potential great trading conditions in real time, right on your chart.
You get notified of trading benchmarks being met by the value being displayed on the scanner as well as a color change so that it grabs your attention and makes you aware that you should take a look at the other market and look for a potential trade. It also has built in alerts so you can have an alert notification go off when any of your trading conditions are met instead of needing to watch the scanner for color changes.
The screener will change the ticker symbol background color to red green when price is above or below the previous daily range and above or below both VWAPs. This signals that the ticker is trending, which typically means it is a great time to trade that market and follow the trend.
This stock screener allows you to scan up to 10 different markets at the same time for various different conditions so you always know what is going on with your favorite trading symbols. If you want to scan more tickers, just add the indicator to your chart again and change the table position to the other side of the screen and update the tickers on the 2nd screener, allowing you to have 20 tickers at a time.
The scanner can be fully customized by changing the markets that it screens and turning on or off as many of them as you would like. You can also turn on or off any of the different data sets so that you only get information about trading conditions that matter to you.
The screener can provide data on any type of market, such as stocks, crypto, futures, forex and more. Each ticker can be adjusted to whatever market you would like it to scan for data in the settings panel, the only limitation is that it will not provide data for the VWAP and volume trend score if the ticker you are screening does not provide volume data.
Screener Features
The scanner will provide the following types of data for each ticker that is turned on:
Volume - Provides a volume score compared to the average volume and notifies you of higher than normal volume and volume spikes on individual bars by changing colors.
Volatility - Provides a volatility score compared to the average volatility and notifies you of higher than normal volatility by changing colors.
Oscillator - Choose between the RSI or CCI. The value of that oscillator will be displayed and will notify you when values are in extreme ranges such as overbought or oversold conditions according to the threshold values you enter in the settings panel. When those thresholds have been breached, you will be notified by it changing color.
Big Candles - Compares the current candle to average previous candle sizes, and changes color to notify you of big candles including a big top wick, big bottom wick, big candle body and big candle high to low range.
Daily Level Touches & Trends - Calculates and displays various daily candle and intraday open price levels that act as support and resistance. Notifies you when price is touching any of the daily levels that are turned on. The levels you can have on are as follows: previous day high, previous day low or previous day open. It also will notify you when price is touching the current day’s open, NY 930am open, Asia 8pm open, London 2am open and NY midnight 12am open. It will also say “Above” if price is above the previous day’s high or it will say “Below” if price is below the previous day’s low. The color of the cell will also change when a level touch is happening or price is above the previous day high or below the previous day low.
VWAP - Choose from 2 different VWAP lengths, default settings are daily and weekly VWAPs. You will get notified if price touches either of the VWAPs and they will also say “Above” or “Below” if price is currently above or below each VWAP.
How To Use The Screener To Help You Trade
The main purpose of the screener is to scan other markets and notify you of potential good trading opportunities such as price bouncing off of the daily levels or VWAPs. It can also be used to know when price is trending according to the VWAPs and daily levels. Lastly, you can use it to know how the volume and volatility trends are currently which gives you more confidence in taking a trade with this data when volume and volatility are present.
Volume Score
When volume is high, this represents a good time to trade because there are many market participants and price is likely to be volatile while there is high volume which can present a lot of good trade setups for you to take.
The volume score shown on the screener measures the current volume trend compared to previous volume trends and calculates that into a score based on 100 being the same as the previous volume trend. So any value above 100 means it is high volume and any value less than 100 means it is lower volume than normal.
In the settings panel, you can adjust the volume threshold that needs to be met for a volume notification to show up. The default setting is at 120, so you will get notified when the current volume trend score is 120 or higher or you can adjust that threshold value to whatever value you prefer.
It also will notify you when there is a volume spike on the current bar. This is determined by calculating an average of the recent volume totals and then checking to see if the current bar is greater than or equal to that average multiplied by 3. So if a single bar has volume that is greater than 3 times what the average volume is, then you will get a notification that says “Spike” to make you aware of that volume spike.
The volume trend threshold, volume spike multiplier and lookback length for the average volume used in volume spike calculations can all be adjusted in the settings panel to fit your desired preferences.
Volatility Score
High volatility can mean it is a great time to trade because the market is moving quickly and providing large enough movements that you can get in and out in a short amount of time, while still accruing decent sized trade PnL.
The volatility score will calculate the current volatility for each market compared to previous conditions and then divide the current volatility by the average volatility to give you a volatility score. Anything over 100 means the market is decently volatile and you should look at that market to find potential trade setups to execute on. Anything below 100 means the market is not very volatile and it is usually best to just wait until volatility returns before you start trading again.
The screener will notify you when the volatility score is above the threshold you set. The default value is set to 90, but can be adjusted to your preference. Pay attention to any market that shows an alert and take a look at that chart because the high volatility may present a good trade setup for you in the near future.
Oscillator Score
The oscillator data can be switched between Relative Strength Index(RSI) and Commodity Channel Index(CCI).
The RSI provides a value between 0 and 100 that indicates the momentum and strength of the recent price action. Many traders use the extremes of the 0-100 range to signal overbought or oversold conditions and use that as a sign to look for price to reverse in the near future. The typical values used for this and the default settings to provide notifications are: 70 for overbought and 30 for oversold. The scanner will notify you when the RSI value is considered overbought or oversold so you know to take a look at the chart and analyze if it is ready for a trade to be taken.
The CCI provides a value that can be used to determine the trend strength of the underlying asset when the oscillator moves above 100 or below -100. These extreme values are outside of the normal accumulation range and signify that price is moving strongly in that direction so it may be a good time to take a trade in the direction of the trend. The scanner will show you the value of the CCI for each market and notify you if that value is above 100 or below -100.
Both RSI and CCI settings can be adjusted in the settings panel to your desired settings so you have the exact oscillator settings you prefer to use as well as the exact values that you want to use for being notified.
Big Candles
Big candles can mean that many traders are buying or selling at the same time and many times indicate a good signal to trade in that same direction. That is why we included this calculation in the screener, so you are always aware when a large candle prints.
It calculates the average size of the recent candles and then uses that average as the benchmark to determine if the current candle is considered big and worthy of notifying you to take a look at that chart.
You can adjust the multiplier used for the big candle threshold to whatever you desire, but the default setting is 3 which means the candle will be considered big and notify you if it is 3 times as large as an average candle.
The big candles data will track the following candle values and notify you with these labels:
High to Low candle size = HL
Candle Body from open to close candle size = OC
Top Wick size = TW
Bottom Wick size = BW
Daily Level Touches & Trend
Daily level touches are excellent levels to watch for price to bounce because they often act as support and resistance levels for intraday trading. The scanner will track each market and notify you when the current candle is touching any of the daily levels that you have turned on in the settings panel.
The main levels that are turned on by default and are useful for all markets and how they will be labeled on the scanner are as follows:
Previous Day High = High
Previous Day Low = Low
Previous Day Open = < Open
Previous Day Close = Close
Current Day Open = Open
We also included some extra levels that are useful for futures traders. They are as follows:
NY 930am Open = 930am
NY 12am Midnight Open = 12am
Asia Open at 8pm NY time = Asia
London Open at 2am NY Time = London
Watch how price reacts to these levels and then trade the bounces off of these levels if the price action confirms that it is going to respect that level.
When price is currently above the previous day high, the scanner will say “Above” and show a green color, indicating a bullish trend and that price is above the previous daily candle’s high.
When price is currently below the previous day low, the scanner will say “Below” and show a red color, indicating a bearish trend and that price is below the previous daily candle’s low.
Pay attention to when price is trending above or below the previous daily candle as those trends can provide excellent trend trading opportunities.
The daily levels that you have turned on in the settings will also show as lines on the chart and include a label next to them, identifying each level so you know what each line represents. You can turn on or off all of the lines shown on the chart in the main settings or turn them off one by one in the style panel of the settings. Labels can also be turned on or off for all of the lines in the main settings panel. You can adjust the label positioning in the Label Offset section of the settings panel.
VWAP Touches & Trend
VWAP stands for volume weighted average price and is a very popular tool that traders use to determine trend direction based on volume as well as an excellent level to trade price bounces off of.
The typical VWAP time period used is Daily, which means the volume weighted average price will reset at the beginning of a new day. We set the first VWAP to be the daily VWAP by default and the second one to be the weekly VWAP. You can adjust both of the time periods to be any of the provided time lengths that you choose.
The screener will show “Above” with a green background color when price is above the VWAP, indicating a bullish trend. It will show “Below” with a red background color when price is below the VWAP, indicating a bearish trend. When both VWAPs are showing Above or Below, you can expect price to trend in that direction, so look for pullbacks you can trade in the direction of the trend. If the VWAPs are showing different directions, then you should expect to bounce back and forth between the VWAPs, but be careful and watch out for price to break beyond either one and start a trend.
When the current candle is touching the VWAP, the scanner will change colors and say VWAP to notify you that price is touching the VWAP and you should look at that chart and analyze the market for a potential bounce off of the VWAP to trade.
Trending Market Signals
Strong trends are excellent markets to trade and can many times provide excellent trading opportunities that don’t require expert price action reading skills to be able to take winning trades from. That is why we included a signal to notify you of a strong trending market.
The strong trending market will show up as a green or red background color for the ticker name. If the color of the ticker name is green, it is notifying you that the price is above the previous daily high, above VWAP 1 and above VWAP 2 and is a good market to look for bullish trend trades. If the color of the ticker name is red, it is notifying you that the price is below the previous daily low, below VWAP 1 and below VWAP 2 and is a good market to look for bearish trend trades.
Changing The Tickers It Scans
To change the tickers that the indicator scans, scroll near the bottom of the settings panel and select the ticker symbol you want to update and then search for the exact symbol you want to use. If you want to scan less tickers, then just turn some of the tickers off that you don’t need.
Scanning More Than 10 Tickers
If you want to scan more than 10 tickers, you can add the scanner to your chart again and then just change the table position to the other side of the screen. This will allow you to scan 10 more tickers that will show up separately. Then if you want even more, just add the indicator to your chart again and update the table position until you have as many markets as you want. The table position setting can be found at the bottom of the main settings panel.
Alerts
The screener has alerts that can be used to notify you when any of the data set thresholds have been met or if price is touching one of the levels. You can set alerts for the following events:
Bullish Trend Alert - Price is above the previous daily high and above both VWAPs.
Bearish Trend Alert - Price is below the previous daily low and below both VWAPs.
High Volume Alert - Volume is higher than the threshold or a volume spike is detected.
High Volatility Alert - Volatility is higher than the threshold.
Oscillator Is Extended Alert - Oscillator value has exceeded the upper or lower threshold.
Big Candle Alert - A big candle has been detected.
Daily Level Touch Alert - One of the daily levels that is turned on is being touched.
VWAP Touch Alert - One of the 2 VWAPs are being touched.
An alert will trigger when any one of tickers on your scanner meets the alert conditions, so when you see the alert, you will need to go to your chart and look at the scanner to see which ticker it was and then navigate to that chart to look for potential trade setups.
The alerts will use the exact same settings you have configured in the settings panel to send you alert notifications. With normal settings, this could give you a lot of alerts, so if you only want alerts to fire when abnormal conditions are being met, try setting up a second screener on your chart that has very high threshold values and only has the most important level touches on. Then turn the setting "Do Not Show The Screener On The Chart" to off so the calculations will still run and fire alerts, but won't clog up your charts. This way you can only get alert notifications when major events happen but still have your normal screener settings available on your chart.
Markets This Can Be Used On
This screener uses the price action and volume data so you can use it to scan any type of market you would like as long as the ticker you are scanning has price and volume data feeds. If a market does not have volume data, then it will just show NaN in the volume row and the VWAP rows will not show anything.
Screener

Top 40 Best Performing Nasdaq Stocks with Advanced Stats ScreenWelcome to the CustomQuantLabs Advanced Stats Screener. This dashboard is designed for traders who need more than just price action—it provides a comprehensive, institutional-grade view of the "Top 40" performing assets in the Nasdaq (or any watchlist of your choice) at a single glance.
Instead of flipping through 40 different charts, this screener aggregates Performance Metrics and Advanced Statistical Risk Models into one clean, heatmap-style dashboard. It helps you instantly identify outliers, trend leaders, and potential mean-reversion setups.
Key Features
1. Multi-Timeframe Performance Heatmap Instantly spot momentum. The dashboard tracks returns across 5 key timeframes, color-coded with a dynamic heatmap (Bright Green for leaders, Bright Red for laggards):
Week% (Short-term momentum)
Month% & Quarter% (Medium-term trend)
6M% & 12M% (Long-term secular trend)
2. Institutional Risk Metrics (Advanced Stats) We go beyond simple percentage changes. This screener calculates complex statistical formulas for every single ticker in real-time:
Kelly Criterion (%): A money management formula used to determine optimal position size based on win probability and return ratio. A higher Kelly % suggests a statistically stronger "edge" based on recent history.
Sharpe Ratio: Measures risk-adjusted return. How much return are you getting for every unit of risk? (Values > 1.0 are generally considered good).
Sortino Ratio: Similar to Sharpe, but only penalizes downside volatility. This is crucial for distinguishing between "good volatility" (upside pumps) and "bad volatility" (crashes).
Z-Score: A mean-reversion metric. It measures how many standard deviations the current price is from its 20-day mean.
High Positive Z-Score (>2): Price may be overextended to the upside.
Low Negative Z-Score (<-2): Price may be oversold.
Volatility (%): A dynamic measure of the asset's daily range, helping you gauge the "personality" of the stock before entering.
Customization & Settings
Fully Customizable Watchlist: While pre-loaded with top Nasdaq performers (like NVDA, AMD, PLTR, MU), you can easily edit the "Symbols" input in the settings to track Crypto, Forex, or your own custom stock portfolio.
Smart Theme Detection: Includes a toggle for Dark Mode (ProjectSyndicate style) and Light Mode (Clean white style).
Compact Mode: You can toggle specific columns on or off to fit the table on smaller screens.
How to Use
Add the script to your chart.
Open Settings (Gear Icon).
Paste your list of 40 tickers into the "Ticker List" text area (separated by commas).
Use the Z-Score to find overbought/oversold setups and the Relative Strength (Week/Month) to find breakout candidates.
Disclaimer: This tool is for informational purposes only. The "Top 40" list requires manual updating if the market leaders change. All statistical metrics (Kelly, Sharpe, etc.) are based on historical data and do not guarantee future performance.
Built by CustomQuantLabs.

PD Location Screener (NY Session)Scan only for DISCOUNT or PREMIUM
Ignore everything at equilibrium
Then apply:
Liquidity sweep
Displacement
FVG / OB
One trade. Done.


Multi Asset & Multi Timeframe Trend DashboardOverview
The Multi-Asset & Multi-Timeframe Trend Dashboard is a comprehensive visual data terminal designed to provide a bird's-eye view of market sentiment across five different assets and seven distinct timeframes simultaneously. By consolidating 10 core technical indicators into a single table, it eliminates the need for "chart hopping" and helps traders identify high-probability trend alignment.
How It Works
The dashboard evaluates each asset based on a Scoring System ($-10$ to $+10$). For every timeframe, the script analyzes the following 10 conditions:
Trend: EMA 20 > EMA 50Macro
Trend: EMA 50 > EMA 200
Position: Price > EMA 200
MACD: MACD Line > Signal Line
MACD Momentum: MACD Histogram > 0
RSI Momentum: RSI(14) > RSI SMA(14)
RSI Level: RSI(14) > 50
Stochastics: Stoch K > D
CCI: Commodity Channel Index > 0
Awesome Oscillator: AO > 0
Visual Logic & Features
Indicator Dots (■): Represent the 10 individual technical conditions. Green indicates a bullish state; Red indicates a bearish state.
Trend Arrows (▲/▼): Displays the aggregate directional bias of a timeframe based on the sum of the 10 dots.
Neutral State (✖): If indicators are split 50/50 (Score of 0), a grey cross is displayed to indicate total market indecision.
"ALL" Column: A macro-summary that aggregates scores across all four primary timeframes.
Volatility Marker (•): A dot appearing next to the symbol name indicates that current ATR is higher than the historical average (user-defined threshold).
Market Status Color: The symbol name background turns Green if the market is currently open and active, and Red if it is closed or stagnant.
Technical Implementation
This script utilizes request.security calls to fetch data across timeframes. To ensure performance and prevent repainting issues, all security calls are handled using the barstate.islast flag to only render the dashboard on the most recent bar.
How to Use
Alignment Trading: Look for "Full House" scenarios where all arrows (15m through Daily) are the same color.
Scalping Bias: Use the "Mini Timeframes" (1m, 3m, 5m) to find entries that align with the higher timeframe trend shown in the main table.
Volatility Filter: Only take trades when the volatility marker (•) is active to ensure there is enough "power" in the move.

cd_VW_Cx IMPROVED - Quant VWAP System: Regime, Magnets & Z-ScoQuant VWAP System: Regime, Magnets & Z-Score Matrix
This indicator is a comprehensive Quantitative Trading System designed to move beyond simple support and resistance. Instead of static lines, it uses Statistical Probability (Z-Score) and Standard Deviation to define the current market regime, identify institutional value zones, and project high-probability liquidity targets.
It is engineered for Day Traders and Scalpers (Crypto & Futures) who need to know if the market is Trending, Ranging, or preparing for a Breakout.
1. The "Regime" System (Standard Deviation Bands)
The core engine anchors a VWAP (Volume Weighted Average Price) to your chosen timeframe (Daily, Weekly, or Monthly) and projects volatility bands based on market variance.
The Trend Zone (Inner Band / 1.0 SD): This is the "Fair Value" zone. In a healthy trend, price will pull back into this zone and hold. A hold here signals a high-probability continuation (Trend Following).
The Reversion Zone (Outer Band / 2.0 SD): This represents a statistical extreme. Price rarely sustains movement beyond 2 Standard Deviations without a reversion. A touch of this band signals "Overbought" or "Oversold" conditions.
2. Liquidity Magnets (Virgin VWAPs)
The script automatically tracks "Unvisited VWAPs" from previous sessions. These are price levels where significant volume occurred but have not yet been re-tested.
The Logic: Algorithms often target these "open loops." The script visualizes them as Blue Dashed Lines with price tags.
Smart Scaling (Anti-Scrunch): Includes a custom "Ghost Engine" that automatically hides or "ghosts" magnets that are too far away. This prevents your chart from being squashed (scrunched) on lower timeframes, keeping your candles perfectly readable while still tracking targets in the background.
3. The Quant Matrix (Dashboard)
A real-time Heads-Up Display (HUD) that interprets the data for you:
Regime: Detects Volatility Squeezes. If the bands compress, it signals "⚠ SQUEEZE", warning you to stop mean-reversion trading and prepare for an explosive breakout.
Bias: Color-coded Trend Direction (Bullish/Bearish) based on VWAP slope.
Signal: actionable text prompts such as "BUY DIP" (Trend Following), "FADE EXT" (Mean Reversion), or "PREP BREAK" (Squeeze).
4. Visual Intelligence
Bold Day Separators: Clear, vertical dotted dividers with Date Stamps to instantly separate trading sessions.
Dynamic Labels: Floating labels on the right axis identify exactly which deviation level is which, preventing chart confusion.
How to Use
Strategy A: The Trend Pullback (continuation)
Check Matrix: Ensure Bias is BULLISH (Green).
Wait: Allow price to pull back into the Inner Band (Dark Green Zone).
Trigger: If price holds the Center VWAP or the -1.0 SD line, enter Long.
Target: The next Liquidity Magnet above or the +2.0 SD band.
Strategy B: The Reversion Fade (Counter-Trend)
Check Matrix: Ensure price is labeled "EXTREME" or Signal says "FADE EXT".
Trigger: Price touches or pierces the Outer Band (2.0 SD).
Action: Enter counter-trend (Short) with a target back to the Center VWAP (Mean Reversion).
Strategy C: The Magnet Target
Identify a "MAGNET" line (Blue Dashed) near current price.
These act as high-probability Take Profit levels. Price will often rush to these levels to "close the loop" before reversing.
Settings
Anchor: Daily (default), Weekly, or Monthly.
Magnet Focus Range: Adjusts how aggressively the script hides distant magnets to fix chart scaling (Default: 2%).
Visuals: Fully customizable colors, label sizes, and dashboard position.

cd_VW_CxOverview
The cd_VW_Cx is a sophisticated trend analysis tool designed to quantify market momentum using Multi-Period VWAP (Volume Weighted Average Price). Unlike standard indicators, this script evaluates the current price relationship across multiple historical VWAP anchors to generate a real-time "Confidence Score" ranging from -100 to +100.
💡 Key Features
• Dynamic Anchoring: Seamlessly switch between Daily, Weekly, or Monthly open anchors to align with your trading style (Scalping, Day Trading, or Swing).
• Algorithmic Scoring (The Score Box): The indicator compares the current VWAP against historical periods.
o Score > +70: Strong Bullish Momentum.
o Score < -70: Strong Bearish Momentum.
• Polyline Rendering: Utilizes Pine Script v6’s advanced polyline architecture for high-performance, sleek visual plotting that doesn't clutter your chart.
• Institutional Support/Resistance: Historical VWAP levels are color-coded, often acting as "invisible" magnetic zones where institutional orders are clustered.
🛠 How to Trade with cd_VW_Cx
1. Momentum Confirmation: Look for the Score Box to turn Teal (Bullish) or Red (Bearish). This indicates that the current trend has statistical backing from multiple previous sessions.
2. The Breakout Signal: The script tracks price crossovers of the current VWAP. A "Bullish Breakout" combined with a high score is a high-probability entry signal.
3. Visual Guidance: Use the custom labels to identify which specific day/week/month’s VWAP is currently being tested as support or resistance.
⚙️ Customizable Settings
• Anchor Selection: Choose the calculation basis (Daily, Weekly, Monthly).
• Thresholds: Adjust the sensitivity of the Bullish/Bearish alerts (Default is +/- 70).
• Visuals: Full control over table positioning, font sizes, and color palettes to match your chart theme.
📢 cd_VW_Cx: Multi-Period VWAP Scoring & Analysis Guide
🔍 Overview & Visual Logic
The labels next to the VWAP levels dynamically change based on your Anchor selection:
• Daily Open: Displays the Day Name (e.g., Monday, Tuesday).
• Weekly Open: Displays the Week Number (1 – 52).
• Monthly Open: Displays the Month Number (1 – 12).
•
General View:
________________________________________
🚦 How to Filter & Track Your Assets
You can monitor your favorite assets using two powerful methods:
1. Real-Time Alerts
Stay updated with TradingView notifications:
• Per Asset: Track a single pair.
• Watchlist Basis: Monitor your entire list at once. Alert Setup Guide:
2. Pine Screener Integration
Filter the market effortlessly using the Pine Screener. Pine Screener View:
________________________________________
⚙️ Settings & Configuration
• Timeframe Selection: Your chart timeframe must be lower than the selected Anchor timeframe. (e.g., If "Daily Open" is selected, the timeframe should be lower than 1D).
• Anchor Choice: Select Daily, Weekly, or Monthly opens.
• Source Selection: Default value is set to ohlc4. Source Settings:
Filtering Criteria Examples:
• Bullish Filtering: Find assets with high momentum scores.
• Bullish Breakout (Single Criteria): Filters assets that have closed above the current VWAP level.
• Combined Strength (Score + Breakout): Filters assets that have a Score > 70 AND a fresh VWAP Breakout simultaneously.
________________________________________
⚠️ Important Notes & Warnings
• Calculation Logic: The indicator calculates levels and scores on timeframes lower than the anchor. It is best used on timeframes that are close to but lower than the anchor.
• Avoid Extreme Gaps: Using a very low timeframe (e.g., 1m) with a very high anchor (e.g., Monthly) increases the risk of erroneous results.
• Optimization: The default score threshold of 70 is a starting point; I recommend adjusting it based on your own trading experience.
• The Power of Confluence: VWAP levels are naturally strong. Their significance increases when they coincide with institutional levels like PDH (Previous Day High), Session H/L, or HTF FVG.
• Experience Matters: A high score alone is not enough for an entry. Always combine this data with your personal strategy.
________________________________________
💬 Community & Feedback
I would love to hear your suggestions regarding the scoring logic or visual improvements! Feel free to share your thoughts in the comments.
Happy Trading! 🚀

Relative Strength Heatmap [BackQuant]Relative Strength Heatmap
A multi-horizon RSI matrix that compresses 20 different lookbacks into a single panel, turning raw momentum into a visual “pressure gauge” for overbought and oversold clustering, trend exhaustion, and breadth of participation across time horizons.
What this is
This indicator builds a strip-style heatmap of 20 RSIs, each with a different length, and stacks them vertically as colored tiles in a single pane. Every tile is colored by its RSI value using your chosen palette, so you can see at a glance:
How many “fast” versus “slow” RSIs are overbought or oversold.
Whether momentum is concentrated in the short lookbacks or spread across the whole curve.
When momentum extremes cluster, signalling strong market pressure or exhaustion.
On top of the tiles, the script plots two simple breadth lines:
A white line that counts how many RSIs are above 70 (overbought cluster).
A black line that counts how many RSIs are below 30 (oversold cluster).
This turns a single symbol’s RSI ladder into a compact “market pressure gauge” that shows not only whether RSI is overbought or oversold, but how many different horizons agree at the same time.
Core idea
A single RSI looks at one length and one timescale. Markets, however, are driven by flows that operate on multiple horizons at once. By computing RSI over a ladder of lengths, you approximate a “term structure” of strength:
Short lengths react to immediate swings and very recent impulses.
Medium lengths reflect swing behaviour and local trends.
Long lengths reflect structural bias and higher timeframe regime.
When many lengths agree, for example 10 or more RSIs all above 70, it suggests broad participation and strong directional pressure. When only a few fast lengths stretch to extremes while longer ones stay neutral, the move is more fragile and more likely to mean-revert.
This script makes that structure visible as a heatmap instead of forcing you to run many separate RSI panes.
How it works
1) Generating RSI lengths
You control three parameters in the calculation settings:
RS Period – the base RSI length used for the shortest strip.
RSI Step – the amount added to each successive RSI length.
RSI Multiplier – a global scaling factor applied after the step.
Each of the 20 RSIs uses:
RSI length = round((base_length + step × index) × multiplier) , where the index goes from 0 to 19.
That means:
RSI 1 uses (len + step × 0) × mult.
RSI 2 uses (len + step × 1) × mult.
…
RSI 20 uses (len + step × 19) × mult.
You can keep the ladder dense (small step and multiplier) or stretch it across much longer horizons.
2) Heatmap layout and grouping
Each RSI is plotted as an “area” strip at a fixed vertical level using histbase to stack them:
RSI 1–5 form Group 1.
RSI 6–10 form Group 2.
RSI 11–15 form Group 3.
RSI 16–20 form Group 4.
Each group has a toggle:
Show only Group 1 and 2 if you care mainly about fast and medium horizons.
Show all groups for a full spectrum from very short to very long.
Hide any group that feels redundant for your workflow.
The actual numeric RSI values are not plotted as lines. Instead, each strip is drawn as a horizontal band whose fill color represents the current RSI regime.
3) Palette-based coloring
Each tile’s color is driven by the RSI value and your chosen palette. The script includes several palettes:
Viridis – smooth green to yellow, good for subtle reading.
Jet – strong blue to red sequence with high contrast.
Plasma – purple through orange to yellow.
Custom Heat – cool blues to neutral grey to hot reds.
Gray – grayscale from white to black for minimalistic layouts.
Cividis, Inferno, Magma, Turbo, Rainbow – additional scientific and rainbow-style maps.
Internally, RSI values are bucketed into ranges (for example, below 10, 10–20, …, 90–100). Each bucket maps to a unique colour for that palette. In all schemes, low RSI values are mapped to the “cold” or darker side and high RSI values to the “hot” or brighter side.
The result is a true momentum heatmap:
Cold or dark tiles show low RSI and oversold or compressed conditions.
Mid tones show neutral or mid-range RSI.
Warm or bright tiles show high RSI and overbought or stretched conditions.
4) Bull and bear breadth counts
All 20 RSI values are collected into an array each bar. Two counters are then calculated:
Bull count – how many RSIs are above 70.
Bear count – how many RSIs are below 30.
These are plotted as:
A white line (“RSI > 70 Count”) for the overbought cluster.
A black line (“RSI < 30 Count”) for the oversold cluster.
If you enable the “Show Bull and Bear Count” option, you get an immediate reading of how many of the 20 horizons are stretched at any moment.
5) Cluster alerts and background tagging
Two alert conditions monitor “strong cluster” regimes:
RSI Heatmap Strong Bull – triggers when at least 10 RSIs are above 70.
RSI Heatmap Strong Bear – triggers when at least 10 RSIs are below 30.
When one of these conditions is true, the indicator can tint the background of the chart using a soft version of the current palette. This visually marks stretches where momentum is extreme across many lengths at once, not just on a single RSI.
What it plots
In one oscillator window, the indicator provides:
Up to 20 horizontal RSI strips, each representing a different RSI length.
Color-coded tiles reflecting the current RSI value for each length.
Group toggles to show or hide each block of five RSIs.
An optional white line that counts how many RSIs are above 70.
An optional black line that counts how many RSIs are below 30.
Optional background highlights when the number of overbought or oversold RSIs passes the strong-cluster threshold.
How it measures breadth and pressure
Single-symbol breadth
Breadth is usually defined across a basket of symbols, such as how many stocks advance versus decline. This indicator uses the same concept across time horizons for a single symbol. The question becomes:
“How many different RSI lengths are stretched in the same direction at once?”
Examples:
If only 2 or 3 of the shortest RSIs are above 70, bull count stays low. The move is fast and local, but not yet broadly supported.
If 12 or more RSIs across short, medium and long lengths are above 70, the bull count spikes. The move has broad momentum and strong upside pressure.
If 10 or more RSIs are below 30, bear count spikes and you are in a broad oversold regime.
This is breadth of momentum within one market.
Market pressure gauge
The combination of heatmap tiles and breadth lines acts as a pressure gauge:
High bull count with warm colors across most strips indicates strong upside pressure and crowded long positioning.
High bear count with cold colors across most strips indicates strong downside pressure and capitulation or forced selling.
Low counts with a mixed heatmap indicate neutral pressure, fragmented flows, or range-bound conditions.
You can treat the strong-cluster alerts as “extreme pressure” signals. When they fire, the market is heavily skewed in one direction across many horizons.
How to read the heatmap
Horizontal patterns (through time)
Look along the time axis and watch how the colors evolve:
Persistent hot tiles across many strips show sustained bullish pressure and trend strength.
Persistent cold tiles across many strips show sustained bearish pressure and weak demand.
Frequent flipping between hot and cold colours indicates a choppy or mean-reverting environment.
Vertical structure (across lengths at one bar)
Focus on a single bar and read the column of tiles from top to bottom:
Short RSIs hot, long RSIs neutral or cool: early trend or short-term fomo. Price has moved fast, longer horizons have not caught up.
Short and long RSIs all hot: mature, entrenched uptrend. Broad participation, high pressure, greater risk of blow-off or late-entry vulnerability.
Short RSIs cold but long RSIs mid to high: pullback in a higher timeframe uptrend. Dip-buy and continuation setups are often found here.
Short RSIs high but long RSIs low: countertrend rallies within a broader downtrend. Good hunting ground for fades and short entries after a bounce.
Bull and bear breadth lines
Use the two lines as simple, numeric breadth indicators:
A rising white line shows more RSIs pushing above 70, so bullish pressure is expanding in breadth.
A rising black line shows more RSIs pushing below 30, so bearish pressure is expanding in breadth.
When both lines are low and flat, few horizons are extreme and the market is in mid-range territory.
Cluster zones
When either count crosses the strong threshold (for example 10 out of 20 RSIs in extreme territory):
A strong bull cluster marks a broadly overbought regime. Trend followers may see this as confirmation. Mean-reversion traders may see it as a late-stage or blow-off context.
A strong bear cluster marks a broadly oversold regime. Downtrend traders see strong pressure, but the risk of sharp short-covering bounces also increases.
Trading applications
Trend confirmation
Use the heatmap and breadth lines as a trend filter:
Prefer long setups when the heatmap shows mostly mid to high RSIs and the bull count is rising.
Avoid fresh shorts when there is a strong bull cluster, unless you are specifically trading exhaustion.
Prefer short setups when the heatmap is mostly low RSIs and the bear count is rising.
Avoid aggressive longs when a strong bear cluster is active, unless you are trading reflexive bounces.
Mean-reversion timing
Treat cluster extremes as exhaustion zones:
Look for reversal patterns, failed breakouts, or order flow shifts when bull count is very high and price starts to stall or diverge.
Look for reflexive bounce potential when bear count is very high and price stops making new lows or shows absorption at the lows.
Use the palette and counts together: hot tiles plus a peaking white line can mark blow-off conditions, cold tiles plus a peaking black line can mark capitulation.
Regime detection and risk toggling
Use the overall shape of the ladder over time:
If upper strips stay warm and lower strips stay neutral or warm for extended periods, the market is in an uptrend regime. You can justify higher risk for long-biased strategies.
If upper strips stay cold and lower strips stay neutral or cold, the market is in a downtrend regime. You can justify higher risk for short-biased strategies or defensive positioning.
If colours and counts flip frequently, you are likely in a range or choppy regime. Consider reducing size or using more tactical, short-term strategies.
Multi-horizon synchronization
You can think of each RSI length as a proxy for a different “speed” of the same market:
When only fast RSIs are stretched, the move is local and less robust.
When fast, medium and slow RSIs align, the move has multi-horizon confirmation.
You can require a minimum bull or bear count before allowing your main strategy to engage.
Spotting hidden shifts
Sometimes price appears flat or drifting, but the heatmap quietly cools or warms:
If price is sideways while many hot tiles fade toward neutral, momentum is decaying under the surface and trend risk is increasing.
If price is sideways while many cold tiles climb back toward neutral, selling pressure is decaying and the tape is repairing itself.
Settings overview
Calculation Settings
RS Period – base RSI length for the shortest strip.
RSI Step – the increment added to each successive RSI length.
RSI Multiplier – scales all generated RSI lengths.
Calculation Source – the input series, such as close, hlc3 or others.
Plotting and Coloring Settings
Heatmap Color Palette – choose between Viridis, Jet, Plasma, Custom Heat, Gray, Cividis, Inferno, Magma, Turbo or Rainbow.
Show Group 1 – toggles RSI 1–5.
Show Group 2 – toggles RSI 6–10.
Show Group 3 – toggles RSI 11–15.
Show Group 4 – toggles RSI 16–20.
Show Bull and Bear Count – enables or disables the two breadth lines.
Alerts
RSI Heatmap Strong Bull – fires when the number of RSIs above 70 reaches or exceeds the configured threshold (default 10).
RSI Heatmap Strong Bear – fires when the number of RSIs below 30 reaches or exceeds the configured threshold (default 10).
Tuning guidance
Fast, tactical configurations
Use a small base RS Period, for example 2 to 5.
Use a small RSI Step, for tight clustering around the fast horizon.
Keep the multiplier near 1.0 to avoid extreme long lengths.
Focus on Group 1 and Group 2 for intraday and short-term trading.
Swing and position configurations
Use a mid-range RS Period, for example 7 to 14.
Use a moderate RSI Step to fan out into slower horizons.
Optionally use a multiplier slightly above 1.0.
Keep all four groups enabled for a full view from fast to slow.
Macro or higher timeframe configurations
Use a larger base RS Period.
Use a larger RSI Step so the top of the ladder reaches very slow lengths.
Focus on Group 3 and Group 4 to see structural momentum.
Treat clusters as regime markers rather than frequent trading signals.
Notes
This indicator is a contextual tool, not a standalone trading system. It does not model execution, spreads, slippage or fundamental drivers. Use it to:
Understand whether momentum is narrow or broad across horizons.
Confirm or filter existing signals from your primary strategy.
Identify environments where the market is crowded into one side.
Distinguish between isolated spikes and truly broad pressure moves.
The Relative Strength Heatmap is designed to answer a simple but powerful question:
“How many versions of RSI agree with what I am seeing on the chart?”
By compressing those answers into a single panel with clear colour coding and breadth lines, it becomes a practical, visual gauge of momentum breadth and market pressure that you can overlay on any trading framework.

Breakout ScannerThis is a Breakout Scanner that shows you the immediate trend across 4 higher timeframes for up to 10 different tickers. It calculates a score from 1 to 3 for bullish and -1 to -3 for bearish based on where price is currently at compared to the previous higher timeframe’s candle levels.
When price is breaking out of the previous higher timeframe candle’s range, then it will have a score of 3 for bullish breakout or -3 for bearish breakout. When price is above the high or below the low of multiple different higher timeframe candles, you can expect price to continue the breakout and move to a new area of price range.
The brighter red or green the color is, the stronger the trend is on that timeframe. When it shows a bright green or red box on the far right side of a ticker, it is notifying you that the ticker is bullish or bearish on all timeframes and trending strongly, so switch over to that chart and look to trade in the direction of that trend.
The tickers, colors and time frames can be customized to suit your preference and you can also turn off as many tickers or time frames as you’d like if you want less tickers or time frames to show up on the indicator. It also includes alerts for when all timeframes are bullish or all timeframes are bearish for one ticker.
Make sure to keep each timeframe set to a timeframe that is higher than your chart timeframe.
Bullish Scoring & Colors
If the current candle close is above the midline of the higher time frame candle, it is given a score of 1 and a dark green background. If the current candle close is above the higher timeframe candle body, then it is given a score of 2 and a medium green background. If the current candle close is above the high of the higher time frame candle, it is given a score of 3 and a bright green background.
The higher the score the stronger the bullish trend and the brighter green the color will be.
Bearish Scoring & Colors
If the current candle close is below the midline of the higher timeframe candle, it is given a score of -1 and a dark red background. If the current candle close is below the higher timeframe candle body, then it is given a score of -2 and a medium red background. If the current candle close is below the low of the higher timeframe candle, it is given a score of -3 and a bright red background.
The lower the score, the stronger the bearish trend and the brighter red the color will be.
Total Score Display
On the right side of the indicator table, there is a column that displays the total score by adding all the scores together so you can easily tell the overall strength of the trend across all timeframes. Wait for the trend score to be at least 75% of the possible score to trade so you can ensure you are only trading very strong trends and increase your probability of winning your trade. The total score will update according to how many time frames you have enabled in the settings. You can also turn on or off the total score count if you prefer. The default setting is off.
All Timeframe Trends Agree
When all of the timeframes that you have turned on are in the same direction at the same time, a green or red box will appear on the far right side of the scanner. This is a visual cue that lets you know the strongest trending markets without having to read any of the numbers. Make sure to check out the charts for the markets that have a green or red box on the far right side and look for potential trend trading opportunities.
Alerts
You can set alerts for when all time frames for a certain ticker are bullish or bearish. If you have some time frames turned off at the time of creating your alerts, then it will only require all time frames that are on to be all bullish or bearish to generate an alert. Make sure to set your alerts to once per bar close to ensure you don’t get premature alerts that aren’t yet valid.
Best Way To Use The Scanner
For best results, make sure you wait for the trend to show all bullish or all bearish at the same time and then look to trade in the direction of the strong trend. If you can be patient enough to do that, you will increase the probability of winning your trade because you are trading with the direction of the overall higher timeframe trend when the market is trending strongly and making new highs or lows.
When one of the markets in the scanner shows all timeframes trending, go to that chart and see how price action is reacting to the previous higher timeframe candle levels. You can see those levels easily by adding our Higher Timeframe Candle Levels indicator to your chart and using the same timeframes as your Breakout Scanner is using.
If price is holding the higher timeframe candle levels well, then look to place trades in the direction of the trend that the Breakout Scanner is showing.
Other Indicators To Pair This With
Use this in combination with our Higher Timeframe Candle Levels indicator so you can see all of these levels being used to calculate the trend strength scores and watch how price reacts to those levels. You should also use our Trend Strength Indicator to easily read the historical trends of price compared to the higher timeframes and use those trends to guide you on when to trade and which direction to trade.
Trend Strength Indicator, Higher Timeframe Candle Levels and the Breakout Scanner all use the same levels to calculate the trend scores so they are designed to work all together to help you quickly be able to read a chart and find what direction to trade in.

Relative Performance Tracker [QuantAlgo]🟢 Overview
The Relative Performance Tracker is a multi-asset comparison tool designed to monitor and rank up to 30 different tickers simultaneously based on their relative price performance. This indicator enables traders and investors to quickly identify market leaders and laggards across their watchlist, facilitating rotation strategies, strength-based trading decisions, and cross-asset momentum analysis.
🟢 Key Features
1. Multi-Asset Monitoring
Track up to 30 tickers across any market (stocks, crypto, forex, commodities, indices)
Individual enable/disable toggles for each ticker to customize your watchlist
Universal compatibility with any TradingView symbol format (EXCHANGE:TICKER)
2. Ranking Tables (Up to 3 Tables)
Each ticker's percentage change over your chosen lookback period, calculated as:
(Current Price - Past Price) / Past Price × 100
Automatic sorting from strongest to weakest performers
Rank: Position from 1-30 (1 = strongest performer)
Ticker: Symbol name with color-coded background (green for gains, red for losses)
% Change: Exact percentage with color intensity matching magnitude
For example, Rank #1 has the highest gain among all enabled tickers, Rank #30 has the lowest (or most negative) return.
3. Histogram Visualization
Adjustable bar count: Display anywhere from 1 to 30 top-ranked tickers (user customizable)
Bar height = magnitude of percentage change.
Bars extend upward for gains, downward for losses. Taller bars = larger moves.
Green bars for positive returns, red for negative returns.
4. Customizable Color Schemes
Classic: Traditional green/red for intuitive interpretation
Aqua: Blue/orange combination for reduced eye strain
Cosmic: Vibrant aqua/purple optimized for dark mode
Custom: Full personalization of positive and negative colors
5. Built-In Ranking Alerts
Six alert conditions detect when rankings change:
Top 1 Changed: New #1 leader emerges
Top 3/5/10/15/20 Changed: Shifts within those tiers
🟢 Practical Applications
→ Momentum Trading: Focus on top-ranked assets (Rank 1-10) that show strongest relative strength for trend-following strategies
→ Market Breadth Analysis: Monitor how many tickers are above vs. below zero on the histogram to gauge overall market health
→ Divergence Spotting: Identify when previously leading assets lose momentum (drop out of top ranks) as potential trend reversal signals
→ Multi-Timeframe Analysis: Use different lookback periods on different charts to align short-term and long-term relative strength
→ Customized Focus: Adjust histogram bars to show only top 5-10 strongest movers for concentrated analysis, or expand to 20-30 for comprehensive overview

Custom Bollinger Band Squeeze Screener [Pineify]Custom Bollinger Band Squeeze Screener
Key Features
Multi-symbol scanning: Analyze up to 6 tickers simultaneously.
Multi-timeframe flexibility: Screen across four selectable timeframes for each symbol.
Bollinger Band Squeeze algorithm: Detect volatility contraction and imminent breakouts.
Advanced ATR integration: Measure expansion and squeeze states with custom multipliers.
Customizable indicator parameters: Fine-tune Bollinger and ATR settings for tailored detection.
Visual table interface: Rapidly compare squeeze and expansion signals across all instruments.
How It Works
At the core, this screener leverages a unique blend of Bollinger Bands and Average True Range (ATR) to quantify volatility states for multiple assets and timeframes at once. For each symbol and every selected timeframe, the indicator calculates Bollinger Band width and compares it against ATR levels, offering real-time squeeze (consolidation) and expansion (breakout) signals.
Bollinger Band width is computed using standard deviations around a SMA basis.
ATR is calculated to gauge market volatility independent of price direction.
Squeeze: Triggered when BB width contracts below a multiple of ATR, forecasting lower volatility and set-up for a move.
Expansion: Triggered when BB width expands above a higher ATR multiple, signaling a high-volatility breakout.
Display: Results shown in an intuitive table, marking each status per ticker and TF.
Trading Ideas and Insights
Spot assets poised for volatility-driven breakouts.
Compare squeeze presence across timeframes for optimal entry timing.
Integrate screener results with price action or volume for high-confidence setups.
Use squeeze signals to avoid choppy or non-trending conditions.
Expand and diversify watchlists with multi-symbol coverage.
How Multiple Indicators Work Together
This script seamlessly merges Bollinger Bands and ATR with customized multipliers:
Bollinger Bands identify price consolidation and volatility squeeze zones.
ATR tailors the definition of squeeze and expansion, making signals adaptive to volatility regime changes.
By layering these with multi-symbol/multi-timeframe data, traders access a high-precision view of market readiness for trend acceleration or reversal.
The real synergy is in the screener's ability to visualize volatility states for a diverse asset selection, transforming traditional single-chart analysis into a broad market view.
Unique Aspects
Original implementation: Not a simple trend or scalping indicator; utilizes advanced volatility logic.
Fully multi-symbol and multi-timeframe support uncommon in most screeners.
Custom ATR multipliers for both squeeze and expansion allow traders to match their risk profile and market dynamics.
Visual clarity: Table structure promotes actionable insights and reduces decision fatigue.
How to Use
Add the indicator to your TradingView chart (supports any asset class including crypto, forex, stocks).
Select up to six symbols (tickers) and set your preferred timeframes.
Adjust Bollinger Band Length/Deviation and ATR multipliers to refine squeeze/expansion criteria.
Review the screener table: Look for "SQZ" (squeeze) or "EXP" (expansion) cells for entry/exit ideas.
Combine screener information with other technical or fundamental signals for trade confirmation.
Customization
Symbols: Choose any tickers for scanning.
Timeframes: Select short- to long-term intervals to match your trading style.
Bollinger Band parameters: Modify length and deviation for sensitivity.
ATR multipliers: Set low or high values to adjust squeeze/expansion triggers.
Table size and layout: Adapt display for optimal workflow.
Conclusion
The Bollinger Band Squeeze Screener Pineify delivers an innovative, SEO-friendly multi-asset solution for volatility and trend detection. Harness its original algorithmic design to uncover powerful breakout opportunities and optimize your portfolio. Whether you trade crypto with dynamic volatility or scan stocks for momentum, this tool supercharges your TradingView workflow.

RSI Divergence Screener [Pineify]RSI Divergence Screener
Key Features
Multi-symbol and multi-timeframe support for advanced market screening.
Real-time detection and visualization of bullish and bearish RSI divergences.
Seamless integration with core technical indicators and custom divergences.
Highly customizable parameters for precise adaptation to personal trading strategies.
Comprehensive screener table for swift asset comparison and analysis.
How It Works
The RSI Divergence Screener leverages the power of Relative Strength Index (RSI) to systematically track momentum shifts across cryptocurrencies and their respective timeframes. By monitoring both fast and slow RSI calculations, the screener isolates divergence signals—key reversal points that often precede major price moves.
The indicator calculates two RSI values for each selected asset: one with a short lookback (Fast RSI) and another with a longer period (Slow RSI).
It runs a comparative algorithm to find divergences—whenever Fast RSI deviates significantly from Slow RSI, it flags the signal as bullish or bearish.
All detected divergences are dynamically presented in a table view, allowing traders to scan symbols and timeframes for optimal trading setups.
Trading Ideas and Insights
Spot early momentum reversals and preempt major price swings via divergence signals.
Combine multiple symbols and timeframes for cross-market trending opportunities.
Identify high-probability scalping and swing trading setups informed by RSI divergence logic.
Quickly compare crypto asset strength and trend exhaustion across short and long-term horizons.
How Multiple Indicators Work Together
This screener’s edge lies in its synergistic use of multi-setting RSI calculations and customizable input groups.
The dual-RSI approach (Fast vs. Slow) isolates subtle trend shifts missed by traditional single-period RSI.
Safe and reliable divergences arise only when the mathematical difference between Fast RSI and Slow RSI meets predefined thresholds, minimizing false positives.
Divergences are contextualized using tailored color codes and backgrounds, rendering insights immediately actionable.
You can expand analysis with additional moving average filters or overlays for further confirmation.
Unique Aspects
First-of-its-kind screener dedicated solely to RSI divergence, designed especially for crypto volatility.
Efficient screening of up to eight assets and multiple timeframes in one compact dashboard.
Intuitive iconography, color logic, and table layouts optimized for rapid decision-making.
Advanced input group design for fine-tuning indicator settings per symbol, timeframe, and source.
How to Use
Select up to eight cryptocurrency symbols to screen for divergence signals.
Assign individual timeframes and source prices for each asset to customize analysis.
Set Fast RSI and Slow RSI lengths according to your preferred strategy (e.g., scalping, swing, or trend following).
Review the screener table: colored cells highlight actionable bullish (green) and bearish (red) divergences.
Confirm trade setups with additional indicators or price action for robust risk management.
Customization
Symbols: Choose any crypto pair or ticker for dynamic divergence tracking.
Timeframes: Scan across 1m, 5m, 10m, 30m, and more for full market coverage.
RSI lengths: Configure Fast and Slow RSI periods based on volatility and trading style.
Visuals: Tailor table colors, fonts, and alert backgrounds per your preference.
Conclusion
The RSI Divergence Screener is a versatile, original TradingView indicator that empowers traders to scan, compare, and act on divergence signals with speed and precision. Its multi-symbol design, robust logic, and extensive customization options set a new standard for market screening tools. Integrate it into your crypto trading process to capture actionable opportunities ahead of the crowd and optimize your technical analysis workflow.

Bollinger Band Screener [Pineify]Multi-Symbol Bollinger Band Screener Pineify – Advanced Multi-Timeframe Market Analysis
Unlock the power of rapid, multi-asset scanning with this original TradingView Pine Script. Expose trends, volatility, and reversals across your favorite tickers—all in a single, customizable dashboard.
Key Features
Screens up to 8 symbols simultaneously with individual controls.
Covers 4 distinct timeframes per symbol for robust, multi-timeframe analysis.
Integrates advanced Bollinger Band logic, adaptable with 11+ moving average types (SMA, EMA, RMA, HMA, WMA, VWMA, TMA, VAR, WWMA, ZLEMA, and TSF).
Visualizes precise state changes: Open/Parallel Uptrends & Downtrends, Consolidation, Breakouts, and more.
Highly interactive table view for instant signal interpretation and actionable alerts.
Flexible to any market: crypto, stocks, forex, indices, and commodities.
How It Works
For each chosen symbol and timeframe, the script calculates Bollinger Bands using your specified source, length, standard deviation, and moving average method.
Real-time state recognition assigns one of several states (Open Rising, Open Falling, Parallel Rising, Parallel Falling), painting the table with unique color codes.
State detection is rigorously defined: e.g., “Open Rising” is set when both bands and the basis rise, indicating strong up momentum.
All bands, signals, and strategies dynamically update as new bars print or user inputs change.
Trading Ideas and Insights
Identify volatility expansions and compressions instantly, spotting breakouts and breakdowns before they play out.
Spot multi-timeframe confluences—when trends align across several TFs, conviction increases for potential trades.
Trade reversals or continuations based on unique Bollinger Band patterns, such as squeeze-break or persistent parallel moves.
Harness this tool for scalping, swing trading, or systematic portfolio screens—your logic, your edge!
How Multiple Indicators Work Together
This screener’s core strength is its integration of multiple moving average types into Bollinger Band construction, not just standard SMA. Each average adapts the bands’ responsiveness to trend and noise, so traders can select the underlying logic that matches their market environment (e.g., HMA for fast moves or ZLEMA for smoothed lag). Overlaying 4 timeframes per symbol ensures trends, reversals, and volatility shifts never slip past your radar. When all MAs and bands synchronize across symbols and TFs, it becomes easy to separate real opportunity from market noise.
Unique Aspects
Perhaps the most flexible Bollinger Band screener for TradingView—choose from over 10 moving average methods.
Powerful multi-timeframe and multi-asset design, rare among Pine scripts.
Immediate visual clarity with color-coded table cells indicating band state—no need for guesswork or chart clutter.
Custom configuration for each asset and time slice to suit any trading style.
How to Use
Add the script to your TradingView chart.
Use the user-friendly input settings to specify up to 8 symbols and 4 timeframes each.
Customize the Bollinger Band parameters: source (price type), band length, standard deviation, and type of moving average.
Interpret the dashboard: Color codes and “state” abbreviations show you instantly which symbols and timeframes are trending, consolidating, or breaking out.
Take trades according to your strategy, using the screener as a confirmation or primary scan tool.
Customization
Fully customize: symbols, timeframes, source, band length, standard deviation multiplier, and moving average type.
Supports intricate watchlists—anything TradingView allows, this script tracks.
Adapt for cryptos, equities, forex, or derivatives by changing symbol inputs.
Conclusion
The Multi-Symbol Bollinger Band Screener “Pineify” is a comprehensive, SEO-optimized Pine Script tool to supercharge your market scanning, trend spotting, and decision-making on TradingView. Whether you trade crypto, stocks, or forex—its fast, intuitive, multi-timeframe dashboard gives you the informational edge to stay ahead of the market.
Try it now to streamline your trading workflow and see all the bands, all the trends, all the time!

Golden Cross Screener [Pineify]Golden Cross Screener Pineify – Multi-Symbol Trend Detection Screener for TradingView
Discover the Golden Cross Screener Pineify for TradingView: a multi-symbol, multi-timeframe indicator for crypto and other assets. Customizable Golden Cross detection, robust algorithm, and intuitive screener design for smarter portfolio trend analysis.
Key Features
Multi-symbol screening across major cryptocurrencies or assets – BTCUSD, ETHUSD, XRPUSD, USDT, BNB, SOLUSD, DOGEUSD, TRXUSD (fully customizable).
Multi-timeframe analysis (e.g., 1m, 5m, 10m, 30m), enabling robust trend detection from scalp to swing.
Customizable Moving Average settings for both Fast and Slow MA (source and length).
Efficient screener table, highlighting Golden Cross events and current asset trends in one panel.
Visual cues for bullish, bearish, and cross states using intuitive color-coding and labels.
Flexible symbol and timeframe inputs to tailor the screener to any portfolio or watchlist.
How It Works
The Golden Cross Screener Pineify leverages the classic Golden Cross methodology—a bullish trend signal triggered when a shorter-term moving average crosses above a longer-term moving average. To improve robustness, you are empowered to configure both Fast MA and Slow MA periods and sources, making the detection logic applicable to any symbol, timeframe, or asset class.
Internally, the script runs dedicated calculations on each chosen symbol and timeframe, generating independent signals using exponential moving averages (EMA). Using the TradingView `request.security` function, it fetches and processes price data for up to eight portfolio assets on four timeframes, displaying the detected Golden Cross, Bullish, or Bearish states in a central screener table.
Trading Ideas and Insights
Spot emerging bullish or bearish trends across your favorite crypto pairs or trading assets in real time.
Capture prime opportunities when multiple assets align with Golden Cross signals—ideal for portfolio rebalancing or rotational strategies.
Analyze trend consistency by monitoring cross events at multiple timeframes for a given asset.
Swiftly identify when short-term and long-term momentum diverge—flagging potential reversals or trend initiations.
The Golden Cross Screener Pineify is not just a trend signal; it’s a holistic multi-asset scanner built for traders who know the power of combining technical breadth with agile timing.
How Multiple Indicators Work Together
This screener stands out with its modular approach: each asset/timeframe pair is monitored in isolation, yet displayed collectively for multidimensional market insight. Each symbol’s price action is processed through independently configured EMAs—Fast and Slow—whose crossovers are analyzed for directional bias. The implementation’s real innovation is in its screener table engine: it aggregates signals, synchronizes timeframes, and color-codes market states, allowing users to see confluences, divergences, and sector trends at a glance.
Combining Golden Cross detection with customizable moving averages and flexible multi-timeframe, multi-symbol scanning means users can fine-tune sensitivity, focus on specific signals, and adapt screener logic for scalping, swing trading, or investing.
Unique Aspects
True multi-symbol screener within the TradingView indicator framework.
Full customization of screener assets, timeframes, and moving averages.
Advanced, efficient use of TradingView table for clear, actionable visualization.
No dependency on standard, static MA settings—adjust everything to match your strategy.
Big-picture and granular trend detection in one tool, designed for both active traders and portfolio managers.
How to Use
Add the Golden Cross Screener Pineify to your TradingView chart.
Choose up to eight symbols—crypto, stock, forex, or custom assets.
Set four timeframes for screening, from lower to higher intervals.
Adjust moving average sources (price, close, etc.) and period lengths for both Fast and Slow MAs to suit your trading style.
Interpret table cells: clear labels and color indicate Golden Cross (trend shift), Bullish (uptrend), Bearish (downtrend) states for each symbol/timeframe.
React to signal alignments—deploy or rebalance positions, increase alert sensitivity, or backtest sequence confluences.
Customization
The indicator’s inputs panel gives full control:
Select which symbols to screen, making it perfect for any asset watchlist.
Pick the desired timeframes—mix daily, hourly, or minute-based intervals.
Adjust Fast and Slow MA settings: switch source type, change period length, and fine-tune detection logic as needed.
Style your screener table via TradingView settings (colors, font sizes, alignment).
Every element is customizable—adapt the Golden Cross Screener Pineify for your specific portfolio, trading timeframe, and strategy focus.
Conclusion
The Golden Cross Screener Pineify elevates multi-symbol trend detection to a new level on TradingView. By combining configurable Golden Cross logic with a powerful screener engine, it serves both precision and broad market insight—crucial for agile traders and strategic portfolio managers. Whether you’re tracking crypto pairs, stocks, forex, or a mix, this tool transforms static trend analysis into an active, multi-dimensional trading edge.

Multiple Symbol Trend Screener [Pineify]Multiple Symbol Trend Screener Pineify – Ultimate Multi-Indicator Scanner for TradingView
Empower your trading with deep market insights across multiple symbols using this feature-rich Pine Script screener. The Multiple Symbol Trend Screener Pineify enables traders to monitor and compare trends, reversals, and consolidations in real-time across the biggest equity symbols on TradingView, through a synergistic blend of popular technical indicators.
Key Features
Monitor up to 15 symbols and their trends simultaneously
Integrates 7 professional-grade indicators: MA Distance, Aroon, Parabolic SAR (PSAR), ADX, Supertrend, Keltner Channel, and BBTrend
Color-coded table display for instant visual assessment
Customizable lookback periods, indicator types, and calculation methods
SEO optimized for multi-symbol trend detection, screener, and advanced TradingView indicator
How It Works
This indicator leverages TradingView’s Pine Script v6 and request.security() to process multiple symbols across selected timeframes. Data populates a dynamic table, updating each cell based on the calculated value of every underlying indicator. MA Distance highlights deviation from moving averages; Aroon flags emerging trend strength; PSAR marks potential trend reversals; ADX assesses trend momentum; Supertrend detects bullish/bearish phases; Keltner Channel and BBTrend offer volatility and power insights.
Set up your preferred symbols and timeframes
Each indicator runs its calculation per symbol using its parameter group
All results are displayed in a table for a comprehensive dashboard view
Trading Ideas and Insights
Traders can use this screener for cross-market comparison, directional bias, entry/exit filtering, and comprehensive trend evaluation. The screener is excellent for swing trading, day trading, and portfolio tracking. It enables confirmation across multiple frameworks — for example, spotting momentum with ADX before confirming direction with Supertrend and PSAR.
Identify correlated movements or divergences across selected assets
Spot synchronized trend changes for basket trading ideas
Filter symbols by volatility, strength, or trend status for precise trade selection
How Multiple Indicators Work Together
The screener’s edge lies in its intelligent correlation of popular indicators. MA Distance measures the proximity to chosen moving averages, ideal for spotting overbought/oversold conditions. Aroon reveals the strength of new price trends, PSAR indicates reversal signals, and ADX quantifies the momentum of these trends. Supertrend provides a directional phase, while Keltner Channel & BBTrend analyze volatility shifts and band compressions. This amalgamation allows for a robust, multi-dimensional market snapshot, capturing details missed by single-indicator tools.
By displaying all key metrics side-by-side, the screener enables holistic decision-making, revealing confluence zones and contradiction areas across multiple tickers and timeframes.
Unique Aspects
Original implementation combining seven independent trend and momentum indicators for each symbol
Rich customization for symbols, timeframes, and all indicator parameters
Intuitive color-coding for quick reading of bullish/bearish/neutral signals
Comprehensive dashboard for instant actionable insights
How to Use
Load the indicator onto your TradingView chart
Go to the script’s settings and input your preferred symbols and relevant timeframes
Set your desired parameters for each indicator group: Moving Average type, Aroon length, PSAR values, ADX smoothing, etc.
Observe the results in the top-right table, then use it to filter candidates and validate trade setups
The screener is suitable for all timeframes and asset classes available on TradingView. Make sure your chart’s timeframe matches the one used in the scanner for optimal accuracy.
Customization
Choose up to 15 symbols to monitor in a single dashboard
Customize lookback periods, indicator types, colors, and display settings
Configure alerting options and thresholds for advanced trade automation
Conclusion
The Multiple Symbol Trend Screener Pineify sets a new standard for multi-asset screening on TradingView. By elegantly merging seven proven technical indicators, the screener delivers powerful trend detection, reversal analysis, and volatility monitoring — all in one dashboard. Take your trading to new heights with in-depth, customizable market surveillance.

Ichimoku Screener [Pineify]Advanced Multi-Timeframe Ichimoku Screener - Complete Market Analysis Tool
This sophisticated Ichimoku Screener represents a comprehensive approach to multi-timeframe market analysis, combining four distinct Ichimoku-based indicators into a unified screening system. Unlike traditional single-symbol indicators, this screener provides simultaneous analysis across multiple assets and timeframes, enabling traders to identify optimal trading opportunities with enhanced precision and efficiency.
Key Features
Multi-asset screening capability for up to 10 symbols simultaneously
Four customizable timeframes per symbol for comprehensive analysis
Four integrated Ichimoku-based indicators working in harmony
Real-time visual feedback with color-coded signals
Customizable Ichimoku parameters for personalized analysis
Clean, organized table display for easy interpretation
Automated signal strength assessment and timing
How It Works
The screener employs the traditional Ichimoku Kinko Hyo methodology, utilizing five core components: Conversion Line (Tenkan-sen), Base Line (Kijun-sen), Leading Span A (Senkou Span A), Leading Span B (Senkou Span B), and displacement calculations. Each component is mathematically calculated using specific period lengths:
Conversion Line = (Highest High + Lowest Low) / 2 over conversion period
Base Line = (Highest High + Lowest Low) / 2 over base period
Leading Span A = (Conversion Line + Base Line) / 2
Leading Span B = (Highest High + Lowest Low) / 2 over lagging span period
The screener processes these calculations across multiple securities simultaneously using TradingView's security() function, enabling real-time cross-asset analysis. The system tracks state changes using barssince() functions to provide precise timing information for each signal type.
Trading Ideas and Insights
This screener excels in identifying momentum convergence patterns where multiple Ichimoku components align across different timeframes. The most powerful signals occur when:
Cloud color aligns with price position relative to the cloud
Conversion Line crosses above/below Base Line in the same direction as cloud bias
Multiple timeframes show consistent directional bias
Entry signals appear with minimal bars since formation (indicating fresh momentum)
For trend following strategies , focus on symbols where the cloud maintains consistent color across higher timeframes while showing recent entry signals on lower timeframes. For reversal opportunities , identify assets where cloud color changes coincide with price re-entering the cloud after extended periods above or below.
The screener particularly excels in cryptocurrency and forex markets where momentum shifts can be dramatic and sustained. By monitoring multiple timeframes simultaneously, traders can identify when short-term signals align with longer-term trends, significantly improving trade success probability.
How Multiple Indicators Work Together
The four integrated indicators create a comprehensive analytical framework through synergistic interaction:
Ichimoku Cloud (IchiCld) establishes the primary trend bias by comparing Leading Span A with Leading Span B. When Span A > Span B, the cloud displays bullish characteristics; when Span A < Span B, bearish characteristics emerge. The indicator tracks duration since the last cloud color change, providing momentum persistence insight.
Ichimoku Lagging Cloud (IchiLagCld) determines price position relative to the displaced cloud formation. This indicator identifies whether current price action occurs above, below, or within the cloud structure, revealing support/resistance dynamics and trend confirmation signals.
Conversion vs Base (IchiC>Base) monitors the relationship between short-term (Conversion Line) and medium-term (Base Line) momentum. Crossovers in this relationship often precede significant price movements and provide early trend change warnings.
Ichimoku Entry (IchiEnt) synthesizes all components into actionable signals by requiring alignment between cloud bias, price position, and conversion/base relationship. This multi-factor confirmation approach significantly reduces false signals while maintaining sensitivity to genuine momentum shifts.
The mathematical foundation ensures that each indicator contributes unique information while maintaining logical consistency. The system's strength lies in requiring multiple confirmations before generating entry signals, following Ichimoku's original philosophy of comprehensive market analysis.
Unique Aspects
This implementation distinguishes itself through several innovative features:
Advanced State Tracking : Unlike standard Ichimoku indicators that show current values, this screener tracks duration since state changes , providing crucial timing information for signal freshness and momentum strength assessment.
Multi-Asset Efficiency : The screener eliminates the need to manually check multiple charts by presenting comparative analysis across assets and timeframes in a single view, dramatically improving analytical efficiency.
Customizable Visual Feedback : The color-coding system adapts to different signal types and strengths, with recent signals receiving enhanced visual prominence to draw attention to fresh opportunities.
Professional Table Architecture : The organized display accommodates up to 40 symbol-timeframe combinations (10 symbols × 4 timeframes), with intelligent pagination for optimal screen utilization.
Signal Correlation Analysis : By displaying multiple timeframes for each symbol, traders can quickly identify timeframe confluence and divergence patterns that would otherwise require extensive manual analysis.
How to Use
Symbol Configuration : Enter up to 10 symbols in the Symbol input group. Use full exchange:ticker format for optimal compatibility (e.g., "BINANCE:BTCUSDT").
Timeframe Selection : Configure four timeframes in ascending order for logical analysis progression. Recommended combinations include 1m/5m/15m/1h for intraday analysis or 1h/4h/1D/1W for swing trading.
Ichimoku Parameters : Adjust the four core parameters based on your trading style:
Conversion Line Length (default: 9) - Controls short-term momentum sensitivity
Base Line Length (default: 26) - Determines medium-term trend identification
Leading Span B Length (default: 52) - Sets long-term trend calculation period
Displacement (default: 26) - Controls forward projection of cloud structure
Signal Interpretation :
Green backgrounds indicate bullish conditions
Red backgrounds indicate bearish conditions
Numerical values show bars since last state change
"L:" prefix indicates long entry signals
"S:" prefix indicates short entry signals
"N/A" indicates neutral/transitional states
Trading Workflow : Scan for symbols showing consistent signals across multiple timeframes, prioritize fresh signals (low bar counts), and use individual charts for precise entry timing and risk management.
Customization
The screener accommodates various trading approaches through parameter adjustment:
Scalping Configuration : Use shorter periods (Conversion: 5, Base: 13, Span B: 26) with 1m/3m/5m/15m timeframes for high-frequency opportunities.
Swing Trading Setup : Employ standard parameters with 4h/1D/3D/1W timeframes for position trading across days or weeks.
Cryptocurrency Optimization : Given crypto's 24/7 nature, consider using 4h/8h/1D/3D combinations for optimal signal timing.
Symbol selection can focus on correlated assets (e.g., major cryptocurrencies) for sector analysis or diverse assets for portfolio opportunity identification. The flexible timeframe configuration allows adaptation to any market's characteristic volatility and trading patterns.
Conclusion
This Advanced Multi-Timeframe Ichimoku Screener transforms traditional single-chart analysis into a comprehensive market monitoring system. By integrating multiple Ichimoku components across various timeframes and assets, it provides traders with unprecedented analytical efficiency and signal reliability.
The mathematical rigor of traditional Ichimoku analysis combines with modern Pine Script capabilities to deliver a professional-grade screening tool. Whether used for identifying trend continuation opportunities, spotting potential reversals, or conducting broad market analysis, this screener offers the analytical depth and practical functionality required for serious trading applications.
The system's emphasis on signal confluence across multiple timeframes and indicators significantly improves trade selection quality while reducing analysis time. For traders seeking to leverage Ichimoku's proven methodology across multiple markets simultaneously, this screener represents an essential analytical upgrade to traditional single-symbol approaches.

TTM Squeeze Screener [Pineify]TTM Squeeze Screener for Multiple Crypto Assets and Timeframes
This advanced TradingView Pine script, TTM Squeeze Screener, helps traders scan multiple crypto symbols and timeframes simultaneously, unlocking new dimensions in momentum and volatility analysis.
Key Features
Screen up to 8 crypto symbols across 4 different timeframes in one pane
TTM Squeeze indicator detects volatility contraction and expansion (“squeeze”) phases
Momentum filter reveals potential breakout direction and strength
Visual screener table for intuitive multi-asset monitoring
Fully customizable for symbols and timeframes
How It Works
The heart of this screener is the TTM Squeeze algorithm—a hybrid volatility and momentum indicator leveraging Bollinger Bands, Keltner Channels, and linear momentum analysis. The script checks whether Bollinger Bands are “squeezed” inside Keltner Channels, flagging periods of low volatility primed for expansion. Once a squeeze is released, the included momentum calculation suggests the likely breakout direction.
For each selected symbol and timeframe, the screener runs the TTM Squeeze logic, outputs “SQUEEZE” or “NO SQZ”, and tags momentum values. A table layout organizes the results, allowing rapid pattern recognition across symbols.
Trading Ideas and Insights
Spot multi-symbol volatility clusters—ideal for finding synchronized market moves
Assess breakout potential and direction before entering trades
Scalping and swing trading decisions are enhanced by cross-timeframe momentum filtering
Portfolio managers can quickly identify which assets are about to move
How Multiple Indicators Work Together
This screener unites three essential concepts:
Bollinger Bands : Measure volatility using standard deviation of price
Keltner Channels : Define expected price range based on average true range (ATR)
Momentum : Linear regression calculation to evaluate the direction and intensity after a squeeze
By combining these, the indicator not only signals when volatility compresses and releases, but also adds directional context—filtering false signals and helping traders time entries and exits more precisely.
Unique Aspects
Multi-symbol, multi-timeframe architecture—optimized for crypto traders and market scanners
Advanced table visualization—see all signals at a glance, minimizing cognitive overload
Modular calculation functions—easy to adapt and extend for other asset classes or strategies
Real-time, low-latency screening—built for actionable alerts on fast-moving markets
How to Use
Add the script to a TradingView chart (works on custom layouts)
Select up to 8 symbols and 4 timeframes using input fields (defaults to BTCUSD, ETHUSD, etc.)
Monitor the screener table; “SQUEEZE” highlights assets in potential breakout phase
Use momentum values to judge if the squeeze is likely bullish or bearish
Combine screener insights with manual chart analysis for optimal results
Customization
Symbols: Easily set any ticker for deep market scanning
Timeframes: Adjust to match your trading horizon (scalping, swing, long-term)
Indicator parameters: Refine Bollinger/Keltner/Momentum settings for sensitivity
Visuals: Personalize table layout, color codes, and formatting for clarity
Conclusion
In summary, the TTM Squeeze Screener is a robust, original TradingView indicator designed for crypto traders who demand a sophisticated multi-symbol, multi-timeframe edge. Its combination of volatility and momentum analytics makes it ideal for catching explosive breakouts, managing risk, and scanning the market efficiently. Whether you’re a scalper or swing trader, this screener provides the insights needed to stay ahead of the curve.

MA Dist% Screener [Pineify]MA Distance Screener: Multi-Asset Market Scanner for TradingView
Screen multiple symbols and multiple timeframes on TradingView with the MA Distance Screener. Compare asset prices to flexible moving average types. Visual table view, custom assets, timeframes, and MA types. Supercharge your TradingView screener, optimize your workflow, and catch opportunities across assets in real time.
Key Features
Screen up to 10 custom symbols simultaneously across four configurable timeframes.
Choose from multiple Moving Average types: EMA, SMA, WMA, HMA, RMA, VWMA for flexible market context.
Visualize real-time % distance between price and moving average per asset/timeframe in a clean, color-coded table.
Highly customizable: Set your own symbol list, timeframes, MA length and type.
Alerts for symbol/MA deviations—instantly see overbought/oversold status with intuitive background coloring.
Optimized for crypto, FX, and traditional assets – all asset types supported.
How It Works
The MA Distance Screener acts as a dynamic multi-symbol, multi-timeframe scanner. For each selected symbol and timeframe, it calculates the percentage distance between the latest close price and the selected type of moving average (EMA/SMA/etc.). This is achieved by making secure `request.security` calls per asset/timeframe combination, retrieving updated values for each matrix cell. The computed distance (%) is displayed in a color-coded table: a positive value signals price above the MA (potential trend strength), while negatives indicate price below the MA (potential weakness or retracement). Custom colors highlight extreme overbought/oversold readings for quick visual cues.
Trading Ideas and Insights
Quickly spot assets showing the largest deviation from their moving averages – ideal for mean reversion or trend-following entries.
Identify clusters of assets and timeframes lining up in overbought or oversold states; optimize entries with multi-timeframe confirmation.
Scan the market in one glance—reduce chart-hopping and never miss an opportunity when multiple assets align for signals.
The ability to scan distance-to-MA across assets and periods gives traders a statistical edge, surfacing hidden pivots, breakouts, and mean-reversion trades that single-chart analysis may miss.
How Multiple Indicators Work Together
At its core, this screener allows the trader to configure what gets scanned—pick your top 10 assets and favorite 4 timeframes. With each matrix cell, the selected MA (e.g., 14-period EMA) is recalculated, and the current price's distance (%) from that value is computed. By offering six distinct moving average algorithms (EMA, SMA, RMA, HMA, WMA, VWMA), traders can choose their preferred method, adapting the screener for trend, swing, or mean-reversion style. All values are visualized in a single table, creating a true "market dashboard" effect for real-time cross-asset assessment.
Unique Aspects
True cross-asset, cross-timeframe screening in a unified table—rare for Pine Script indicators.
Full flexibility—customizable list of assets, timeframes, and MA parameters to suit any market/trading plan.
Intuitive color-coding and table display eliminates guesswork, enabling “at-a-glance” screening and rapid decision-making.
Efficient, optimized Pine v6 codebase—minimal lag even with 40+ concurrent streams.
How to Use
Add the indicator to your TradingView chart (overlay: off, use a clean chart).
In the settings panel, enter up to 10 symbols (tickers) you want to screen—crypto, stocks, FX, or indices.
Set the 4 timeframes to scan (e.g., 1m, 5m, 15m, 1h), plus your preferred moving average length and type.
Review the results in the pop-up table, where each cell shows "% Distance" from MA for each symbol/timeframe.
Monitor table background/text color for overbought vs. oversold cues.
Customization
Symbol List: Track any asset by typing its TradingView ticker.
Timeframes: Full freedom to select 4 timeframes per scan, from 1min to monthly.
MA Config: Choose period length and MA algorithm (classic or exotic types).
Color Themes: Easily spot signals with dynamic color backgrounds and customizable thresholds.
Conclusion
The MA Distance Screener is a must-have tool for systematic traders, portfolio managers, and retail chartists seeking a true multi-asset edge. With real-time cross-checking against multiple moving averages and timeframes, it empowers faster, more confident decision-making, while reducing chart fatigue and missed setups.
Unlock new insights, catch broad and hidden opportunities, and optimize your market workflow—all in a single TradingView panel.

Trend Score HTF (Raw Data) Pine Screener📘 Trend Score HTF (Raw Data) Pine Screener — Indicator Guide
This indicator tracks price action using a custom cumulative Trend Score (TS) system. It helps you visualize trend momentum, detect early reversals, confirm direction changes, and screen for entries across large watchlists like SPX500 using TradingView’s Pine Script Screener (beta).
⸻
🔧 What This Indicator Does
• Assigns a +1 or -1 score when price breaks the previous high or low
• Accumulates these scores into a real-time tsScore
• Detects early warnings (primed flips) and trend changes (confirmed flips)
• Supports alerts and labels for visual and automated trading
• Designed to work inside the Pine Screener so you can filter hundreds of tickers live
⸻
⚙️ Recommended Settings (for Beginners)
When adding the indicator to your chart:
Go to the “Inputs” tab at the top of the settings panel.
Then:
• Uncheck “Confirm flips on bar close”
• Check “Accumulate TS Across Flips? (ON = non-reset, OFF = reset)”
This setup allows you to see trend changes immediately without waiting for bar closes and lets the trend score build continuously over time, making it easier to follow long trends.
⸻
🧠 Core Logic
Start Date
Select a meaningful historical start date — for example: 2020-01-01. This provides long-term context for trend score calculation.
Per-Bar Delta (Δ) Calculation
The indicator scores each bar based on breakout behavior:
If the bar breaks only the previous high, Δ = +1
If it breaks only the previous low, Δ = -1
If it breaks both the high and low, Δ = 0
If it breaks neither, Δ = 0
This filters out wide-range or indecisive candles during volatility.
Cumulative Trend Score
Each bar’s delta is added to the running tsScore.
When it rises, bullish pressure is building.
When it falls, bearish pressure is increasing.
Trend Flip Logic
A bullish flip happens when tsScore rises by +3 from the lowest recent point.
A bearish flip happens when tsScore falls by -3 from the highest recent point.
These flips update the active trend direction between bullish and bearish.
⸻
⚠️ What Is a “Primed” Flip?
A primed flip is a signal that the current trend is about to flip — just one point away.
A primed bullish flip means the trend is currently bearish, but the tsScore only needs +1 more to flip. If the next bar breaks the previous high (without breaking the low), it will trigger a bullish flip.
A primed bearish flip means the trend is currently bullish, but the tsScore only needs -1 more to flip. If the next bar breaks the previous low (without breaking the high), it will trigger a bearish flip.
Primed flips are plotted one bar ahead of the current bar. They act like forecasts and give you a head start.
⸻
✅ What Is a “Confirmed” Flip?
A confirmed flip is the first bar of a new trend direction.
A confirmed bullish flip appears when a bearish trend officially flips into a new bullish trend.
A confirmed bearish flip appears when a bullish trend officially flips into a new bearish trend.
These signals are reliable and great for entries, trend filters, or reversals.
⸻
🖼 Visual Cues
The trend score (tsScore) line shows the accumulated trend strength.
A Δ histogram shows the daily price contribution: +1 for breaking highs, -1 for breaking lows, 0 otherwise.
A green background means the chart is in a bullish trend.
A red background means the chart is in a bearish trend.
A ⬆ label signals a primed bullish flip is possible on the next bar.
A ⬇ label signals a primed bearish flip is possible on the next bar.
A ✅ means a bullish flip just confirmed.
A ❌ means a bearish flip just confirmed.
⸻
🔔 Alerts You Can Use
The indicator includes these built-in alerts:
• Primed Bullish Flip — watch for possible bullish reversal tomorrow
• Primed Bearish Flip — watch for possible bearish reversal tomorrow
• Bullish Confirmed — official entry into new uptrend
• Bearish Confirmed — official entry into new downtrend
You can set these alerts in TradingView to monitor across your chart or watchlist.
⸻
📈 How to Use in TradingView Pine Screener
Step 1: Create your own watchlist — for example, SPX500
Step 2: Favorite this indicator so it shows up in the screener
Step 3: Go to TradingView → Products → Screeners → Pine (Beta)
Step 4: Select this indicator and choose a condition, like “Bullish Confirmed”
Step 5: Click Scan
You’ll instantly see stocks that just flipped trends or are close to doing so.
⸻
⏰ When to Use the Screener
Use this screener after market close or before the next open to avoid intraday noise.
During the day, if a candle breaks both the high and low, the delta becomes 0, which may cancel a flip or primed signal.
Results during regular trading hours can change frequently. For best results, scan during stable periods like pre-market or after-hours.
⸻
🧪 Real-World Examples
SWK
NVR
WMT
UNH
Each of these examples shows clean, structured trend transitions detected in advance or confirmed with precision.
PLTR: complicated case primed for bullish (but we don't when it will flip)
⚠️ Risk Disclaimer & Trend Context
A confirmed bullish signal does not guarantee an immediate price increase. Price may continue to consolidate or even pull back after a bullish flip.
Likewise, a primed bullish signal does not always lead to confirmation. It simply means the conditions are close — but if the next bar breaks both the high and low, or breaks only the low, the flip will be canceled.
On the other side, a confirmed bearish signal does not mean the market will crash. If the overall trend is bullish (for example, tsScore has been rising for weeks), then a bearish flip may just represent a short-term pullback — not a trend reversal.
You always need to consider the overall market structure. If the long-term trend is bullish, it’s usually smarter to wait for bullish confirmation signals. Bearish flips in that context are often just dips — not opportunities to short.
This indicator gives you context, not predictions. It’s a tool for alignment — not absolute outcomes. Use it to follow structure, not fight it.
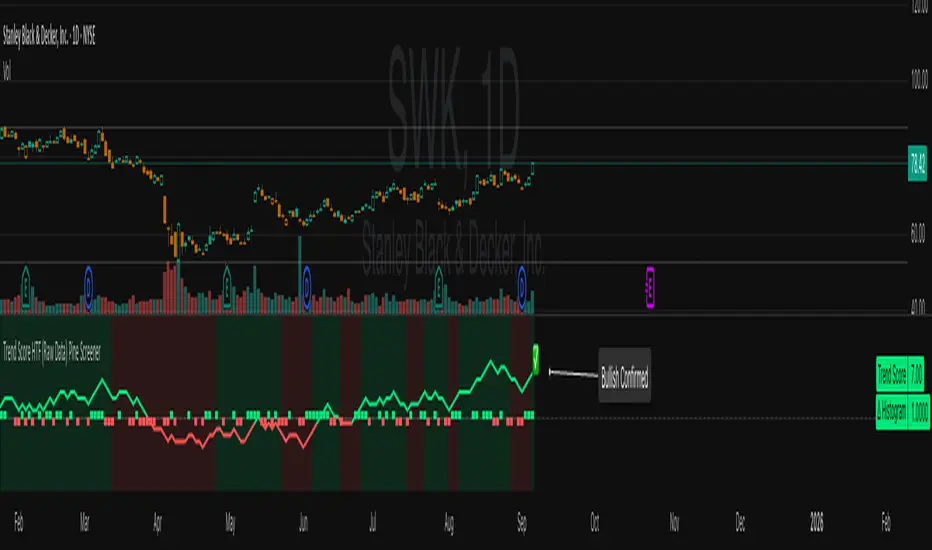
Screener based on Profitunity strategy for multiple timeframes
Screener based on Profitunity strategy by Bill Williams for multiple timeframes (max 5, including chart timeframe) and customizable symbol list. The screener analyzes the Alligator and Awesome Oscillator indicators, Divergent bars and high volume bars.
The maximum allowed number of requests (symbols and timeframes) is limited to 40 requests, for example, for 10 symbols by 4 requests of different timeframes. Therefore, the indicator automatically limits the number of displayed symbols depending on the number of timeframes for each symbol, if there are more symbols than are displayed in the screener table, then the ordinal numbers are displayed to the left of the symbols, in this case you can display the next group of symbols by increasing the value by 1 in the "Show tickers from" field, if the "Group" field is enabled, or specify the symbol number by 1 more than the last symbol in the screener table. 👀 When timeframe filtering is applied, the screener table displays only the columns of those timeframes for which the filtering value is selected, which allows displaying more symbols.
For each timeframe, in the "TIMEFRAMES > Prev" field, you can enable the display of data for the previous bar relative to the last (current) one, if the market is open for the requested symbol. In the "TIMEFRAMES > Y" field, you can enable filtering depending on the location of the last five bars relative to the Alligator indicator lines, which are designated by special symbols in the screener table:
⬆️ — if the Alligator is open upwards (Lips > Teeth > Jaw) and none of the bars is closed below the Lips line;
↗️ — if one of the bars, except for the penultimate one, is closed below Lips, or two bars, except for the last one, are closed below Lips, or the Alligator is open upwards only below four bars, but none of the bars is closed below Lips;
⬇️ — if the Alligator is open downwards (Lips < Teeth < Jaw), but none of the bars is closed above Lips;
↘️ — if one of the bars, except the penultimate one, is closed above the Lips, or two bars, except the last one, are closed above the Lips, or the Alligator is open down only above four bars, but none of the bars are closed above the Lips;
➡️ — in other cases, including when the Alligator lines intersect and one of the bars is closed behind the Lips line or two bars intersect one of the Alligator lines.
In the "TIMEFRAMES > Show bar change value for TF" field, you can add a column to the right of the selected timeframe column with the percentage change between the closing price of the last bar (current) and the closing price of the previous bar ((close – previous close) / previous close * 100). Depending on the percentage value, the background color of the screener table cell will change: dark red if <= -3%; red if <= -2%, light red if <= -0.5%; dark green if >= 3%; green if >= 2%; light green if >= 0.5%.
For each timeframe, the screener table displays the symbol of the latest (current) bar, depending on the closing price relative to the bar's midpoint ((high + low) / 2) and its location relative to the Alligator indicator lines: ⎾ — the bar's closing price is above its midpoint; ⎿ — the bar's closing price is below its midpoint; ├ — the bar's closing price is equal to its midpoint; 🟢 — Bullish Divergent bar, i.e. the bar's closing price is above its midpoint, the bar's high is below all Alligator lines, the bar's low is below the previous bar's low; 🔴 — Bearish Divergent bar, i.e. the bar's closing price is below its midpoint, the bar's low is above all Alligator lines, the bar's high is above the previous bar's high. When filtering is enabled in the "TIMEFRAMES > Filtering by Divergent bar" field, the data in the screener table cells will be displayed only for those timeframes that have a Divergent bar. A high bar volume signal is also displayed — 📶/📶² if the bar volume is greater than 40%/70% of the average volume value calculated using a simple moving average (SMA) in the 140 bar interval from the last bar.
In the indicator settings in the "SYMBOL LIST" field, each ticker (for example: OANDA:SPX500USD) must be on a separate line. If the market is closed, then the data for requested symbols will be limited to the time of the last (current) bar on the chart, for example, if the current symbol was traded yesterday, and the requested symbol is traded today, when requesting data for an hourly timeframe, the last bar will be for yesterday, if the timeframe of the current chart is not higher than 1 day. Therefore, by default, a warning will be displayed on the chart instead of the screener table that if the market is open, you must wait for the screener to load (after the first price change on the current chart), or if the highest timeframe in the screener is 1 day, you will be prompted to change the timeframe on the current chart to 1 week, if the screener requests data for the timeframe of 1 week, you will be prompted to change the timeframe on the current chart to 1 month, or switch to another symbol on the current chart for which the market is open (for example: BINANCE:BTCUSDT), or disable the warning in the field "SYMBOL LIST > Do not display screener if market is close".
The number of the last columns with the color of the AO indicator that will be displayed in the screener table for each timeframe is specified in the indicator settings in the "AWESOME OSCILLATOR > Number of columns" field.
For each timeframe, the direction of the trend between the price of the highest and lowest bars in the specified range of bars from the last bar is displayed — ↑ if the trend is up (the highest bar is to the right of the lowest), or ↓ if the trend is down (the lowest bar is to the right of the highest). If there is a divergence on the AO indicator in the specified interval, the symbol ∇ is also displayed. The average volume value is also calculated in the specified interval using a simple moving average (SMA). The number of bars is set in the indicator settings in the "INTERVAL FOR HIGHEST AND LOWEST BARS > Bars count" field.
In the indicator settings in the "STYLE" field you can change the position of the screener table relative to the chart window, the background color, the color and size of the text.
***
Скринер на основе стратегии Profitunity Билла Вильямса для нескольких таймфреймов (максимум 5, включая таймфрейм графика) и настраиваемого списка символов. Скринер анализирует индикаторы Alligator и Awesome Oscillator, Дивергентные бары и бары с высоким объемом.
Максимально допустимое количество запросов (символы и таймфреймы) ограничено 40 запросами, например, для 10 символов по 4 запроса разных таймфреймов. Поэтому в индикаторе автоматически ограничивается количество отображаемых символов в зависимости от количества таймфреймов для каждого символа, если символов больше чем отображено в таблице скринера, то слева от символов отображаются порядковые номера, в таком случае можно отобразить следующую группу символов, увеличив значение на 1 в настройках индикатора поле "Show tickers from", если включено поле "Group", или указать номер символа на 1 больше, чем последний символ в таблице скринера. 👀 Когда применяется фильтрация по таймфрейму, в таблице скринера отображаются только столбцы тех таймфреймов, для которых выбрано значение фильтрации, что позволяет отображать большее количество символов.
Для каждого таймфрейма в настройках индикатора в поле "TIMEFRAMES > Prev" можно включить отображение данных для предыдущего бара относительно последнего (текущего), если для запрашиваемого символа рынок открыт. В поле "TIMEFRAMES > Y" можно включить фильтрацию, в зависимости от расположения последних пяти баров относительно линий индикатора Alligator, которые обозначаются специальными символами в таблице скринера:
⬆️ — если Alligator открыт вверх (Lips > Teeth > Jaw) и ни один из баров не закрыт ниже линии Lips;
↗️ — если один из баров, кроме предпоследнего, закрыт ниже Lips, или два бара, кроме последнего, закрыты ниже Lips, или Alligator открыт вверх только ниже четырех баров, но ни один из баров не закрыт ниже Lips;
⬇️ — если Alligator открыт вниз (Lips < Teeth < Jaw), но ни один из баров не закрыт выше Lips;
↘️ — если один из баров, кроме предпоследнего, закрыт выше Lips, или два бара, кроме последнего, закрыты выше Lips, или Alligator открыт вниз только выше четырех баров, но ни один из баров не закрыт выше Lips;
➡️ — в остальных случаях, в то числе когда линии Alligator пересекаются и один из баров закрыт за линией Lips или два бара пересекают одну из линий Alligator.
В поле "TIMEFRAMES > Show bar change value for TF" можно добавить справа от выбранного столбца таймфрейма столбец с процентным изменением между ценой закрытия последнего бара (текущего) и ценой закрытия предыдущего бара ((close – previous close) / previous close * 100). В зависимости от величины процента будет меняться цвет фона ячейки таблицы скринера: темно-красный, если <= -3%; красный, если <= -2%, светло-красный, если <= -0.5%; темно-зеленый, если >= 3%; зеленый, если >= 2%; светло-зеленый, если >= 0.5%.
Для каждого таймфрейма в таблице скринера отображается символ последнего (текущего) бара, в зависимости от цены закрытия относительно середины бара ((high + low) / 2) и расположения относительно линий индикатора Alligator: ⎾ — цена закрытия бара выше его середины; ⎿ — цена закрытия бара ниже его середины; ├ — цена закрытия бара равна его середине; 🟢 — Бычий Дивергентный бар, т.е. цена закрытия бара выше его середины, максимум бара ниже всех линий Alligator, минимум бара ниже минимума предыдущего бара; 🔴 — Медвежий Дивергентный бар, т.е. цена закрытия бара ниже его середины, минимум бара выше всех линий Alligator, максимум бара выше максимума предыдущего бара. При включении фильтрации в поле "TIMEFRAMES > Filtering by Divergent bar" данные в ячейках таблицы скринера будут отображаться только для тех таймфреймов, где есть Дивергентный бар. Также отображается сигнал высокого объема бара — 📶/📶², если объем бара больше чем на 40%/70% среднего значения объема, рассчитанного с помощью простой скользящей средней (SMA) в интервале 140 баров от последнего бара.
В настройках индикатора в поле "SYMBOL LIST" каждый тикер (например: OANDA:SPX500USD) должен быть на отдельной строке. Если рынок закрыт, то данные для запрашиваемых символов будут ограничены временем последнего (текущего) бара на графике, например, если текущий символ торговался последний день вчера, а запрашиваемый символ торгуется сегодня, при запросе данных для часового таймфрейма, последний бар будет за вчерашний день, если таймфрейм текущего графика не выше 1 дня. Поэтому по умолчанию на графике будет отображаться предупреждение вместо таблицы скринера о том, что если рынок открыт, то необходимо дождаться загрузки скринера (после первого изменения цены на текущем графике), или если в скринере самый высокий таймфрейм 1 день, то будет предложено изменить на текущем графике таймфрейм на 1 неделю, если в скринере запрашиваются данные для таймфрейма 1 неделя, то будет предложено изменить на текущем графике таймфрейм на 1 месяц, или же переключиться на другой символ на текущем графике, для которого рынок открыт (например: BINANCE:BTCUSDT), или отключить предупреждение в поле "SYMBOL LIST > Do not display screener if market is close".
Количество последних столбцов с цветом индикатора AO, которые будут отображены в таблице скринера для каждого таймфрейма, указывается в настройках индикатора в поле "AWESOME OSCILLATOR > Number of columns".
Для каждого таймфрейма отображается направление тренда между ценой самого высокого и самого низкого баров в указанном интервале баров от последнего бара — ↑, если тренд направлен вверх (самый высокий бар справа от самого низкого), или ↓, если тренд направлен вниз (самый низкий бар справа от самого высокого). Если есть дивергенция на индикаторе AO в указанном интервале, то также отображается символ — ∇. В указанном интервале также рассчитывается среднее значение объема с помощью простой скользящей средней (SMA). Количество баров устанавливается в настройках индикатора в поле "INTERVAL FOR HIGHEST AND LOWEST BARS > Bars count".
В настройках индикатора в поле "STYLE" можно изменить положение таблицы скринера относительно окна графика, цвет фона, цвет и размер текста.

TTM Squeeze Value OscillatorThis indicator is specifically designed for use with TradingView's Stock Screener, not for chart analysis. It provides numerical values and binary signals that allow traders to efficiently scan stocks for specific TTM Squeeze conditions, momentum patterns, and EMA alignments.
What It Does
The TTM Squeeze Value Oscillator converts the popular TTM Squeeze indicator into a screenable format by outputting specific numerical values and binary signals (1 or 0) that can be filtered in TradingView's screener tool.
Key Features
1. TTM Squeeze Compression Levels
Value 0: Low Compression (Black) - Bollinger Bands inside outer Keltner Channels
Value 1: Mid Compression (Red) - Bollinger Bands inside middle Keltner Channels
Value 2: High Compression (Orange) - Bollinger Bands inside inner Keltner Channels
Value 3: Squeeze Fired (Green) - Bollinger Bands outside Keltner Channels
2. Momentum Analysis
Four distinct momentum conditions based on TTM Squeeze methodology:
Buy Momentum Increasing - Positive momentum growing stronger
Buy Momentum Decreasing - Positive momentum weakening
Sell Momentum Increasing - Negative momentum growing stronger
Sell Momentum Decreasing - Negative momentum weakening
3. EMA Stacking Analysis
Three EMA alignment patterns using 8, 21, and 48 period EMAs:
EMA Stacked Bullish - 8 EMA > 21 EMA > 48 EMA (uptrend alignment)
EMA Stacked Bearish - 8 EMA < 21 EMA < 48 EMA (downtrend alignment)
EMA Mixed - EMAs not in clear bullish or bearish alignment
4. Consecutive Day Counters
Tracks how many consecutive days each squeeze condition has persisted:
Low Compression Days
Mid Compression Days
High Compression Days
Squeeze Fired Days
5. Combined Signal Analysis
Pre-calculated combinations of squeeze conditions with momentum:
All squeeze levels combined with all four momentum conditions
16 total combined signals for advanced screening

IDKFAIDKFA - Advanced Order Blocks & Volume Profile with Market Structure Analysis
Why IDKFA?
Named after the legendary DOOM cheat code that gives players "all weapons and full ammo," IDKFA provides traders with a comprehensive arsenal of market analysis tools. Just as the cheat code arms players with everything needed for combat, this indicator equips traders with essential market structure tools: Order Blocks, Volume Profile, LVN/HVN areas, Fibonacci retracements, and intelligent buy/sell signals - all in one unified system.
Core Features
Order Blocks Detection
Automatically identifies institutional order blocks using pivot high/low analysis
Extends blocks dynamically until price interaction occurs
Bullish blocks (demand zones) and bearish blocks (supply zones)
Customizable opacity and extend functionality
Advanced Volume Profile
Real-time volume profile calculation for multiple session types
Point of Control (POC), Value Area High (VAH), and Value Area Low (VAL)
Mode 1: Side-by-side bull/bear volume display
Mode 2: Overlapped volume display with percentage analysis
Shows buying vs selling pressure at each price level
LVN/HVN Area Detection
Low Volume Nodes (LVN): Areas below VAL where price moves quickly
High Volume Nodes (HVN): Areas above VAH with strong resistance
NPOC (Naked Point of Control): Single print areas within Value Area
Volume-based gradient coloring shows relative activity levels
Smart Fibonacci Retracements
Auto-detects trend direction for proper fibonacci orientation
Dynamic color coding: Red levels in uptrends, Gold in downtrends
Special 88.6% level turns lime green in downtrends
Key levels: 23.6%, 38.2%, 50%, 61.8%, 65%, 78.6%, 88.6%
Intelligent Signal System
Works best on higher timeframes
Identifies high-probability reversal setups at key levels
Buy signals: Large bearish rejection followed by bullish reclaim
Sell signals: Large bullish rejection followed by bearish breakdown
Signals only trigger near significant support/resistance areas
Signal Analysis & Usage Guidelines
Buy Signal Mechanics
The buy signal triggers when:
Previous candle shows significant bearish movement (minimum ATR multiplier)
Current candle reclaims a configurable percentage of the previous candle's range
Price is near a key support level (order blocks, fibonacci, volume levels)
Sell Signal Mechanics
The sell signal triggers when:
Previous candle shows significant bullish movement (minimum ATR multiplier)
Current candle rejects below a configurable percentage of the previous candle's range
Price is near a key resistance level (order blocks, fibonacci, volume levels)
When to TAKE Signals
High Probability Buy Signals:
Signal appears AT or BELOW the VAL (Value Area Low)
Signal occurs at bullish order block confluence
Price is in LVN area below VAL (momentum acceleration zone)
Signal aligns with fibonacci 61.8% or 78.6% support
Multiple session POC levels provide support confluence
Previous session's VAL acting as current support
High Probability Sell Signals:
Signal appears AT or ABOVE the VAH (Value Area High)
Signal occurs at bearish order block confluence
Price is in HVN area above VAH (heavy resistance zone)
Signal aligns with fibonacci 61.8% or 78.6% resistance
Multiple session POC levels provide resistance confluence
Previous session's VAH acting as current resistance
When to AVOID Signals
Avoid Buy Signals When:
Signal appears ABOVE the VAH (buying into resistance)
Price is in HVN red zones (high volume resistance areas)
No clear support structure below current price
Volume profile shows heavy selling pressure (high bear percentages)
Signal occurs during low-volume periods between major sessions
Multiple bearish order blocks exist below current price
Avoid Sell Signals When:
Signal appears BELOW the VAL (selling into support)
Price is in LVN green zones (momentum could continue)
No clear resistance structure above current price
Volume profile shows heavy buying pressure (high bull percentages)
Signal occurs during Asian session ranges without clear direction
Multiple bullish order blocks exist above current price
Volume Profile Context for Signals
Understanding Bull/Bear Percentages:
70%+ Bull dominance at a level = Strong support expected
70%+ Bear dominance at a level = Strong resistance expected
50/50 Split = Neutral zone, less predictable
Use percentages to gauge conviction behind moves
POC (Point of Control) Interactions:
Signals above POC in uptrend = Higher probability
Signals below POC in downtrend = Higher probability
Signals against POC bias require extra confirmation
POC often acts as magnetic level for price return
Trading Strategies
Strategy 1: VAL/VAH Bounce Strategy
Wait for price to approach VAL (support) or VAH (resistance)
Look for signal confirmation at these critical levels
Enter with tight stops beyond the Value Area
Target opposite boundary or next session's levels
Strategy 2: Order Block + Volume Confluence
Identify order block alignment with VAL/VAH
Wait for signal within the confluence zone
Enter on signal with stop beyond order block
Use LVN areas as acceleration zones for targets
Strategy 3: LVN/HVN Strategy
LVN (Green) Areas: "Go Zones" - expect quick price movement through low volume
HVN (Red) Areas: "Stop Zones" - expect resistance and potential reversals
NPOC Areas: "Fill Zones" - price often returns to fill single print gaps
Strategy 4: Multi-Session Analysis
Use Daily/Weekly for major structure context
Use 4H for intermediate levels
Use 1H for precise entry timing
Ensure all timeframes align before taking signals
Strategy 5: Fibonacci + Volume Profile
Buy signals at 61.8% or 78.6% fibonacci near VAL
Sell signals at 61.8% or 78.6% fibonacci near VAH
Use 88.6% level as final support/resistance before major moves
50% level often aligns with POC for confluence
Signal Quality Assessment
Grade A Signals (Highest Probability):
Signal at VAL/VAH with order block confluence
Fibonacci level alignment (61.8%, 78.6%)
Volume profile shows 70%+ dominance in signal direction
Multiple timeframe structure alignment
Signal occurs during high-volume sessions (London/NY)
Grade B Signals (Moderate Probability):
Signal near POC with some confluence
Fibonacci 50% or 38.2% alignment
Mixed volume profile readings (50-70% dominance)
Some timeframe alignment present
Signal during overlap sessions
Grade C Signals (Lower Probability):
Signal with minimal confluence
Weak fibonacci alignment or none
Volume profile neutral or against signal
Conflicting timeframe signals
Signal during low-volume periods
Risk Management Guidelines
Position Sizing Based on Signal Quality:
Grade A: Standard position size
Grade B: Reduced position size (50-75%)
Grade C: Minimal position size (25%) or skip entirely
Stop Loss Placement:
Beyond order block boundaries
Outside Value Area (VAL/VAH)
Below/above fibonacci confluence levels
Account for session volatility ranges
Profit Targets:
First target: Opposite VAL/VAH boundary
Second target: Next session's key levels
Final target: Major order blocks or fibonacci extensions
Credits & Attribution
Original components derived from:
Market Sessions & Volume Profile by © Leviathan (Mozilla Public License 2.0)
Volume Profile elements inspired by @LonesomeTheBlue's volume profile script
Pivot Order Blocks by TradingWolf / © MensaTrader (Mozilla Public License 2.0)
Auto Fibonacci Retracement code (public domain)
Significant enhancements and modifications include:
Advanced LVN/HVN detection and visualization
Bull/Bear percentage analysis for Mode 2/3
Comprehensive alert system with market context
Integrated buy/sell signals at key levels
Performance optimizations and extended session support
Enhanced Mode 2/3 with percentage pressure analysis
Important Disclaimers
This indicator is a technical analysis tool designed for educational purposes. It does not provide financial advice, investment recommendations, or trading signals that guarantee profits. All trading involves substantial risk of loss, and past performance does not guarantee future results. Users should conduct their own research, understand the risks involved, and consider consulting with qualified financial advisors before making trading decisions. The signals and analysis provided are based on historical price patterns and volume data, which may not predict future market movements accurately.
Best Practices
Never trade signals blindly - always consider volume profile context
Wait for confluence between multiple tools before entering
Respect the Value Area - avoid buying above VAH or selling below VAL
Use session context - Asian ranges vs London/NY breakouts
Practice proper risk management - position size based on signal quality
Understand the bigger picture - use multiple timeframes for context
Remember: Like the IDKFA cheat code, having all the tools doesn't guarantee success. The key is learning to use them together effectively and understanding when NOT to take a signal is often more important than knowing when to take one.

Multi TF Oscillators Screener [TradingFinder] RSI / ATR / Stoch🔵 Introduction
The oscillator screener is designed to simplify multi-timeframe analysis by allowing traders and analysts to monitor one or multiple symbols across their preferred timeframes—all at the same time. Users can track a single symbol through various timeframes simultaneously or follow multiple symbols in selected intervals. This flexibility makes the tool highly effective for analyzing diverse markets concurrently.
At the core of this screener lie two essential oscillators: RSI (Relative Strength Index) and the Stochastic Oscillator. The RSI measures the speed and magnitude of recent price movements and helps identify overbought or oversold conditions.
It's one of the most reliable indicators for spotting potential reversals. The Stochastic Oscillator, on the other hand, compares the current price to recent highs and lows to detect momentum strength and potential trend shifts. It’s especially effective in identifying divergences and short-term reversal signals.
In addition to these two primary indicators, the screener also displays helpful supplementary data such as the dominant candlestick type (Bullish, Bearish, or Doji), market volatility indicators like ATR and TR, and the four key OHLC prices (Open, High, Low, Close) for each symbol and timeframe. This combination of data gives users a comprehensive technical view and allows for quick, side-by-side comparison of symbols and timeframes.
🔵 How to Use
This tool is built for users who want to view the behavior of a single symbol across several timeframes simultaneously. Instead of jumping between charts, users can quickly grasp the state of a symbol like gold or Bitcoin across the 15-minute, 1-hour, and daily timeframes at a glance. This is particularly useful for traders who rely on multi-timeframe confirmation to strengthen their analysis and decision-making.
The tool also supports simultaneous monitoring of multiple symbols. Users can select and track various assets based on the timeframes that matter most to them. For example, if you’re looking for entry opportunities, the screener allows you to compare setups across several markets side by side—making it easier to choose the most favorable trade. Whether you’re a scalper focused on low timeframes or a swing trader using higher ones, the tool adapts to your workflow.
The screener utilizes the widely-used RSI indicator, which ranges from 0 to 100 and highlights market exhaustion levels. Readings above 70 typically indicate potential pullbacks, while values below 30 may suggest bullish reversals. Viewing RSI across timeframes can reveal meaningful divergences or alignments that improve signal quality.
Another key indicator in the screener is the Stochastic Oscillator, which analyzes the closing price relative to its recent high-low range. When the %K and %D lines converge and cross within the overbought or oversold zones, it often signals a momentum reversal. This oscillator is especially responsive in lower timeframes, making it ideal for spotting quick entries or exits.
Beyond these oscillators, the table includes other valuable data such as candlestick type (bullish, bearish, or doji), volatility measures like ATR and TR, and complete OHLC pricing. This layered approach helps users understand both market momentum and structure at a glance.
Ultimately, this screener allows analysts and traders to gain a full market overview with just one look—empowering faster, more informed, and lower-risk decision-making. It not only saves time but also enhances the precision and clarity of technical analysis.
🔵 Settings
🟣 Display Settings
Table Size : Lets you adjust the table’s visual size with options such as: auto, tiny, small, normal, large, huge.
Table Position : Sets the screen location of the table. Choose from 9 possible positions, combining vertical (top, middle, bottom) and horizontal (left, center, right) alignments.
🟣 Symbol Settings
Each of the 10 symbol slots comes with a full set of customizable parameters :
Enable Symbol : A checkbox to activate or hide each symbol from the table.
Symbol : Define or select the asset (e.g., XAUUSD, BTCUSD, EURUSD, etc.).
Timeframe : Set your desired timeframe for each symbol (e.g., 15, 60, 240, 1D).
RSI Length : Defines the period used in RSI calculation (default is 14).
Stochastic Length : Sets the period for the Stochastic Oscillator.
ATR Length : Sets the length used to calculate the Average True Range, a key volatility metric.
🔵 Conclusion
By combining powerful oscillators like RSI and Stochastic with full customization over symbols and timeframes, this tool provides a fast, flexible solution for technical analysts. Users can instantly monitor one or several assets across multiple timeframes without opening separate charts.
Individual configuration for each symbol, along with the inclusion of key metrics like candlestick type, ATR/TR, and OHLC prices, makes the tool suitable for a wide range of trading styles—from scalping to swing and position trading.
In summary, this screener enables traders to gain a clear, high-level view of various markets in seconds and make quicker, smarter, and lower-risk decisions. It saves time, streamlines analysis, and boosts overall efficiency and confidence in trading strategies.
