[GYTS] VolatilityToolkit LibraryVolatilityToolkit Library
🌸 Part of GoemonYae Trading System (GYTS) 🌸
🌸 --------- INTRODUCTION --------- 🌸
💮 What Does This Library Contain?
VolatilityToolkit provides a comprehensive suite of volatility estimation functions derived from academic research in financial econometrics. Rather than relying on simplistic measures, this library implements range-based estimators that extract maximum information from OHLC data — delivering estimates that are 5–14× more efficient than traditional close-to-close methods.
The library spans the full volatility workflow: estimation, smoothing, and regime detection.
💮 Key Categories
• Range-Based Estimators — Parkinson, Garman-Klass, Rogers-Satchell, Yang-Zhang (academically-grounded variance estimators)
• Classical Measures — Close-to-Close, ATR, Chaikin Volatility (baseline and price-unit measures)
• Smoothing & Post-Processing — Asymmetric EWMA for differential decay rates
• Aggregation & Regime Detection — Multi-horizon blending, MTF aggregation, Volatility Burst Ratio
💮 Originality
To the best of our knowledge, no other TradingView script combines range-based estimators (Parkinson, Garman-Klass, Rogers-Satchell, Yang-Zhang), classical measures, and regime detection tools in a single package. Unlike typical volatility implementations that offer only a single method, this library:
• Implements four academically-grounded range-based estimators with proper mathematical foundations
• Handles drift bias and overnight gaps, issues that plague simpler estimators in trending markets
• Integrates with GYTS FiltersToolkit for advanced smoothing (10 filter types vs. typical SMA-only)
• Provides regime detection tools (Burst Ratio, MTF aggregation) for systematic strategy integration
• Standardises output units for seamless estimator comparison and swapping
🌸 --------- ADDED VALUE --------- 🌸
💮 Academic Rigour
Each estimator implements peer-reviewed methodologies with proper mathematical foundations. The library handles aspects that are easily missed, e.g. drift independence, overnight gap adjustment, and optimal weighting factors. All functions include guards against edge cases (division by zero, negative variance floors, warmup handling).
💮 Statistical Efficiency
Range-based estimators extract more information from the same data. Yang-Zhang achieves up to 14× the efficiency of close-to-close variance, meaning you can achieve the same estimation accuracy with far fewer bars — critical for adapting quickly to changing market conditions.
💮 Flexible Smoothing
All estimators support configurable smoothing via the GYTS FiltersToolkit integration. Choose from 10 filter types to balance responsiveness against noise reduction:
• Ultimate Smoother (2-Pole / 3-Pole) — Near-zero lag; the 3-pole variant is a GYTS design with tunable overshoot
• Super Smoother (2-Pole / 3-Pole) — Excellent noise reduction with minimal lag
• BiQuad — Second-order IIR filter with quality factor control
• ADXvma — Adaptive smoothing based on directional volatility
• MAMA — Cycle-adaptive moving average
• A2RMA — Adaptive autonomous recursive moving average
• SMA / EMA — Classical averages (SMA is default for most estimators)
Using Infinite Impulse Response (IIR) filters (e.g. Super Smoother, Ultimate Smoother) instead of SMA avoids the "drop-off artefact" where volatility readings crash when old spikes exit the window.
💮 Plug-and-Play Integration
Standardised output units (per-bar log-return volatility) make it trivial to swap estimators. The annualize() helper converts to yearly volatility with a single call. All functions work seamlessly with other GYTS components.
🌸 --------- RANGE-BASED ESTIMATORS --------- 🌸
These estimators utilise High, Low, Open, and Close prices to extract significantly more information about the underlying diffusion process than close-only methods.
💮 parkinson()
The Extreme Value Method -- approximately 5× more efficient than close-to-close, requiring about 80% less data for equivalent accuracy. Uses only the High-Low range, making it simple and robust.
• Assumption: Zero drift (random walk). May be biased in strongly trending markets.
• Best for: Quick volatility reads when drift is minimal.
• Parameters: smoothing_length (default 14), filter_type (default SMA), smoothing_factor (default 0.7)
Source: Parkinson, M. (1980). The Extreme Value Method for Estimating the Variance of the Rate of Return. Journal of Business, 53 (1), 61–65. DOI
💮 garman_klass()
Extends Parkinson by incorporating Open and Close prices, achieving approximately 7.4× efficiency over close-to-close. Implements the "practical" analytic estimator (σ̂²₅) which avoids cross-product terms whilst maintaining near-optimal efficiency.
• Assumption: Zero drift, continuous trading (no gaps).
• Best for: Markets with minimal overnight gaps and ranging conditions.
• Parameters: smoothing_length (default 14), filter_type (default SMA), smoothing_factor (default 0.7)
Source: Garman, M.B. & Klass, M.J. (1980). On the Estimation of Security Price Volatilities from Historical Data. Journal of Business, 53 (1), 67–78. DOI
💮 rogers_satchell()
The drift-independent estimator correctly isolates variance even in strongly trending markets where Parkinson and Garman-Klass become significantly biased. Uses the formula: ln(H/C)·ln(H/O) + ln(L/C)·ln(L/O).
• Key advantage: Unbiased regardless of trend direction or magnitude.
• Best for: Trending markets, crypto (24/7 trading with minimal gaps), general-purpose use.
• Parameters: smoothing_length (default 14), filter_type (default SMA), smoothing_factor (default 0.7)
Source: Rogers, L.C.G. & Satchell, S.E. (1991). Estimating Variance from High, Low and Closing Prices. Annals of Applied Probability, 1 (4), 504–512. DOI
💮 yang_zhang()
The minimum-variance composite estimator — both drift-independent AND gap-aware. Combines overnight returns, open-to-close returns, and the Rogers-Satchell component with optimal weighting to minimise estimator variance. Up to 14× more efficient than close-to-close.
• Parameters: lookback (default 14, minimum 2), alpha (default 1.34, optimised for equities).
• Best for: Equity markets with significant overnight gaps, highest-quality volatility estimation.
• Note: Unlike other estimators, Yang-Zhang does not support custom filter types — it uses rolling sample variance internally.
Source: Yang, D. & Zhang, Q. (2000). Drift-Independent Volatility Estimation Based on High, Low, Open, and Close Prices. Journal of Business, 73 (3), 477–491. DOI
🌸 --------- CLASSICAL MEASURES --------- 🌸
💮 close_to_close()
Classical sample variance of logarithmic returns. Provided primarily as a baseline benchmark — it is approximately 5–8× less efficient than range-based estimators, requiring proportionally more data for the same accuracy.
• Parameters: lookback (default 14), filter_type (default SMA), smoothing_factor (default 0.7)
• Use case: Comparison baseline, situations requiring strict methodological consistency with academic literature.
💮 atr()
Average True Range -- measures volatility in price units rather than log-returns. Directly interpretable for stop-loss placement (e.g., "2× ATR trailing stop") and handles gaps naturally via the True Range formula.
• Output: Price units (not comparable across different price levels).
• Parameters: smoothing_length (default 14), filter_type (default SMA), smoothing_factor (default 0.7)
• Best for: Position sizing, trailing stops, any application requiring volatility in currency terms.
Source: Wilder, J.W. (1978). New Concepts in Technical Trading Systems . Trend Research.
💮 chaikin_volatility()
Rate of Change of the smoothed trading range. Unlike level-based measures, Chaikin Volatility shows whether volatility is expanding or contracting relative to recent history.
• Output: Percentage change (oscillates around zero).
• Parameters: length (default 10), roc_length (default 10), filter_type (default EMA), smoothing_factor (default 0.7)
• Interpretation: High values suggest nervous, wide-ranging markets; low values indicate compression.
• Best for: Detecting volatility regime shifts, breakout anticipation.
🌸 --------- SMOOTHING & POST-PROCESSING --------- 🌸
💮 asymmetric_ewma()
Differential smoothing with separate alphas for rising versus falling volatility. Allows volatility to spike quickly (fast reaction to shocks) whilst decaying slowly (stability). Essential for trailing stops that should widen rapidly during turbulence but narrow gradually.
• Parameters: alpha_up (default 0.1), alpha_down (default 0.02).
• Note: Stateful function — call exactly once per bar.
💮 annualize()
Converts per-bar volatility to annualised volatility using the square-root-of-time rule: σ_annual = σ_bar × √(periods_per_year).
• Parameters: vol (series float), periods (default 252 for daily equity bars).
• Common values: 365 (crypto), 52 (weekly), 12 (monthly).
🌸 --------- AGGREGATION & REGIME DETECTION --------- 🌸
💮 weighted_horizon_volatility()
Blends volatility readings across short, medium, and long lookback horizons. Inspired by the Heterogeneous Autoregressive (HAR-RV) model's recognition that market participants operate on different time scales.
• Default horizons: 1-bar (short), 5-bar (medium), 22-bar (long).
• Default weights: 0.5, 0.3, 0.2.
• Note: This is a weighted trailing average, not a forecasting regression. For true HAR-RV forecasting, it would be required to fit regression coefficients.
Inspired by: Corsi, F. (2009). A Simple Approximate Long-Memory Model of Realized Volatility. Journal of Financial Econometrics .
💮 volatility_mtf()
Multi-timeframe aggregation for intraday charts. Combines base volatility with higher-timeframe (Daily, Weekly, Monthly) readings, automatically scaling HTF volatilities down to the current timeframe's magnitude using the square-root-of-time rule.
• Usage: Calculate HTF volatilities via request.security() externally, then pass to this function.
• Behaviour: Returns base volatility unchanged on Daily+ timeframes (MTF aggregation not applicable).
💮 volatility_burst_ratio()
Regime shift detector comparing short-term to long-term volatility.
• Parameters: short_period (default 8), long_period (default 50), filter_type (default Super Smoother 2-Pole), smoothing_factor (default 0.7)
• Interpretation: Ratio > 1.0 indicates expanding volatility; values > 1.5 often precede or accompany explosive breakouts.
• Best for: Filtering entries (e.g., "only enter if volatility is expanding"), dynamic risk adjustment, breakout confirmation.
🌸 --------- PRACTICAL USAGE NOTES --------- 🌸
💮 Choosing an Estimator
• Trending equities with gaps: yang_zhang() — handles both drift and overnight gaps optimally.
• Crypto (24/7 trading): rogers_satchell() — drift-independent without the lag of Yang-Zhang's multi-period window.
• Ranging markets: garman_klass() or parkinson() — simpler, no drift adjustment needed.
• Price-based stops: atr() — output in price units, directly usable for stop distances.
• Regime detection: Combine any estimator with volatility_burst_ratio().
💮 Output Units
All range-based estimators output per-bar volatility in log-return units (standard deviation). To convert to annualised percentage volatility (the convention in options and risk management), use:
vol_annual = annualize(yang_zhang(14), 252) // For daily bars
vol_percent = vol_annual * 100 // Express as percentage
💮 Smoothing Selection
The library integrates with FiltersToolkit for flexible smoothing. General guidance:
• SMA: Classical, statistically valid, but suffers from "drop-off" artefacts when spikes exit the window.
• Super Smoother / Ultimate Smoother / BiQuad: Natural decay, reduced lag — preferred for trading applications.
• MAMA / ADXvma / A2RMA: Adaptive smoothing, sometimes interesting for highly dynamic environments.
💮 Edge Cases and Limitations
• Flat candles: Guards prevent log(0) errors, but single-tick bars produce near-zero variance readings.
• Illiquid assets: Discretisation bias causes underestimation when ticks-per-bar is small. Use higher timeframes for more reliable estimates.
• Yang-Zhang minimum: Requires lookback ≥ 2 (enforced internally). Cannot produce instantaneous readings.
• Drift in Parkinson/GK: These estimators overestimate variance in trending conditions — switch to Rogers-Satchell or Yang-Zhang.
Note: This library is actively maintained. Suggestions for additional estimators or improvements are welcome.
Rogersatchell

[Pandora] Vast Volatility Treasure TroveINTRODUCTION:
Volatility enthusiasts, prepare for VICTORY on this day of July 4th, 2024! This is my "Vast Volatility Treasure Trove," intended mostly for educational purposes, yet these functions will also exhibit versatility when combined with other algorithms to garner statistical excellence. Once again, I am now ripping the lid off of Pandora's box... of volatility. Inside this script is a 'vast' collection of volatility estimators, reflecting the indicators name. Whether you are a seasoned trader destined to navigate financial strife or an eagerly curious learner, this script offers a comprehensive toolkit for a broad spectrum of volatility analysis. Enjoy your journey through the realm of market volatility with this code!
WHAT IS MARKET VOLATILITY?:
Market volatility refers to various fluctuations in the value of a financial market or asset over a period of time, often characterized by occasional rapid and significant deviations in price. During periods of greater market volatility, evolving conditions of prices can move rapidly in either direction, creating uncertainty for investors with results of sharp declines as well as rapid gains. However, market volatility is a typical aspect expected in financial markets that can also present opportunities for informed decision-making and potential benefits from the price flux.
SCRIPT INTENTION:
Volatility is assuredly omnipresent, waxing and waning in magnitude, and some readers have every intention of studying and/or measuring it. This script serves as an all-in-one armada of volatility estimators for TradingView members. I set out to provide a diverse set of tools to analyze and interpret market volatility, offering volatile insights, and aid with the development of robust trading indicators and strategies.
In today's fast-paced financial markets, understanding and quantifying volatility is informative for both seasoned traders and novice investors. This script is designed to empower users by equipping them with a comprehensive suite of volatility estimators. Each function within this script has been meticulously crafted to address various aspects of volatility, from traditional methods like Garman-Klass and Parkinson to more advanced techniques like Yang-Zhang and my custom experimental algorithms.
Ultimately, this script is more than just a collection of functions. It is a gateway to a deeper understanding of market volatility and a valuable resource for anyone committed to mastering the complexities of financial markets.
SCRIPT CONTENTS:
This script includes a variety of functions designed to measure and analyze market volatility. Where applicable, an input checkbox option provides an unbiased/biased estimate. Below is a brief description of each function in the original order they appear as code upon first publish:
Parkinson Volatility - Estimates volatility emphasizing the high and low range movements.
Alternate Parkinson Volatility - Simpler version of the original Parkinson Volatility that I realized.
Garman-Klass Volatility - Estimates volatility based on high, low, open, and close prices using a formula that adjusts for biases in price dynamics.
Rogers-Satchell-Yoon Volatility #1 - Estimates volatility based on logarithmic differences between high, low, open, and close values.
Rogers-Satchell-Yoon Volatility #2 - Similar estimate to Rogers-Satchell with the same result via an alternate formulation of volatility.
Yang-Zhang Volatility - An advanced volatility estimate combining both strengths of the Garman-Klass and Rogers-Satchell estimators, with weights determined by an alpha parameter.
Yang-Zhang (Modified) Volatility - My experimental modification slightly different from the Yang-Zhang formula with improved computational efficiency.
Selectable Volatility - Basic customizable volatility calculation based on the logarithmic difference between selected numerator and denominator prices (e.g., open, high, low, close).
Close-to-Close Volatility - Estimates volatility using the logarithmic difference between consecutive closing prices. Specifically applicable to data sources without open, high, and low prices.
Open-to-Close Volatility - (Overnight Volatility): Estimates volatility based on the logarithmic difference between the opening price and the last closing price emphasizing overnight gaps.
Hilo Volatility - Estimates volatility using a method similar to Parkinson's method, which considers the logarithm of the high and low prices.
Vantage Volatility - My experimental custom 'vantage' method to estimate volatility similar to Yang-Zhang, which incorporates various factors (Alpha, Beta, Gamma) to generate a weighted logarithmic calculation. This may be a volatility advantage or disadvantage, hence it's name.
Schwert Volatility - Estimates volatility based on arithmetic returns.
Historical Volatility - Estimates volatility considering logarithmic returns.
Annualized Historical Volatility - Estimates annualized volatility using logarithmic returns, adjusted for the number of trading days in a year.
If I omitted any other known varieties, detailed requests for future consideration can be made below for their inclusion into this script within future versions...
BONUS ALGORITHMS:
This script also includes several experimental and bonus functions that push the boundaries of volatility analysis as I understand it. These functions are designed to provide additional insights and also are my ideal notions for traders looking to explore other methods of volatility measurement.
VOLATILITY APPLICATIONS:
Volatility estimators serve a common role across various facets of trading and financial analysis, offering insights into market behavior. These tools are already in instrumental with enhancing risk management practices by providing a deeper understanding of market dynamics and the inherent uncertainty in asset prices. With volatility estimators, traders can effectively quantifying market risk and adjust their strategies accordingly, optimizing portfolio performance and mitigating potential losses. Additionally, volatility estimations may serve as indication for detecting overbought or oversold market conditions, offering probabilistic insights that could inform strategic decisions at turning points. This script
distinctly offers a variety of volatility estimators to navigate intricate financial terrains with informed judgment to address challenges of strategic planning.
CODE REUSE:
You don't have to ask for my permission to use/reuse these functions in your published scripts, simply because I have better things to do than answer requests for the reuse of these functions.
Notice: Unfortunately, I will not provide any integration support into member's projects at all. I have my own projects that require way too much of my day already.

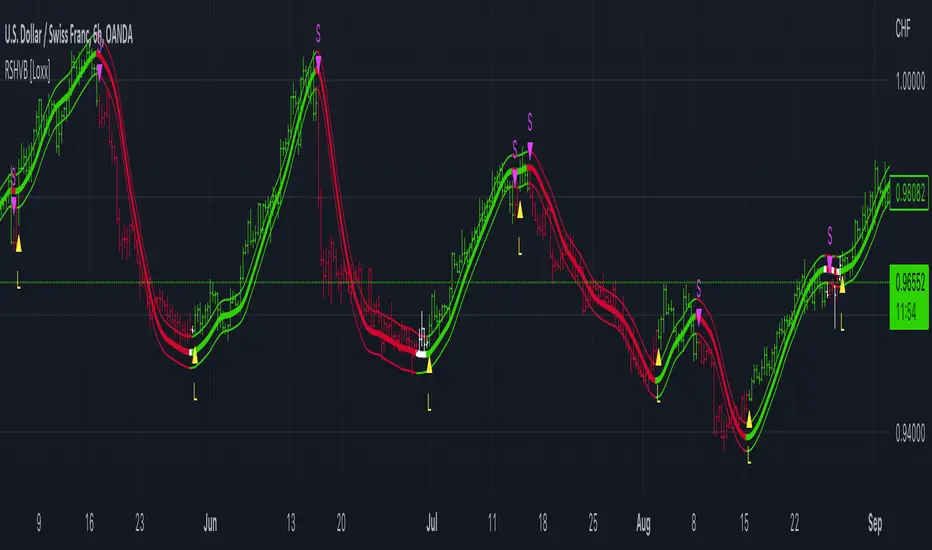
Roger & Satchell Estimator Historical Volatility Bands [Loxx]Roger & Satchell Estimator Historical Volatility Bands are constructed using:
Average as the middle line.
Upper and lower bands using theRoger & Satchell Estimator Historical Volatility Bands for bands calculation.
What is Roger & Satchell Estimator Historical Volatility?
The Rogers–Satchell estimator does not handle opening jumps; therefore, it underestimates the volatility. It accurately explains the volatility portion that can be attributed entirely to a trend in the price evolution. Rogers and Satchell try to embody the frequency of price observations in the model in order to overcome the drawback. They claim that the corrected estimator outperforms the uncorrected one in a study based on simulated data.
RSEHV = sqrt((Z/n) * sum((log(high/close)*log(high/open)) + (log(low/close)*log(low/open))))
The color of the middle line, unlike the bands colors, has 3 colors. When colors of the bands are the same, then the middle line has the same color, otherwise it's white.
Included
Alerts
Signals
Loxx's Expanded Source Types
Bar coloring