Lines and Table for risk managementABOUT THIS INDICATOR
This is a simple indicator that can help you manage the risk when you are trading, and especially if you are leverage trading. The indicator can also be used to help visualize and to find trades within a suitable or predefined trading range.
This script calculates and draws six “profit and risk lines” (levels) that show the change in percentage from the current price. The values are also shown in a table, to help you get a quick overview of risk before you trade.
ABOUT THE LINES/VALUES
This indicator draws seven percentage-lines, where the dotted line in the middle represents the current price. The other three lines on top of and below the middle line shows the different levels of change in percentage from current price (dotted line). The values are also shown in a table.
DEFAULT VALUES AND SETTINGS
By default the indicator draw lines 0.5%, 1.0%, and 1.5% from current price (step size = 0.5).
The default setting for leverage in this indicator = 1 (i.e. no leverage).
The line closest to dotted line (current price) is calculated by step size (%) * leverage (x) = % from price.
Pay attention to the %-values in the table, they represent the distance from the current price (dotted line) to where the lines are drawn.
* Be aware! If you change the leverage, the distance from the closest lines to the dotted line showing the current price increase.
SETTINGS
1. Leverage: set the leverage for what you are planning to trade on (1 = no leverage, 2 = 2 x leverage, 5 = 5 x leverage...).
2. Stepsize is used to set the distance between the lines and price.
EXAMPLES WITH DIFFERENT SETTINGS
1) Leverage = 1 (no leverage, default setting) and step size 0.5 (%). Lines plotted at (0.5%, 1%, 1.5%, and –0.5%, –1%, –1,5%) from the current price.
2) Leverage = 3 and stepsize 0.5(%). Lines plotted at (1.5%, 3.0%, 4.5%, and –1.5%, –3.0%, –4.5%) from the current price.
3) Leverage = 3 and stepsize 1(%). Lines plotted at (3%, 6%, 9%, and –3%, –6%, –9%) from the current price.
The distance to the nearest line from the current price is always calculated by the formula: Leverage * step size (%) = % to the nearest line from the current price.
Riskreward

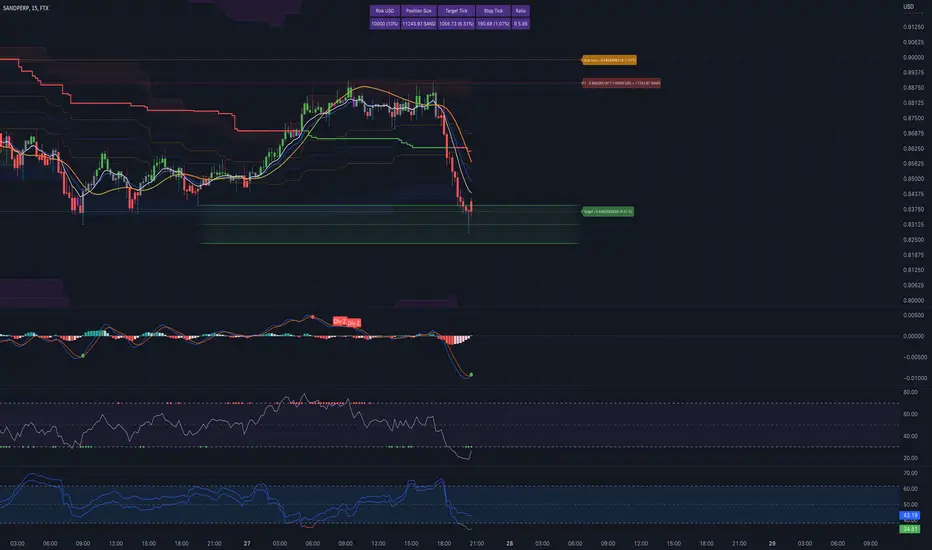
Position Size ToolUpdated - Version 2
This tool is used to calculate the size of a trade.
Settings - Type in total account size and % of capital that can be risked on each trade.
The table will display:
Column 1 - Stop placement based on low, mid or high value of the current candle.
Column 2 - Percent risk on the trade.
Column 3 - Amount of shares that can be traded (calculated from account size, risk and selected stop placement).
Green color is intended for long position, stop at the low of the candle.
Red color is intended for short position, stop at the high of the candle.
Middle value can shift between either color since its measured from open to close.

Auto Risk Reward CalculatorAuto RR Calculator
Gives you the price of certain risk to rewards based on your entry and stop loss inputs.
The information given by this tool does not constitute as financial advice.
Trend & atr day & calcHi!
Why for what and how in this script?
At the time of publication the script consists of three modules, it may increase in the future.
1. Bottom left corner : daytime ATR module
(idea and basis of the author's script - ???)
- The size of the daily ATR based on 14 bars;
- intraday ATR progress;
- colour indication of the progress status, for easier visual perception (green < 70%, yellow 70-90 and red over 90% of ATR)
By evaluating the progress of the daily ATR, it is possible to suggest and expedient to enter/exit/hold a trade.
2. Top right: trend module
The trend is calculated based on Bill Williams' alligator indicator
- trend status on specified timeframes for the current ticker;
- colour indication for visual perception (green - growing trend, yellow - alligator is sleeping, red - downtrend)
Do not forget that the alligator is based on moving averages with the resulting consequences.
Its purpose is to assess the state of the trend on other ticker TFs, without additional actions (switching to another screen or TF)
3. In the bottom left corner - risk and position calculator
(based on an idea of the risk calculator by @andrei.bunulu)
It helps to determine the advisability of entering the trade and also what size position to enter into the trade, within money management strategy chosen.
- The calculator works in two directions: long deal and short deal (short deal calculation is enabled by check-box in settings)
- two calculation methods:
a. based on the set stop loss % (default is 0.3%), in this mode the stop and takeout level is automatically calculated (default is 1 / 3).
b. by entering the desired price levels (entry, stop and take profit points)
To make this work correctly please do not forget to choose the type of calculation (% or price) in the settings, and the currency symbol (for visual representation in the results).
The calculator can take into account the set commissions and spreads.
When hovering over the module - tooltips are displayed.
Each module can be enabled / disabled in the settings.
The size and arrangement of the modules is made for joint use with the script - "Abnormal Bar".
/// а по-русски это так ///
Привет!
Зачем для чего и как в этом скрипте?
На момент публикации скрипт состоит из трех модулей, возможно в будущем увеличится.
1. В левом нижнем углу : модуль дневного ATR
(идея и основа скрипт автора - ???)
- размер дневной ATR на основании 14 баров;
- прогресс ATR внутри дня;
- цветовая индикация состояния прогресса, для более простого визуального восприятия (зеленый < 70%, желтый 70-90 и красный более 90% ATR)
Оценивая прогресс дневного ATR, можно предположить и целесообразности входа / выхода / удержания из сделки.
2. В правом верхнем углу: модуль тренда
Тренд рассчитывается на основе индикатора - аллигатор Билла Вильямса
- состояние тренда на указанных таймфреймах для текущего тикера;
- цветовая индикация для визуального восприятия (зеленый - растущий тренд, желтый - аллигатор спит, красный - нисходящий тренд)
Не забываем, что аллигатор построен на основе скользящих средних с вытекающими последствиями.
Назначение - оценить состояние тренда на других ТФ тикера, без дополнительных действий (переключения на другой экран или ТФ)
3. В нижнем левом углу - калькулятор рисков и позиции
(на основе идеи калькулятора аuthor: @andrei.bunulu)
Помогает определить целесообразность входа в сделку, а также каким размером позиции входить в сделку, в рамках выбранной стратегии мани менеджмента.
- калькулятор работает в два направления: длинная и короткая сделка (расчет по короткой включается в настройках чек-боксом)
- два варианта расчета:
а. на основании установленного % стоп лосса (по-умолчанию 0,3%), при этом режиме происходит автоматический расчет уровня стопа и тейка (по умолчанию 1 / 3).
b. путем ввода данных желаемых уровней цены (точки входа, стопа и тейк профита)
Для корректной работы не забываем в настройках выбирать тип расчета (% или цена), а также символ валюты (для визуального отображения в итогах).
Калькулятор может учитывать установленный размер комиссий и спреда.
При наведении на модуль - отображаются подсказки.
Каждый модуль можно включить / выключить в настройках.
Размер и расположение модулей сделано для совместного использования со скриптом - "Abnormal Bar"

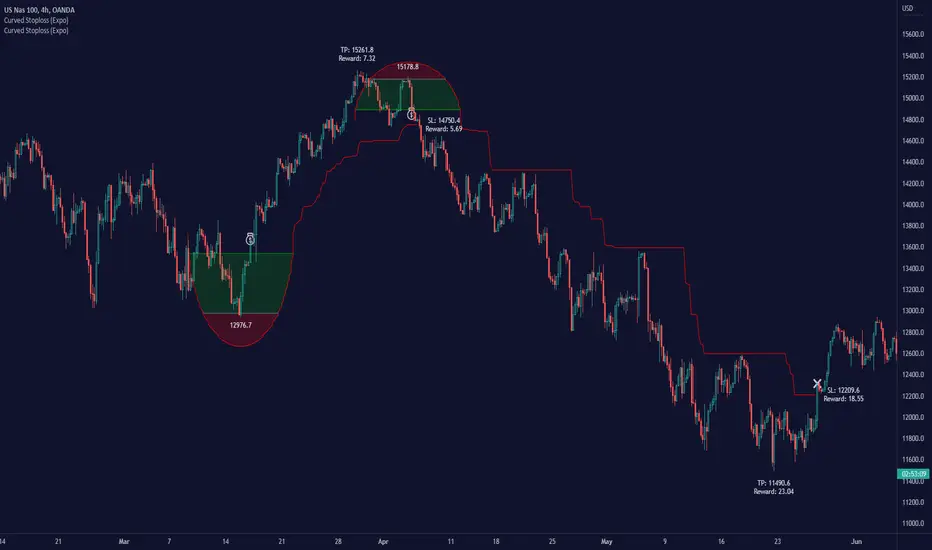
Curved Stop Loss (Expo)█ Overview
Curved Stop Loss (Expo) automatically calculates the best stop-loss distance based on real-time momentum and volatility. Once the algorithm has analyzed the current market characteristics, a curved stop loss is placed on the chart. As a result, the trader can be confident that the stop loss is based on data insights. One of the key elements of a curved stop loss is that it ensures that the trade can either be stopped with a profit or only with a minor loss without compromising the profit potential. Hence, using the Curved Stop Loss makes a massive difference in the overall results.
█ Why is this tool needed?
Risk management is a key concept to grasp and use in your trading, and it's one of the most critical aspects that will determine your long-term success in this industry. The market is uncertain, and it's impossible to know what the future holds. The only way to take control of the unknown is to have a proper risk management system that ensures you don't blow your account in one trade. Therefore, all traders need to understand the importance of using a risk- and money-management tool that calculates and provides stop-loss and take-profit levels in real-time. This way, you will always know where to take your stop loss and secure profit.
█ How to use
This Curved Stop Loss helps traders set a stop loss based on current momentum and volatility. It can be used to minimize your risk and maximize your profit potential.
-----------------
Disclaimer
The information contained in my Scripts/Indicators/Ideas/Algos/Systems does not constitute financial advice or a solicitation to buy or sell any securities of any type. I will not accept liability for any loss or damage, including without limitation any loss of profit, which may arise directly or indirectly from the use of or reliance on such information.
All investments involve risk, and the past performance of a security, industry, sector, market, financial product, trading strategy, backtest, or individual's trading does not guarantee future results or returns. Investors are fully responsible for any investment decisions they make. Such decisions should be based solely on an evaluation of their financial circumstances, investment objectives, risk tolerance, and liquidity needs.
My Scripts/Indicators/Ideas/Algos/Systems are only for educational purposes!
[fpemehd] Strategy TemplateHello Guys! Nice to meet you all!
This is my fourth script!
This is the Strategy Template for traders who wants to make their own strategy.
I made this based on the open source strategies by jason5480, kevinmck100, myncrypto. Thank you All!
### StopLoss
1. Can Choose Stop Loss Type: Percent, ATR, Previous Low / High.
2. Can Chosse inputs of each Stop Loss Type.
### Take Profit
1. Can set Risk Reward Ratio for Take Profit.
- To simplify backtest, I erased all other options except RR Ratio.
- You can add Take Profit Logic by adding options in the code.
2. Can set Take Profit Quantity.
### Risk Manangement
1. Can choose whether to use Risk Manangement Logic.
- This controls the Quantity of the Entry.
- e.g. If you want to take 3% risk per trade and stop loss price is 6% below the long entry price,
then 50% of your equity will be used for trade.
2. Can choose How much risk you would take per trade.
### Plot
1. Added Labels to check the data of entry / exit positions.
2. Changed and Added color different from the original one. (green: #02732A, red: #D92332, yellow: #F2E313)

Interactive Lot/Position Calculator FTX/OKX DCA [RDM13-NOSTRA] Interactive script to calculate lot and position size when you use TradingView to trade on FTX or OKX. You can also use multi positions for DCA strategy.
After adding an indicator and making an initial interactive selection on the chart, you can modify the selection points by selecting the indicator and moving the points on the chart.
Open High Low StrategyThis is a very simple, yet effective and to some extend widely followed scalping strategy to capture the underling sentiments of the counter whether it will go up or down.
What is it?
This is Open-High-Low (OLH) strategy.
As you already aware of Candlestick patterns, there is patterns called as Marubozu patterns where the sell wick or buy wick either ceases to exists (or very small). This is exactly in the same principle.
In OLH strategy: The buy signal appears when the Open Price is the Low Price. It means if you draw the candlestick, there is no bottom wick. So after the opening of the candle, the demand drives the price up to the level, some selling may or may not come and closes in green. This indicates a strong upward biasness of the underlying counter.
Similarly, a sell signal appears when the Open price is the High Price. It means there is no upper wick. So there is no buying pressure, since the opening of the candle, sellers are in force and pulls down the price to a closing.
This strategy generates the signal at the close of the candle (technically barstate.isconfirmed). Because until the bar is real-time there is no option to know the final closing or high. So you will see the bar on which it generates the buy or sell signal is actually indicates the previous bar as OLH bar.
To determine the Stop-Loss, it uses the most widely known SL calculation of:
For buy signal, it takes the low of the last 7 candles and substract the ATR (Average True Range) of 14-period.
For sell signal, it takes the high of the last 7 candles and add it to the ATR (Average True Range) of 14-period.
One can plot the SL lines as dotted green and red lines as well to see visually.
Default Risk:Reward is 1:2, Can be customizable.
What is Unique?
Of course the utter simplistic nature of this strategy is it's key point. Very easy and intuitive to understand.
There are awesome strategies in this forum that talks about the various indicators combinations and what not.
Instead of all this, in a 15m NSE:NIFTY chart, it generates a good ~ 47% profit-factor with 1:2 Risk Reward ratio. Means if you loose a trade you will loose 1% of account and if you win you will gain 2%. Means 3 trades (2 profits and 1 loss) in a trading session result 3% overall gain for the day. (Assuming you are ready with 1% draw down of your account per trade, at max).
Disclaimer:
This piece of software does not come up with any warrantee or any rights of not changing it over the future course of time.
We are not responsible for any trading/investment decision you are taking out of the outcome of this indicator.

Simple and Profitable Scalping Strategy (ForexSignals TV)Strategy is based on the "SIMPLE and PROFITABLE Forex Scalping Strategy" taken from YouTube channel ForexSignals TV.
See video for a detailed explaination of the whole strategy.
I'm not entirely happy with the performance of this strategy yet however I do believe it has potential as the concept makes a lot of sense.
I'm open to any ideas people have on how it could be improved.
Strategy incorporates the following features:
Risk management:
Configurable X% loss per stop (default to 1%)
Configurable R:R ratio
Trade entry:
Based on stratgey conditions outlined below
Trade exit:
Based on stratgey conditions outlined below
Backtesting:
Configurable backtesting range by date
Trade drawings:
Each entry condition indicator can be turned on and off
TP/SL boxes drawn for all trades. Can be turned on and off
Trade exit information labels. Can be turned on and off
NOTE: Trade drawings will only be applicable when using overlay strategies
Debugging:
Includes section with useful debugging techniques
Strategy conditions
Trade entry:
LONG
C1: On higher timeframe trend EMAs, Fast EMA must be above Slow EMA
C2: On higher timeframe trend EMAs, price must be above Fast EMA
C3: On current timeframe entry EMAs, Fast EMA must be above Medium EMA and Medium EMA must be above Slow EMA
C4: On current timeframe entry EMAs, all 3 EMA lines must have fanned out in upward direction for previous X candles (configurable)
C5: On current timeframe entry EMAs, previous candle must have closed above and not touched any EMA lines
C6: On current timeframe entry EMAs, current candle must have pulled back to touch the EMA line(s)
C7: Price must break through the high of the last X candles (plus price buffer) to trigger entry (stop order entry)
SHORT
C1: On higher timeframe trend EMAs, Fast EMA must be below Slow EMA
C2: On higher timeframe trend EMAs, price must be below Fast EMA
C3: On current timeframe entry EMAs, Fast EMA must be below Medium EMA and Medium EMA must be below Slow EMA
C4: On current timeframe entry EMAs, all 3 EMA lines must have fanned out in downward direction for previous X candles (configurable)
C5: On current timeframe entry EMAs, previous candle must have closed above and not touched any EMA lines
C6: On current timeframe entry EMAs, current candle must have pulled back to touch the EMA line(s)
C7: Price must break through the low of the last X candles (plus price buffer) to trigger entry (stop order entry)
Trade entry:
Calculated position size based on risk tolerance
Entry price is a stop order set just above (buffer configurable) the recent swing high/low (long/short)
Trade exit:
Stop Loss is set just below (buffer configurable) trigger candle's low/high (long/short)
Take Profit calculated from Stop Loss using R:R ratio
Credits
"SIMPLE and PROFITABLE Forex Scalping Strategy" taken from YouTube channel ForexSignals TV

Risk Management Strategy TemplateThis strategy is intended to be used as a base template for building new strategies.
It incorporates the following features:
Risk management:
Configurable X% loss per stop loss
Configurable R:R ratio
Trade entry:
Calculated position size based on risk tolerance
Trade exit:
Stop Loss currently configurable ATR multiplier but can be replaced based on strategy
Take Profit calculated from Stop Loss using R:R ratio
Backtesting:
Configurable backtesting range by date
Trade drawings:
TP/SL boxes drawn for all trades. Can be turned on and off
Trade exit information labels. Can be turned on and off
NOTE: Trade drawings will only be applicable when using overlay strategies
Debugging:
Includes section with useful debugging techniques
Strategy conditions
Trade entry:
LONG
C1: Price is above EMA line
C2: RSI is crossing out of oversold area
SHORT
C1: Price is below EMA line
C2: RSI is crossing out of overbought area
Trade exit:
Stop Loss: Stop Loss ATR multiplier is hit
Take Profit: R:R multiplier * Stop Loss is hit
The idea is to use RSI to catch pullbacks within the main trend.
Note that this strategy is intended to be a simple base strategy for building upon. It was not designed to be traded in its current form.

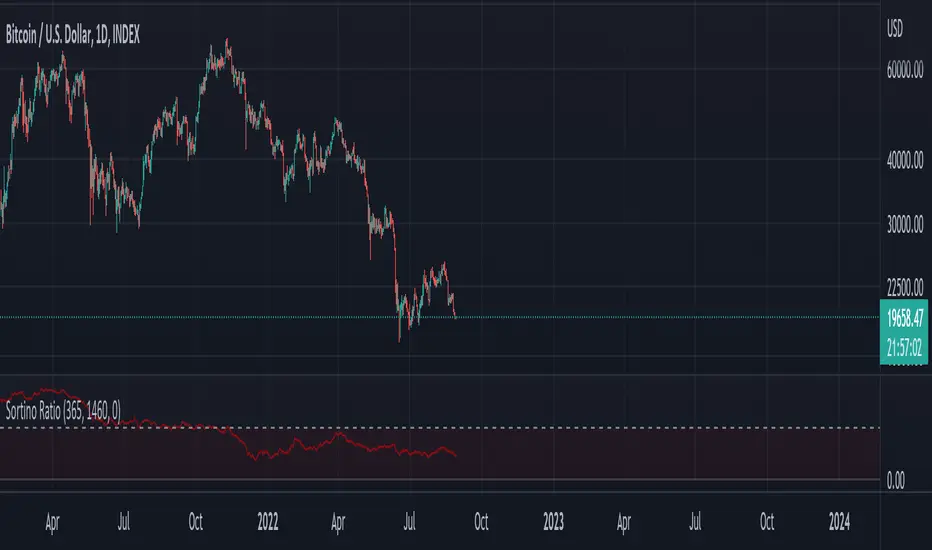
Sortino RatioFrom Wikipedia :
"The Sortino ratio measures the risk-adjusted return of an investment asset, portfolio, or strategy. It is a modification of the Sharpe ratio but penalizes only those returns falling below a user-specified target or required rate of return, while the Sharpe ratio penalizes both upside and downside volatility equally. Though both ratios measure an investment's risk-adjusted return, they do so in significantly different ways that will frequently lead to differing conclusions as to the true nature of the investment's return-generating efficiency.
The Sortino ratio is used as a way to compare the risk-adjusted performance of programs with differing risk and return profiles. In general, risk-adjusted returns seek to normalize the risk across programs and then see which has the higher return unit per risk."
R:R Trading System FrameworkFirst off, huge thanks to @fikira! He was able to adapt what I built to work much more efficiently, allowing for more strategies to be used simultaneously. Simply put, I could not have gotten to this point without you. Thanks for what you do for the TV community. Second, I am fairly new to pinescript writing, so I welcome criticism, thoughtful input and improvement suggestions. I would love to grow this concept into something even better, if possible. So please let me know if you have any ideas for improvement. However I do juggle a lot of different things outside of TV, so implementations may be delayed.
I have decided, at this time, not to add alerts. First, because I feel most people looking to adapt this framework can add their own pretty easily. Also, given how customized the framework is currently, while also attempting to account for all the possible ways in which people may want alerts to function after they customize it, it seems best to leave them out as it doesn't exactly fit the idea of a framework.
For best viewing, I recommend hovering over the script's name > ... > Visual order > Bring to front. Also I found hollow candles with mono-toned colors (like pictured) are more visually appealing for me personally. I HIGHLY RECOMMEND USING WITH BAR REPLAY TO BETTER UNDERSTAND THE FRAMEWORK'S FUNCTIONALITY.
▶️ WHAT THIS FRAMEWORK IS
- A huge collection of concepts and capabilities for those trying to better understand, learn, or teach pinescript.
- A system designed to showcase Risk:Reward concepts more holistically by providing all of the most popular components of retail trading to include backtesting, trade visual plotting, position tracking, market condition shifts, and useful info while positioned to help highlight changes in your risk:reward based decision-making processes.
- A system that can showcase individual strategies regardless of trade direction, allowing you to develop hedging strategies without having multiple indicators that do not correlate with each other.
- Designed around the idea that you trade less numbers of assets but manage your positions and risk based on multiple concurrently running strategies to manage your risk exposure and reward potential.
- An attempt to combine all the things you need to execute with an active trading management style.
- A framework that uses backtested results (in this case the number of averaged bars it takes to hit key levels) in real-time to inform your risk:reward decision-making while in-trade (in this case in your Trade Tracking Table using dynamic color to show how you might be early, on-time, or late compared to the average amount of backtested time it normally takes to hit that specific key level).
▶️ WHAT THIS FRAMEWORK IS NOT
- A complete trading product. DO NOT USE as-is. It is a FRAMEWORK for you to generate ideas of your own and fairly easily implement your own triggering conditions in the appropriate sections of the script.
▶️ USE CASES
- If you decide you like the Stop, Target, Trailing Stop, and Risk:Reward components as-is, then just understanding how to plug in your Entry and Bullish / Bearish conditions (Triangles) and adjust the input texts to match your custom naming will be all you need to make it your own!
- If you want to adapt certain components, then this system gives you a great starting point to adapt your different concepts and ideas from.
▶️ SYSTEM COMPONENTS
- Each of the system's components are described via tooltips both in the input menu and in the tables' cells.
- Each label on the chart displays the corresponding price at those triggered conditions on hover with tooltips.
- The Trailing Stop only becomes active once it is above the Entry Price for that trade, and brightens to show it is active. The STOP line (right of price) moves once it takes over for the Entry Stop representing the level of the Trailing Stop at that time for that trade.
- The Lines / Labels to the right of price will brighten once price is above for Longs or below for Shorts. The Trade Tracking Table cells will add ☑️ once price is above for Longs or below for Shorts.
- The brighter boxes on the chart show the trades that occurred based on your criteria and are color coded for all components of each trade type to ensure your references are consistent. (Defaults are TV built-in strategies)
- The lighter boxes on the chart show the highest and lowest price levels reached during those trades, to highlight areas where improvements can be made or additional considerations can be accounted for by either adjusting Entry triggers or Bullish / Bearish triggers.
- Default Green and Red Triangles (Bullish / Bearish) default to having the same triggering condition as the Entry it corresponds to. This is to highlight either a pyramiding concept, early exit, or you can change to account for other things occurring during your trades which could help you with Stop and Target management/considerations.
TradingView and many of its community members have done a lot for me, so this is my attempt to give back.

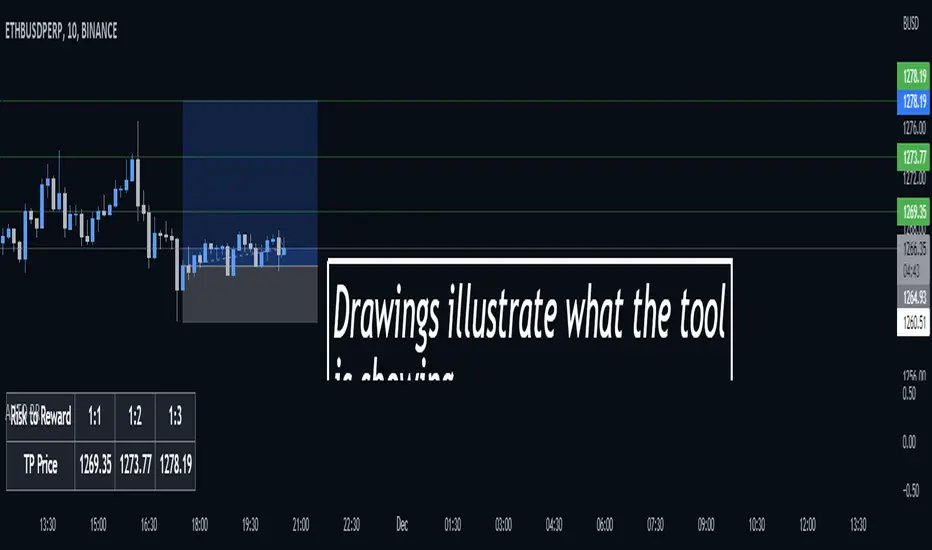
Risk:RewardThis Indicator displays Entry and Exits levels. The display is done under 3 modes:
- Risk/Reward mode (the one by default. It is set to a 1:1 ratio)
- Multiples TP Levels
- Custom Levels
Click to Set entry Price on chart
The displaying is static by default
to make it dynamic disable the "Use custom Entry ?" input.
Disclaimer: Scripts that I post publicly are experimental. They are not financial advices. Always backtest your ideas using your own methodologies.

Future Risk CalculatorCreated out of revenge against the difficulty of controlling psychology, greed, and risk management. Designed for cryptocurrency futures trading by following the risk management principles from Kevin Sailly. Very welcome if there are suggestions and input to improve the quality of this "indicator". Please use wisely.
How to use:
1. Open indicator settings.
2. Fill out all the forms. (Note: I make Max Loss Risk only has 5 options. Because, you know, to control the greed. You can choose by considering your risk profiles and market condition)
3. All of the information and calculation will appear on the label (right side of the bar chart) and top-right box.
4. You can adjust the three prices (target, entry, and stop) by clicking any part of the indicator. There will be three dots in the middle of the chart window (align with three prices). Click that dots and drag them up/down to customize according to your wishes. The price order must be correct, for LONG direction the price order from the top is target-entry-stop. Vice versa for SHORT direction. There will be "SETUP ERROR" text in the top-right box if the price order is not correct.
"Never, ever argue with your trading system." (by Michael Covel)
Regards,
Ircham

Trade & Risk Management Tool (Expo)█ Trade & Risk Management Tool (Expo) is a sophisticated and complete trading tool that helps traders manage their position and risk. This tool makes risk and trade management simple and convenient; literally, anyone can use it. The key feature is its ability to set the stop-loss automatically.
█ The key feature of this tool is that it sets the stop loss automatically depending on the current market characteristics; in other words, it's a stop-loss that adapts dynamically and optimizes to suggest the best possible stop-loss at that time. In addition, the user can set the preferred risk-reward, and the tool will automatically calculate the RR and Take Profit Levels for you. There is also a possibility to add up to 4 take profit levels, all based on your set RR.
The Auto Stop-loss feature comes with even more customization, and the trader can enable a trailing stop and set a custom stop-loss instead of using the default one.
█ The Trade & Risk Management Tool also calculates the current position P&L in points/pips or %. Positions size is automatically calculated based on the account size and % of the capital you want to risk. In addition, we have added Expected Return in % for the active position. This is a feature that experienced traders commonly use. Set the Probability of Gain and the Probability of Loss, and the tool will calculate the expected return based on the SL and TP. The probability of gain/loss can be calculated using historical data or for experienced traders by making an educated guess.
█ Why is this tool needed?
Trade & Risk management is a key concept to grasp and use in your trading, and it's one of the most critical aspects that will determine your long-term success in this industry. The market is uncertain, and it's impossible to know what the future holds. The only way to take control of the unknown is to have a sound risk management system that ensures you don't blow your account in one trade. Therefore all traders need to understand the importance of using a risk- and money management tool that calculates and provides stop-loss and take-profit levels in real-time. This way, you will always know where to take your stop-loss and secure profit.
The position size calculator prevents you from taking too much risk and the predefined stop-loss and take-profit levels help you manage your position. The tool makes sure you maximize the profit potential while minimizing the losses. It also prevents you from taking too much risk.
It all comes down to managing the risk and managing profit. Make sure that you always know how much you can risk at each trade, where to put your stop-loss, and take profit. A general rule is to find a good balance between reward and risk (RR), preferably a risk-reward ratio of 2:1 or 3:1, where your targeted profits are always double that of your maximum losses.
█ This trading tool makes something so important so easy for you, and it's a must-have to succeed in trading for the long term.
█ HOW TO USE
Use the tool to manage your active position.
-----------------
Disclaimer
Copyright by Zeiierman.
The information contained in my Scripts/Indicators/Ideas/Algos/Systems does not constitute financial advice or a solicitation to buy or sell any securities of any type. I will not accept liability for any loss or damage, including without limitation any loss of profit, which may arise directly or indirectly from the use of or reliance on such information.
All investments involve risk, and the past performance of a security, industry, sector, market, financial product, trading strategy, backtest, or individual's trading does not guarantee future results or returns. Investors are fully responsible for any investment decisions they make. Such decisions should be based solely on an evaluation of their financial circumstances, investment objectives, risk tolerance, and liquidity needs.
My Scripts/Indicators/Ideas/Algos/Systems are only for educational purposes!

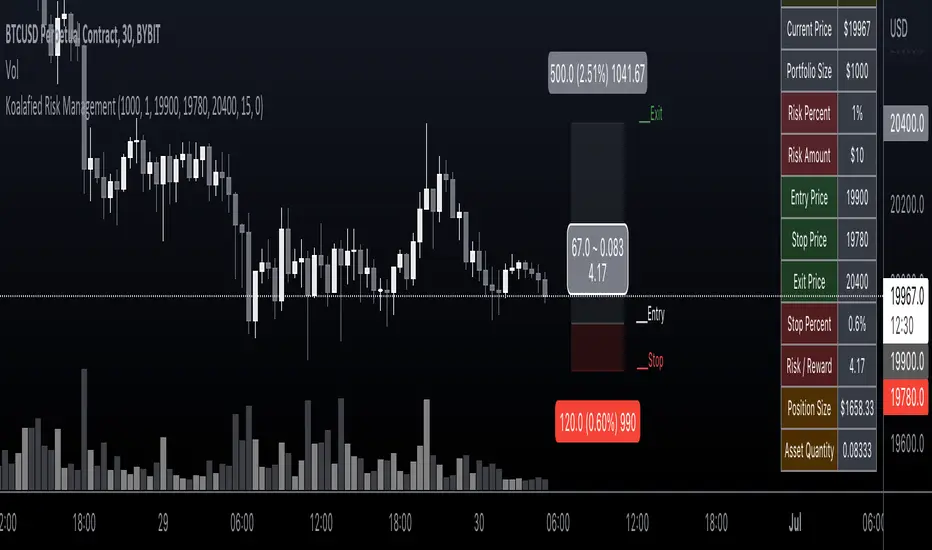
Koalafied Risk ManagementTables and labels/lines showing trade levels and risk/reward. Use to manage trade risk compared to portfolio size.
Initial design optimised for tickers denominated against USD.
PhinkTrade Risk Manager EssentialsHello there, fellow traders!
So, happy to bring you a new, free tool: my Risk Manager Essentials .
(To use it, click on "Add to favorite indicators" below, and then look for it in your charts’ "Indicators & Strategies" dialog window, inside "Favorites" tab.)
The main objective of this indicator is to help and incentivize as many traders as possible to adopt essential risk management practices .
First and foremost, it helps you define how much you can buy or sell, at your chosen price levels, in order to keep your risk always under control (in other words: in order to limit the amount you can potentially lose with a trade if your stop loss order is hit).
This is fundamental if you want to have a lasting and successful trading career: protect your capital, always . Because without it, you know: it’s game over.
Indicator also helps you visualize where minimum ideal target / take profit level is , given your risk, using the popular 3:1 Return/Risk ratio (R/R) .
3:1 R/R ratio is popular because with it you only need to “be right” (have price reach your targets) about 33% of the time, in order to be profitable : in other words, the fewer successful trades will pay you more than the sum of your unsuccessful ones will take from you.
So, make sure your strategy has a success rate greater than 33% and apply 3:1 R/R to your trades . This indicator will help you that, and with developing the necessary discipline . For example, by knowing where the ideal target should be, given your choices, you can assess the likelihood of it being reached in current price context. If that would look like a hard to happen scenario, it would probably be a good idea to avoid taking that particular trade.
Now, let’s see how it works:
When you deploy the indicator to the chart for the first time, you’ll be asked to define:
Your 1st entry price (interactively: you can define and adjust levels directly on the chart, thanks to the new Interactive Mode introduced by TradingView (ty, TV team!))
Your stop loss price (likewise)
Your 1st target price (likewise)
Your starting capital (via initial Input dialog)
Your risk (likewise)
Your risk is how much of your starting capital you are willing to lose if your stop loss is hit (define it as a % of your starting capital).
There’s a good practice here too: to risk only 1 percent of your capital per trade . This way, you can reinforce the odds of making more money than you lose and keep your peace of mind in all trades – and avoid messing up with your plans – and statistics – along the way.
Successful trading is a statistics-based endeavor. So, you want to implement and maintain consistency. Again, this indicator helps with that.
After initial setup:
You can also define additional entries and targets (up to 3 each) . Just open indicator’s Settings window and adjust accordingly.
If you have more than one entry – or target, the amounts involved will be split evenly between them. You can also enable the display of the Average Entry and Average Target labels , to see the equivalent, should you have taken (or take) a single order for each.
You can also define (via Settings, then interactively) a particular date and time for the trade . This way, labels will be presented near that moment, instead of constantly show near the latest bar.
Finally, you can personalize some other display settings: levels precision (number of decimal places), labels positions , and labels colors .
In conclusion:
You are very welcome to check it out – and adopt it on your daily use!
Please let me know your feedbacks as well. If you find any issues, or have any suggestions, I’ll be glad to hear. You can contact me here, via TradingView, or Telegram.
Finally, check the updates section below , as new stuff may show from time to time.
Thank you very much for your attention, and enjoy!
PhinkTrade

Ultimate risk management toolHow to use:
Use the cursor to select the time, entry, stop loss, and target position. Then a window will pop up and type the trading fee or any other things you want to adjust to calculate the actual reward/risk ratio according to the price you selected.
Known error:
Settings of this script can't be saved as default might due to the interactive price selection function. If anyone knows how to fix it, please let me know.
feature:
1. Dynamic profit label can move up and down vertically on the right-hand side of the box.
2. The breakeven line can tell you you can move your stop loss to the entry price when the price reaches it.
3. Calculate the actual reward/risk ratio based on the trading fee. The calculator only calculates the actual Risk/Reward Ratio, which might be helpful for scalpers.
4. When the price touches sl or tp, that side of the box will be highlighted. Sometimes it doesn't work but I will try my best to fix it. Feel free to share your idea to help me to fix it.
5. Price alert. This tool compares with the alert function but reopens it if you want to change the alert price.

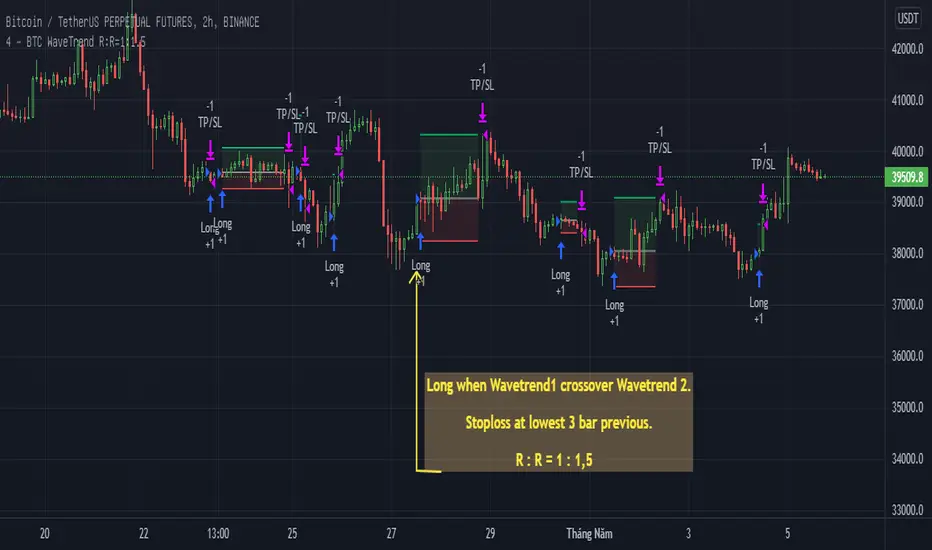
BTC WaveTrend R:R=1:1.5In this strategy, I used Wavetrend indicator (Lazy Bear).
It is very simple and easy to understanding: Long when Wavetrend1 crossover Wavetrend2 and they are less than a limit value (not buy when price overbought). Stoploss at lowest 3 bar previous. R:R = 1:1,5.
About other shortterm strategies for crypto market, you can view my published strategies.
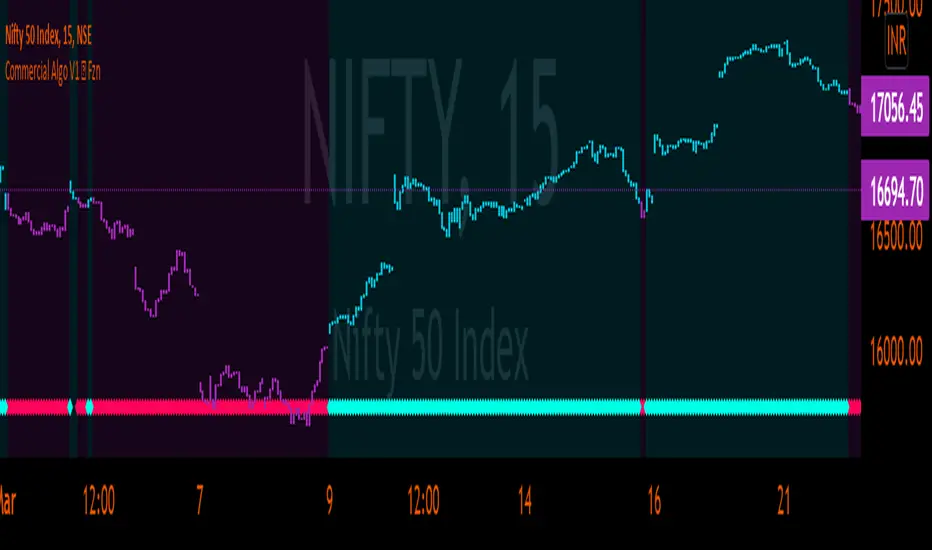
Commercial Algo Trend © Fzn V1Hello Traders,
Here i bring to you my 2nd Price Action Atr based Indictor combined with fib entry and exit trailing levels with minimum risk and maximum profit , as we must have seen at times as we enter the trend reverse and hits our stop losses . Keeping that in mind as i too struggled and made losses so i decided and focused more on minimizing the stop loss and only on confirmation of Long or Short trade is been initiated with proper Stop loss as explained in the images below , why should we give market our money ;) as we are here to make money :D .. There is no holy grail as Stop loss wont be hit but yes it will be way less and all alerts are based on candle close . One can use this on any chart and any timeframe and its very good for scalping too .ATR Trailing SL is added too just incase you want to enter and exit trend manually . Better results are on 15m and above . Hope you guys will like it and comment if you have any doubts..
-----------------
Disclaimer
Copyright by FaizanNawazz.
The information contained in my scripts/indicators/strategies/ideas does not constitute financial advice or a solicitation to buy or sell any securities of any type. I will not accept liability for any loss or damage, including without limitation any loss of profit, which may arise directly or indirectly from the use of or reliance on such information.
All investments involve risk, and the past performance of a security, industry, sector, market, financial product, trading strategy, or individual’s trading does not guarantee future results or returns. Investors are fully responsible for any investment decisions they make. Such decisions should be based solely on an evaluation of their financial circumstances, investment objectives, risk tolerance, and liquidity needs.
My scripts/indicators are only for educational purposes!
Happy Trading!
Take profit Multi timeframeRepublish:
Take profit Multi timeframe:
In this scipts, I build risk-reward system managemant. You can take profit in two way: percent or at resistant in higher timeframe or both.
Strategy in this scripts, I use Wave trend indicator as example strategy.

StopLossThat indicator helps us to determine the stop loss levels or prices in terms of atr levels. It includes 4 (four) options which are 1-Don't Risk, 2-Low Risk, 3-High Risk, 4-Risk Lover their exploding rates are 1-2.4% , 2-3.9% , 3-6.7% , 4-16.7% in sort. It helps us to produce new methods to decreace our risk/reward ratio. It is ATR Trailing StopLoss indicator. The indicator is awesome in terms of comfortable. Thanks and waiting for your feedbacks.

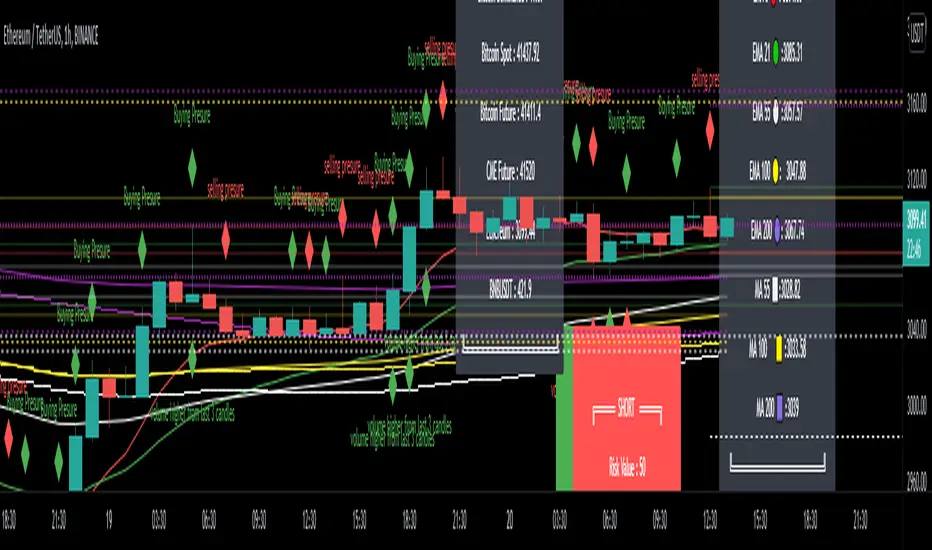
EMA - MA 21/55/100/200 Horizontal Lines & Labels & Risk RewardThis indicator will help you to get dynamic support lines of EMA 21,55,100,200 and MA 55,100,200. You can get the Price of EMA And MA in Labels also.
Solid Lines Extended Both Sides - 4 Hours Dynamic Support Resistance of EMA and MA
Dotted Lines Extended Right Side - 1 Day Dynamic Support Resistance of EMA and MA
Dashed Lines Extended Left Side - 1 Hour Dynamic Support Resistance of EMA and MA
Donate Me for My Work :
BTC(BEP20) :- 0x690fb613895dda012e93dfd35564517311b0f4f0
BNB(BEP20) - 0xE1eE3cF8bf462e1575980df2564a8ee4841f39B0
ETH(ERC20) - 0xE1eE3cF8bf462e1575980df2564a8ee4841f39B0
Hope It will help you.
Trade with your own risk. I am not liable for any loss and profit based on this indicator.
Thank you.