Institutional MACD (Z-Score Edition) [VolumeVigilante]📈 Institutional MACD (Z-Score Edition) — Professional-Grade Momentum Signal
This is not your average MACD .
The Institutional MACD (Z-Score Edition) is a statistically enhanced momentum tool, purpose-built for serious traders and breakout hunters . By applying Z-Score normalization to the classic MACD structure, this indicator uncovers statistically significant momentum shifts , enabling cleaner reads on price extremes, trend continuation, and potential reversals.
💡 Why It Matters
The classic MACD is powerful — but raw momentum values can be noisy and relative , especially on volatile assets like BTC/USD . By transforming the MACD line, signal line, and histogram into Z-scores , we anchor these signals in statistical context . This makes the Institutional MACD:
✔️ Timeframe-agnostic and asset-normalized
✔️ Ideal for spotting true breakouts , not false flags
✔️ A reliable tool for detecting momentum divergence and exhaustion
🧪 Key Features
✅ Full Z-Score normalization (MACD, Signal, Histogram)
✅ Highlighted ±Z threshold bands for overbought/oversold zones
✅ Customizable histogram coloring for visual momentum shifts
✅ Built-in alerts for zero-crosses and Z-threshold breaks
✅ Clean overlay with optional display toggles
🔁 Strategy Tip: Mean Reversion Signals with Statistical Confidence
This indicator isn't just for spotting breakouts — it also shines as a mean reversion tool , thanks to its Z-Score normalization .
When the Z-Score histogram crosses beyond ±2, it marks a statistically significant deviation from the mean — often signaling that momentum is overstretched and the asset may be due for a pullback or reversal .
📌 How to use it:
Z > +2 → Price action is in overbought territory. Watch for exhaustion or short setups.
Z < -2 → Momentum is deeply oversold. Look for reversal confirmation or long opportunities.
These zones often precede snap-back moves , especially in range-bound or corrective markets .
🎯 Combine Z-Score extremes with:
Candlestick confirmation
Support/resistance zones
Volume or price divergence
Other mean reversion tools (e.g., RSI, Bollinger Bands)
Unlike the raw MACD, this version delivers statistical thresholds , not guesswork — helping traders make decisions rooted in probability, not emotion.
📢 Trade Smart. Trade Vigilantly.
Published by VolumeVigilante
Reversion

Consecutive Bearish Candle Strategy█ STRATEGY DESCRIPTION
The "Consecutive Bearish Candle Strategy" is a momentum-based strategy designed to identify potential reversals after a sustained bearish move. It enters a long position when a specific number of consecutive bearish candles occur and exits when the price shows strength by exceeding the previous bar's high. This strategy is optimized for use on various timeframes and instruments.
█ SIGNAL GENERATION
1. LONG ENTRY
A Buy Signal is triggered when:
The close price has been lower than the previous close for at least `Lookback` consecutive bars. This indicates a sustained bearish move, suggesting a potential reversal.
The signal occurs within the specified time window (between `Start Time` and `End Time`).
2. EXIT CONDITION
A Sell Signal is generated when the current closing price exceeds the high of the previous bar (`close > high `). This indicates that the price has shown strength, potentially confirming the reversal and prompting the strategy to exit the position.
█ ADDITIONAL SETTINGS
Lookback: The number of consecutive bearish bars required to trigger a Buy Signal. Default is 3.
Start Time and End Time: The time window during which the strategy is allowed to execute trades.
█ PERFORMANCE OVERVIEW
This strategy is designed for markets with frequent momentum shifts.
It performs best in volatile conditions where price movements are significant.
Backtesting results should be analysed to optimize the `Lookback` parameter for specific instruments.

Trend Day IndentificationVolatility is cyclical, after a large move up or down the market typically "ranges" during the next session. Directional order flow that enters the market during this subsequent session tends not to persist, this non-persistency of transactions leads to a non-trend day which is when I trade intraday reversionary strategies.
This script finds trend days in BTC with the purpose of:
1) counting trend day frequency
2) predicting range contraction for the next 1-2 days so I can run intraday reversion strategies
Trend down is defined as daily bar opening within X% of high and closing within X% of low
Trend up is defined as daily bar opening within X% of low and closing within X% of high
default parameters are:
1) open range extreme = 15% (open is within 15% of high or low)
2) close range extreme = 15% (close is within 15% of high or low)
There is also an atr filter that checks that the trend day has a larger range than the previous 4 bars this is to make sure we find true range expansion vs recent ranges.
Notes:
If a trend day occurs after a prolonged sideways contraction it can signal a breakout - this is less common but is an exception to the rule. These types of occurrences can lead to the persistency of order flow and result in extended directional daily runs.
If a trend day occurs close to 20 days high or low (stopping just short OR pushing slightly through) then wait an additional day before trading intraday reversion strategies.

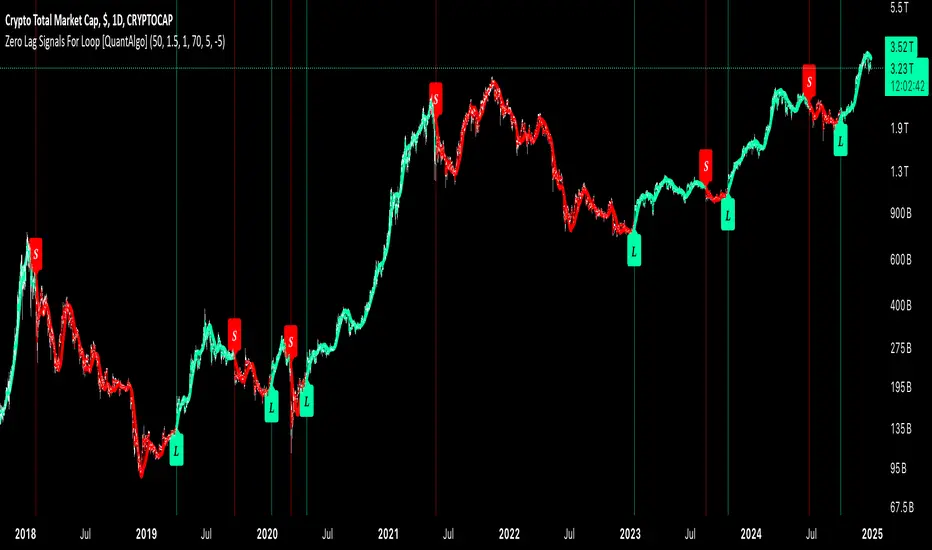
Zero Lag Signals For Loop [QuantAlgo]Elevate your trend-following investing and trading strategy with Zero Lag Signals For Loop by QuantAlgo , a simple yet effective technical indicator that merges advanced zero-lag mechanism with adaptive trend analysis to bring you a fresh take on market momentum tracking. Its aim is to support both medium- to long-term investors monitoring broader market shifts and precision-focused traders seeking quality entries through its dual-focused analysis approach!
🟢 Core Architecture
The foundation of this indicator rests on its zero-lag implementation and dynamic trend assessment. By utilizing a loop-driven scoring system alongside volatility-based filtering, each market movement is evaluated through multiple historical lenses while accounting for current market conditions. This multi-layered approach helps differentiate between genuine trend movements and market noise across timeframe and asset classes.
🟢 Technical Foundation
Three distinct components of this indicator are:
Zero Lag EMA : An enhanced moving average calculation designed to minimize traditional lag effects
For Loop Scoring System : A comprehensive scoring mechanism that weighs current price action against historical contexts
Dynamic Volatility Analysis : A sophisticated ATR-based filter that adjusts signal sensitivity to market conditions
🟢 Key Features & Signals
The Zero Lag Signals For Loop provides market insights through:
Color-coded Zero Lag line that adapts to trend direction
Dynamic fills between price and Zero Lag basis for enhanced visualization
Trend change markers (L/S) that highlight potential reversal points
Smart bar coloring that helps visualize market momentum
Background color changes with vertical lines at significant trend shifts
Customizable alerts for both bullish and bearish reversals
🟢 Practical Usage Tips
Here's how you can get the most out of the Zero Lag Signals For Loop :
1/ Setup:
Add the indicator to your TradingView chart by clicking on the star icon to add it to your favorites ⭐️
Start with the default Zero Lag length for balanced sensitivity
Use the standard volatility multiplier for proper filtering
Keep the default loop range for comprehensive trend analysis
Adjust threshold levels based on your investing and/or trading style
2/ Reading Signals:
Watch for L/S markers - they indicate validated trend reversals
Pay attention to Zero Lag line color changes - they confirm trend direction
Monitor bar colors for additional trend confirmation
Configure alerts for trend changes in both bullish and bearish directions, ensuring you can act on significant technical developments promptly.
🟢 Pro Tips
Fine-tune the Zero Lag length based on your timeframe:
→ Lower values (20-40) for more responsive signals
→ Higher values (60-100) for stronger trend confirmation
Adjust volatility multiplier based on market conditions:
→ Increase multiplier in volatile markets
→ Decrease multiplier in stable trending markets
Combine with:
→ Volume analysis for trade validation
→ Multiple timeframe analysis for broader context
→ Other technical tools for comprehensive analysis
Adaptive Volatility-Controlled LSMA [QuantAlgo]Adaptive Volatility-Controlled LSMA by QuantAlgo 📈💫
Introducing the Adaptive Volatility-Controlled LSMA (Least Squares Moving Average) , a powerful trend-following indicator that combines trend detection with dynamic volatility adjustments. This indicator is designed to help traders and investors identify market trends while accounting for price volatility, making it suitable for a wide range of assets and timeframes. By integrating LSMA for trend analysis and Average True Range (ATR) for volatility control, this tool provides clearer signals during both trending and volatile market conditions.
💡 Core Concept and Innovation
The Adaptive Volatility-Controlled LSMA leverages the precision of the LSMA to track market trends and combines it with the sensitivity of the ATR to account for market volatility. LSMA fits a linear regression line to price data, providing a smoothed trend line that is less reactive to short-term noise. The ATR, on the other hand, dynamically adjusts the volatility bands around the LSMA, allowing the indicator to filter out false signals and respond to significant price moves. This combination provides traders with a reliable tool to identify trend shifts while managing risk in volatile markets.
📊 Technical Breakdown and Calculations
The indicator consists of the following components:
1. Least Squares Moving Average (LSMA): The LSMA calculates a linear regression line over a defined period to smooth out price fluctuations and reveal the underlying trend. It is more reactive to recent data than traditional moving averages, allowing for quicker trend detection.
2. ATR-Based Volatility Bands: The Average True Range (ATR) measures market volatility and creates upper and lower bands around the LSMA. These bands expand and contract based on market conditions, helping traders identify when price movements are significant enough to indicate a new trend.
3. Volatility Extensions: To further account for rapid market changes, the bands are extended using additional volatility measures. This ensures that trend signals are generated when price movements exceed both the standard volatility range and the extended volatility range.
⚙️ Step-by-Step Calculation:
1. LSMA Calculation: The LSMA is computed using a least squares regression method over a user-defined length. This provides a trend line that adapts to recent price movements while smoothing out noise.
2. ATR and Volatility Bands: ATR is calculated over a user-defined length and is multiplied by a factor to create upper and lower bands around the LSMA. These bands help detect when price movements are substantial enough to signal a new trend.
3. Trend Detection: The price’s relationship to the LSMA and the volatility bands is used to determine trend direction. If the price crosses above the upper volatility band, a bullish trend is detected. Conversely, a cross below the lower band indicates a bearish trend.
✅ Customizable Inputs and Features:
The Adaptive Volatility-Controlled LSMA offers a variety of customizable options to suit different trading or investing styles:
📈 Trend Settings:
1. LSMA Length: Adjust the length of the LSMA to control its sensitivity to price changes. A shorter length reacts quickly to new data, while a longer length smooths the trend line.
2. Price Source: Choose the type of price (e.g., close, high, low) that the LSMA uses to calculate trends, allowing for different interpretations of price data.
🌊 Volatility Controls:
ATR Length and Multiplier: Adjust the length and sensitivity of the ATR to control how volatility is measured. A higher ATR multiplier widens the bands, making the trend detection less sensitive, while a lower multiplier tightens the bands, increasing sensitivity.
🎨 Visualization and Alerts:
1. Bar Coloring: Customize bar colors to visually distinguish between uptrends and downtrends.
2. Volatility Bands: Enable or disable the display of volatility bands on the chart. The bands provide visual cues about trend strength and volatility thresholds.
3. Alerts: Set alerts for when the price crosses the upper or lower volatility bands, signaling potential trend changes.
📈 Practical Applications
The Adaptive Volatility-Controlled LSMA is ideal for traders and investors looking to follow trends while accounting for market volatility. Its key use cases include:
Identifying Trend Reversals: The indicator detects when price movements break through volatility bands, signaling potential trend reversals.
Filtering Market Noise: By applying ATR-based volatility filtering, the indicator helps reduce false signals caused by short-term price fluctuations.
Managing Risk: The volatility bands adjust dynamically to account for market conditions, helping traders manage risk and improve the accuracy of their trend-following strategies.
⭐️ Summary
The Adaptive Volatility-Controlled LSMA by QuantAlgo offers a robust and flexible approach to trend detection and volatility management. Its combination of LSMA and ATR creates clearer, more reliable signals, making it a valuable tool for navigating trending and volatile markets. Whether you're detecting trend shifts or filtering market noise, this indicator provides the tools you need to enhance your trading and investing strategy.
Note: The Adaptive Volatility-Controlled LSMA is a tool to enhance market analysis. It should be used in conjunction with other analytical tools and should not be relied upon as the sole basis for trading or investment decisions. No signals or indicators constitute financial advice, and past performance is not indicative of future results.

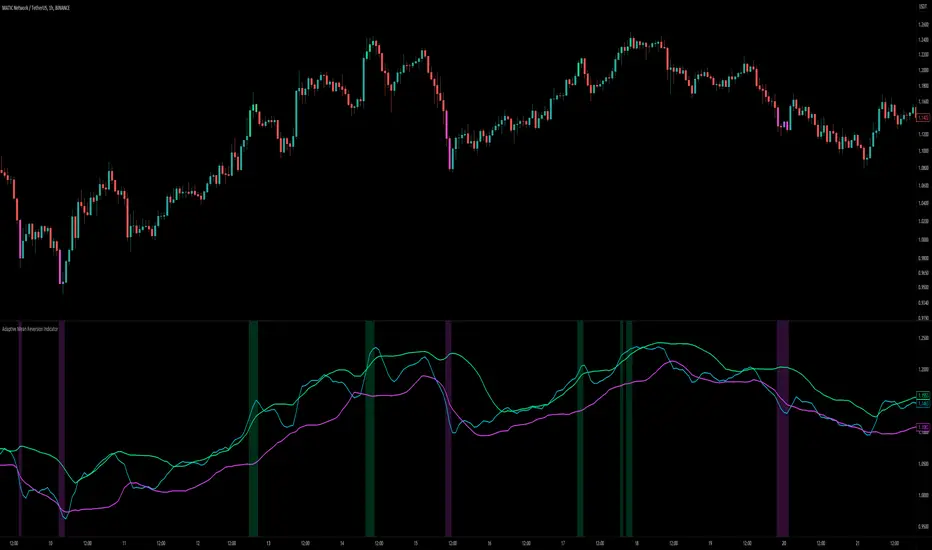
Mean Reversion Cloud (Ornstein-Uhlenbeck) // AlgoFyreThe Mean Reversion Cloud (Ornstein-Uhlenbeck) indicator detects mean-reversion opportunities by applying the Ornstein-Uhlenbeck process. It calculates a dynamic mean using an Exponential Weighted Moving Average, surrounded by volatility bands, signaling potential buy/sell points when prices deviate.
TABLE OF CONTENTS
🔶 ORIGINALITY
🔸Adaptive Mean Calculation
🔸Volatility-Based Cloud
🔸Speed of Reversion (θ)
🔶 FUNCTIONALITY
🔸Dynamic Mean and Volatility Bands
🞘 How it works
🞘 How to calculate
🞘 Code extract
🔸Visualization via Table and Plotshapes
🞘 Table Overview
🞘 Plotshapes Explanation
🞘 Code extract
🔶 INSTRUCTIONS
🔸Step-by-Step Guidelines
🞘 Setting Up the Indicator
🞘 Understanding What to Look For on the Chart
🞘 Possible Entry Signals
🞘 Possible Take Profit Strategies
🞘 Possible Stop-Loss Levels
🞘 Additional Tips
🔸Customize settings
🔶 CONCLUSION
▅▅▅▅▅▅▅▅▅▅▅▅▅▅▅▅▅▅▅▅▅▅▅▅▅▅▅▅▅▅▅▅▅▅▅▅▅▅▅▅▅▅▅▅▅▅
🔶 ORIGINALITY The Mean Reversion Cloud (Ornstein-Uhlenbeck) is a unique indicator that applies the Ornstein-Uhlenbeck stochastic process to identify mean-reverting behavior in asset prices. Unlike traditional moving average-based indicators, this model uses an Exponentially Weighted Moving Average (EWMA) to calculate the long-term mean, dynamically adjusting to recent price movements while still considering all historical data. It also incorporates volatility bands, providing a "cloud" that visually highlights overbought or oversold conditions. By calculating the speed of mean reversion (θ) through the autocorrelation of log returns, this indicator offers traders a more nuanced and mathematically robust tool for identifying mean-reversion opportunities. These innovations make it especially useful for markets that exhibit range-bound characteristics, offering timely buy and sell signals based on statistical deviations from the mean.
🔸Adaptive Mean Calculation Traditional MA indicators use fixed lengths, which can lead to lagging signals or over-sensitivity in volatile markets. The Mean Reversion Cloud uses an Exponentially Weighted Moving Average (EWMA), which adapts to price movements by dynamically adjusting its calculation, offering a more responsive mean.
🔸Volatility-Based Cloud Unlike simple moving averages that only plot a single line, the Mean Reversion Cloud surrounds the dynamic mean with volatility bands. These bands, based on standard deviations, provide traders with a visual cue of when prices are statistically likely to revert, highlighting potential reversal zones.
🔸Speed of Reversion (θ) The indicator goes beyond price averages by calculating the speed at which the price reverts to the mean (θ), using the autocorrelation of log returns. This gives traders an additional tool for estimating the likelihood and timing of mean reversion, making the signals more reliable in practice.
🔶 FUNCTIONALITY The Mean Reversion Cloud (Ornstein-Uhlenbeck) indicator is designed to detect potential mean-reversion opportunities in asset prices by applying the Ornstein-Uhlenbeck stochastic process. It calculates a dynamic mean through the Exponentially Weighted Moving Average (EWMA) and plots volatility bands based on the standard deviation of the asset's price over a specified period. These bands create a "cloud" that represents expected price fluctuations, helping traders to identify overbought or oversold conditions. By calculating the speed of reversion (θ) from the autocorrelation of log returns, the indicator offers a more refined way of assessing how quickly prices may revert to the mean. Additionally, the inclusion of volatility provides a comprehensive view of market conditions, allowing for more accurate buy and sell signals.
Let's dive into the details:
🔸Dynamic Mean and Volatility Bands The dynamic mean (μ) is calculated using the EWMA, giving more weight to recent prices but considering all historical data. This process closely resembles the Ornstein-Uhlenbeck (OU) process, which models the tendency of a stochastic variable (such as price) to revert to its mean over time. Volatility bands are plotted around the mean using standard deviation, forming the "cloud" that signals overbought or oversold conditions. The cloud adapts dynamically to price fluctuations and market volatility, making it a versatile tool for mean-reversion strategies. 🞘 How it works Step one: Calculate the dynamic mean (μ) The Ornstein-Uhlenbeck process describes how a variable, such as an asset's price, tends to revert to a long-term mean while subject to random fluctuations. In this indicator, the EWMA is used to compute the dynamic mean (μ), mimicking the mean-reverting behavior of the OU process. Use the EWMA formula to compute a weighted mean that adjusts to recent price movements. Assign exponentially decreasing weights to older data while giving more emphasis to current prices. Step two: Plot volatility bands Calculate the standard deviation of the price over a user-defined period to determine market volatility. Position the upper and lower bands around the mean by adding and subtracting a multiple of the standard deviation. 🞘 How to calculate Exponential Weighted Moving Average (EWMA)
The EWMA dynamically adjusts to recent price movements:
mu_t = lambda * mu_{t-1} + (1 - lambda) * P_t
Where mu_t is the mean at time t, lambda is the decay factor, and P_t is the price at time t. The higher the decay factor, the more weight is given to recent data.
Autocorrelation (ρ) and Standard Deviation (σ)
To measure mean reversion speed and volatility: rho = correlation(log(close), log(close ), length) Where rho is the autocorrelation of log returns over a specified period.
To calculate volatility:
sigma = stdev(close, length)
Where sigma is the standard deviation of the asset's closing price over a specified length.
Upper and Lower Bands
The upper and lower bands are calculated as follows:
upper_band = mu + (threshold * sigma)
lower_band = mu - (threshold * sigma)
Where threshold is a multiplier for the standard deviation, usually set to 2. These bands represent the range within which the price is expected to fluctuate, based on current volatility and the mean.
🞘 Code extract // Calculate Returns
returns = math.log(close / close )
// Calculate Long-Term Mean (μ) using EWMA over the entire dataset
var float ewma_mu = na // Initialize ewma_mu as 'na'
ewma_mu := na(ewma_mu ) ? close : decay_factor * ewma_mu + (1 - decay_factor) * close
mu = ewma_mu
// Calculate Autocorrelation at Lag 1
rho1 = ta.correlation(returns, returns , corr_length)
// Ensure rho1 is within valid range to avoid errors
rho1 := na(rho1) or rho1 <= 0 ? 0.0001 : rho1
// Calculate Speed of Mean Reversion (θ)
theta = -math.log(rho1)
// Calculate Volatility (σ)
sigma = ta.stdev(close, corr_length)
// Calculate Upper and Lower Bands
upper_band = mu + threshold * sigma
lower_band = mu - threshold * sigma
🔸Visualization via Table and Plotshapes
The table shows key statistics such as the current value of the dynamic mean (μ), the number of times the price has crossed the upper or lower bands, and the consecutive number of bars that the price has remained in an overbought or oversold state.
Plotshapes (diamonds) are used to signal buy and sell opportunities. A green diamond below the price suggests a buy signal when the price crosses below the lower band, and a red diamond above the price indicates a sell signal when the price crosses above the upper band.
The table and plotshapes provide a comprehensive visualization, combining both statistical and actionable information to aid decision-making.
🞘 Code extract // Reset consecutive_bars when price crosses the mean
var consecutive_bars = 0
if (close < mu and close >= mu) or (close > mu and close <= mu)
consecutive_bars := 0
else if math.abs(deviation) > 0
consecutive_bars := math.min(consecutive_bars + 1, dev_length)
transparency = math.max(0, math.min(100, 100 - (consecutive_bars * 100 / dev_length)))
🔶 INSTRUCTIONS
The Mean Reversion Cloud (Ornstein-Uhlenbeck) indicator can be set up by adding it to your TradingView chart and configuring parameters such as the decay factor, autocorrelation length, and volatility threshold to suit current market conditions. Look for price crossovers and deviations from the calculated mean for potential entry signals. Use the upper and lower bands as dynamic support/resistance levels for setting take profit and stop-loss orders. Combining this indicator with additional trend-following or momentum-based indicators can improve signal accuracy. Adjust settings for better mean-reversion detection and risk management.
🔸Step-by-Step Guidelines
🞘 Setting Up the Indicator
Adding the Indicator to the Chart:
Go to your TradingView chart.
Click on the "Indicators" button at the top.
Search for "Mean Reversion Cloud (Ornstein-Uhlenbeck)" in the indicators list.
Click on the indicator to add it to your chart.
Configuring the Indicator:
Open the indicator settings by clicking on the gear icon next to its name on the chart.
Decay Factor: Adjust the decay factor (λ) to control the responsiveness of the mean calculation. A higher value prioritizes recent data.
Autocorrelation Length: Set the autocorrelation length (θ) for calculating the speed of mean reversion. Longer lengths consider more historical data.
Threshold: Define the number of standard deviations for the upper and lower bands to determine how far price must deviate to trigger a signal.
Chart Setup:
Select the appropriate timeframe (e.g., 1-hour, daily) based on your trading strategy.
Consider using other indicators such as RSI or MACD to confirm buy and sell signals.
🞘 Understanding What to Look For on the Chart
Indicator Behavior:
Observe how the price interacts with the dynamic mean and volatility bands. The price staying within the bands suggests mean-reverting behavior, while crossing the bands signals potential entry points.
The indicator calculates overbought/oversold conditions based on deviation from the mean, highlighted by color-coded cloud areas on the chart.
Crossovers and Deviation:
Look for crossovers between the price and the mean (μ) or the bands. A bullish crossover occurs when the price crosses below the lower band, signaling a potential buying opportunity.
A bearish crossover occurs when the price crosses above the upper band, suggesting a potential sell signal.
Deviations from the mean indicate market extremes. A large deviation indicates that the price is far from the mean, suggesting a potential reversal.
Slope and Direction:
Pay attention to the slope of the mean (μ). A rising slope suggests bullish market conditions, while a declining slope signals a bearish market.
The steepness of the slope can indicate the strength of the mean-reversion trend.
🞘 Possible Entry Signals
Bullish Entry:
Crossover Entry: Enter a long position when the price crosses below the lower band with a positive deviation from the mean.
Confirmation Entry: Use additional indicators like RSI (above 50) or increasing volume to confirm the bullish signal.
Bearish Entry:
Crossover Entry: Enter a short position when the price crosses above the upper band with a negative deviation from the mean.
Confirmation Entry: Look for RSI (below 50) or decreasing volume to confirm the bearish signal.
Deviation Confirmation:
Enter trades when the deviation from the mean is significant, indicating that the price has strayed far from its expected value and is likely to revert.
🞘 Possible Take Profit Strategies
Static Take Profit Levels:
Set predefined take profit levels based on historical volatility, using the upper and lower bands as guides.
Place take profit orders near recent support/resistance levels, ensuring you're capitalizing on the mean-reversion behavior.
Trailing Stop Loss:
Use a trailing stop based on a percentage of the price deviation from the mean to lock in profits as the trend progresses.
Adjust the trailing stop dynamically along the calculated bands to protect profits as the price returns to the mean.
Deviation-Based Exits:
Exit when the deviation from the mean starts to decrease, signaling that the price is returning to its equilibrium.
🞘 Possible Stop-Loss Levels
Initial Stop Loss:
Place an initial stop loss outside the lower band (for long positions) or above the upper band (for short positions) to protect against excessive deviations.
Use a volatility-based buffer to avoid getting stopped out during normal price fluctuations.
Dynamic Stop Loss:
Move the stop loss closer to the mean as the price converges back towards equilibrium, reducing risk.
Adjust the stop loss dynamically along the bands to account for sudden market movements.
🞘 Additional Tips
Combine with Other Indicators:
Enhance your strategy by combining the Mean Reversion Cloud with momentum indicators like MACD, RSI, or Bollinger Bands to confirm market conditions.
Backtesting and Practice:
Backtest the indicator on historical data to understand how it performs in various market environments.
Practice using the indicator on a demo account before implementing it in live trading.
Market Awareness:
Keep an eye on market news and events that might cause extreme price movements. The indicator reacts to price data and might not account for news-driven events that can cause large deviations.
🔸Customize settings 🞘 Decay Factor (λ): Defines the weight assigned to recent price data in the calculation of the mean. A value closer to 1 places more emphasis on recent prices, while lower values create a smoother, more lagging mean.
🞘 Autocorrelation Length (θ): Sets the period for calculating the speed of mean reversion and volatility. Longer lengths capture more historical data, providing smoother calculations, while shorter lengths make the indicator more responsive.
🞘 Threshold (σ): Specifies the number of standard deviations used to create the upper and lower bands. Higher thresholds widen the bands, producing fewer signals, while lower thresholds tighten the bands for more frequent signals.
🞘 Max Gradient Length (γ): Determines the maximum number of consecutive bars for calculating the deviation gradient. This setting impacts the transparency of the plotted bands based on the length of deviation from the mean.
🔶 CONCLUSION
The Mean Reversion Cloud (Ornstein-Uhlenbeck) indicator offers a sophisticated approach to identifying mean-reversion opportunities by applying the Ornstein-Uhlenbeck stochastic process. This dynamic indicator calculates a responsive mean using an Exponentially Weighted Moving Average (EWMA) and plots volatility-based bands to highlight overbought and oversold conditions. By incorporating advanced statistical measures like autocorrelation and standard deviation, traders can better assess market extremes and potential reversals. The indicator’s ability to adapt to price behavior makes it a versatile tool for traders focused on both short-term price deviations and longer-term mean-reversion strategies. With its unique blend of statistical rigor and visual clarity, the Mean Reversion Cloud provides an invaluable tool for understanding and capitalizing on market inefficiencies.

HMA Z-Score Probability Indicator by Erika BarkerThis indicator is a modified version of SteverSteves's original work, enhanced by Erika Barker. It visually represents asset price movements in terms of standard deviations from a Hull Moving Average (HMA), commonly known as a Z-Score.
Key Features:
Z-Score Calculation: Measures how many standard deviations the current price is from its HMA.
Hull Moving Average (HMA): This moving average provides a more responsive baseline for Z-Score calculations.
Flexible Display: Offers both area and candlestick visualization options for the Z-Score.
Probability Zones: Color-coded areas showing the statistical likelihood of prices based on their Z-Score.
Dynamic Price Level Labels: Displays actual price levels corresponding to Z-Score values.
Z-Table: An optional table showing the probability of occurrence for different Z-Score ranges.
Standard Deviation Lines: Horizontal lines at each standard deviation level for easy reference.
How It Works:
The indicator calculates the Z-Score by comparing the current price to its HMA and dividing by the standard deviation. This Z-Score is then plotted on a separate pane below the main chart.
Green areas/candles: Indicate prices above the HMA (positive Z-Score)
Red areas/candles: Indicate prices below the HMA (negative Z-Score)
Color-coded zones:
Green: Within 1 standard deviation (high probability)
Yellow: Between 1 and 2 standard deviations (medium probability)
Red: Beyond 2 standard deviations (low probability)
The HMA line (white) shows the trend of the Z-Score itself, offering insight into whether the asset is becoming more or less volatile over time.
Customization Options:
Adjust lookback periods for Z-Score and HMA calculations
Toggle between area and candlestick display
Show/hide probability fills, Z-Table, HMA line, and standard deviation bands
Customize text color and decimal rounding for price levels
Interpretation:
This indicator helps traders identify potential overbought or oversold conditions based on statistical probabilities. Extreme Z-Score values (beyond ±2 or ±3) often suggest a higher likelihood of mean reversion, while consistent Z-Scores in one direction may indicate a strong trend.
By combining the Z-Score with the HMA and probability zones, traders can gain a nuanced understanding of price movements relative to recent trends and their statistical significance.

RSI DeviationAn oscillator which de-trends the Relative Strength Index. Rather, it takes a moving average of RSI and plots it's standard deviation from the MA, similar to a Bollinger %B oscillator. This seams to highlight short term peaks and troughs, Indicating oversold and overbought conditions respectively. It is intended to be used with a Dollar Cost Averaging strategy, but may also be useful for Swing Trading, or Scalping on lower timeframes.
When the line on the oscillator line crosses back into the channel, it signals a trade opportunity.
~ Crossing into the band from the bottom, indicates the end of an oversold condition, signaling a potential reversal. This would be a BUY signal.
~ Crossing into the band from the top, indicates the end of an overbought condition, signaling a potential reversal. This would be a SELL signal.
For ease of use, I've made the oscillator highlight the main chart when Overbought/Oversold conditions are occurring, and place fractals upon reversion to the Band. These repaint as they are calculated at close. The earliest trade would occur upon open of the following day.
I have set the default St. Deviation to be 2, but in my testing I have found 1.5 to be quite reliable. By decreasing the St. Deviation you will increase trade frequency, to a point, at the expense of efficiency.
Cheers
DJSnoWMan06

Dickey-Fuller Test for Mean Reversion and Stationarity **IF YOU NEED EXTRA SPECIAL HELP UNDERSTANDING THIS INDICATOR, GO TO THE BOTTOM OF THE DESCRIPTION FOR AN EVEN SIMPLER DESCRIPTION**
Dickey Fuller Test:
The Dickey-Fuller test is a statistical test used to determine whether a time series is stationary or has a unit root (a characteristic of a time series that makes it non-stationary), indicating that it is non-stationary. Stationarity means that the statistical properties of a time series, such as mean and variance, are constant over time. The test checks to see if the time series is mean-reverting or not. Many traders falsely assume that raw stock prices are mean-reverting when they are not, as evidenced by many different types of statistical models that show how stock prices are almost always positively autocorrelated or statistical tests like this one, which show that stock prices are not stationary.
Note: This indicator uses past results, and the results will always be changing as new data comes in. Just because it's stationary during a rare occurrence doesn't mean it will always be stationary. Especially in price, where this would be a rare occurrence on this test. (The Test Statistic is below the critical value.)
The indicator also shows the option to either choose Raw Price, Simple Returns, or Log Returns for the test.
Raw Prices:
Stock prices are usually non-stationary because they follow some type of random walk, exhibiting positive autocorrelation and trends in the long term.
The Dickey-Fuller test on raw prices will indicate non-stationary most of the time since prices are expected to have a unit root. (If the test statistic is higher than the critical value, it suggests the presence of a unit root, confirming non-stationarity.)
Simple Returns and Log Returns:
Simple and log returns are more stationary than prices, if not completely stationary, because they measure relative changes rather than absolute levels.
This test on simple and log returns may indicate stationary behavior, especially over longer periods. (The test statistic being below the critical value suggests the absence of a unit root, indicating stationarity.)
Null Hypothesis (H0): The time series has a unit root (it is non-stationary).
Alternative Hypothesis (H1): The time series does not have a unit root (it is stationary)
Interpretation: If the test statistic is less than the critical value, we reject the null hypothesis and conclude that the time series is stationary.
Types of Dickey-Fuller Tests:
1. (What this indicator uses) Standard Dickey-Fuller Test:
Tests the null hypothesis that a unit root is present in a simple autoregressive model.
This test is used for simple cases where we just want to check if the series has a consistent statistical property over time without considering any trends or additional complexities.
It examines the relationship between the current value of the series and its previous value to see if the series tends to drift over time or revert to the mean.
2. Augmented Dickey-Fuller (ADF) Test:
Tests for a unit root while accounting for more complex structures like trends and higher-order correlations in the data.
This test is more robust and is used when the time series has trends or other patterns that need to be considered.
It extends the regular test by including additional terms to account for the complexities, and this test may be more reliable than the regular Dickey-Fuller Test.
For things like stock prices, the ADF would be more appropriate because stock prices are almost always trending and positively autocorrelated, while the Dickey-Fuller Test is more appropriate for more simple time series.
Critical Values
This indicator uses the following critical values that are essential for interpreting the Dickey-Fuller test results. The critical values depend on the chosen significance levels:
1% Significance Level: Critical value of -3.43.
5% Significance Level: Critical value of -2.86.
10% Significance Level: Critical value of -2.57.
These critical values are thresholds that help determine whether to reject the null hypothesis of a unit root (non-stationarity). If the test statistic is less than (or more negative than) the critical value, it indicates that the time series is stationary. Conversely, if the test statistic is greater than the critical value, the series is considered non-stationary.
This indicator uses a dotted blue line by default to show the critical value. If the test-static, which is the gray column, goes below the critical value, then the test-static will become yellow, and the test will indicate that the time series is stationary or mean reverting for the current period of time.
What does this mean?
This is the weekly chart of BTCUSD with the Dickey-Fuller Test, with a length of 100 and a critical value of 1%.
So basically, in the long term, mean-reversion strategies that involve raw prices are not a good idea. You don't really need a statistical test either for this; just from seeing the chart itself, you can see that prices in the long term are trending and no mean reversion is present.
For the people who can't understand that the gray column being above the blue dotted line means price doesn't mean revert, here is a more simple description (you know you are):
Average (I have to include the meaning because they may not know what average is): The middle number is when you add up all the numbers and then divide by how many numbers there are. EX: If you have the numbers 2, 4, and 6, you add them up to get 12, and then divide by 3 (because there are 3 numbers), so the average is 4. It tells you what a typical number is in a group of numbers.
This indicator checks if a time series (like stock prices) tends to return to its average value or time.
Raw prices, which is just the regular price chart, are usually not mean-reverting (It's "always" positively autocorrelating but this group of people doesn't like that word). Price follows trends.
Simple returns and log returns are more likely to have periods of mean reversion.
How to use it:
Gray Column (the gray bars) Above the Blue Dotted Line: The price does not mean revert (non-stationary).
Gray Column Below Blue Line: The time series mean reverts (stationary)
So, if the test statistic (gray column) is below the critical value, which is the blue dotted line, then the series is stationary and mean reverting, but if it is above the blue dotted line, then the time series is not stationary or mean reverting, and strategies involving mean reversion will most likely result in a loss given enough occurrences.

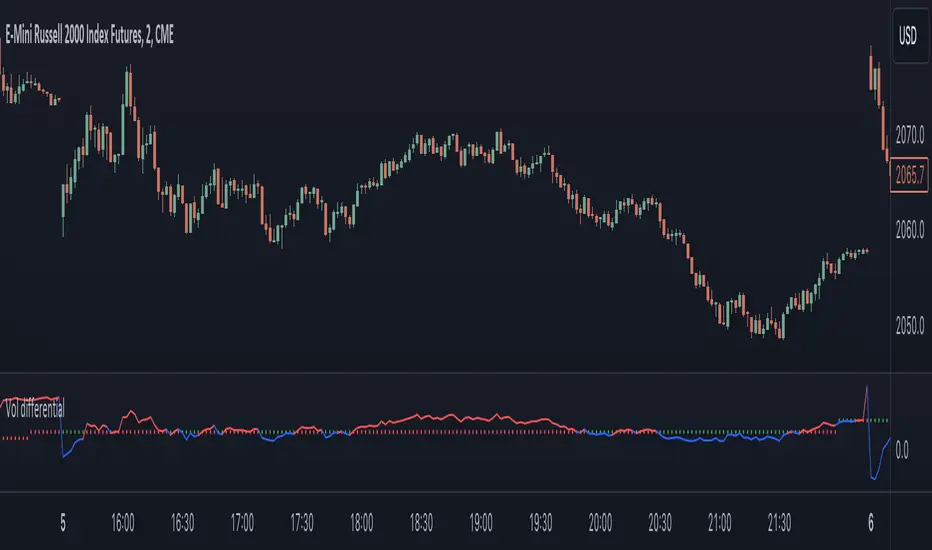
Realized volatility differentialAbout
This is a simple indicator that takes into account two types of realized volatility: Close-Close and High-Low (the latter is more useful for intraday trading).
The output of the indicator is two values / plots:
an average of High-Low volatility minus Close-Close volatility (10day period is used as a default)
the current value of the indicator
When the current value is:
lower / below the average, then it means that High-Low volatility should increase.
higher / above then obviously the opposite is true.
How to use it
It might be used as a timing tool for mean reversion strategies = when your primary strategy says a market is in mean reversion mode, you could use it as a signal for opening a position.
For example: let's say a security is in uptrend and approaching an important level (important to you).
If the current value is:
above the average, a short position can be opened, as High-Low volatility should decrease;
below the average, a trend should continue.
Intended securities
Futures contracts
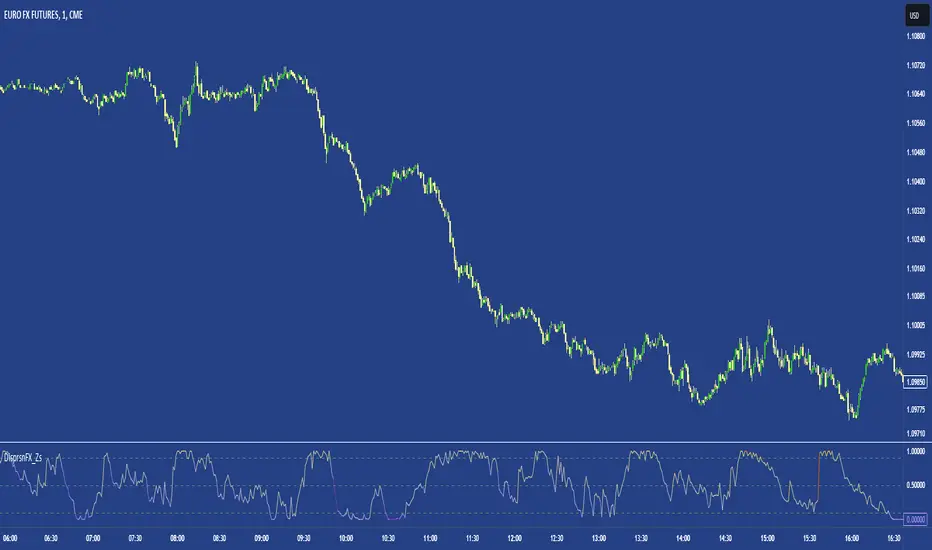
FX DispersionThis script calculates the dispersion of a basket of 5 FX pairs and then calculates the z-score the z-score is then made into a composite using the 30 and 60 ema of the z-score to smooth any noise. It must be used on one of the FX pairs in the basket and on the 1-minute timeframe as it has been hardcoded for 1 min use below.
Interpretation - Dispersion is a component of volatility - the dispersion of the underlying basket increases above 0.5 and decreases below 0.5.
Although increased dispersion is beneficial to momentum and trend-following strategies on the monthly and weekly timeframes. Observe this on the 1-minute timeframe and how dispersion crossing above/ below 0.5 it can signal reversion or momentum for the next period.
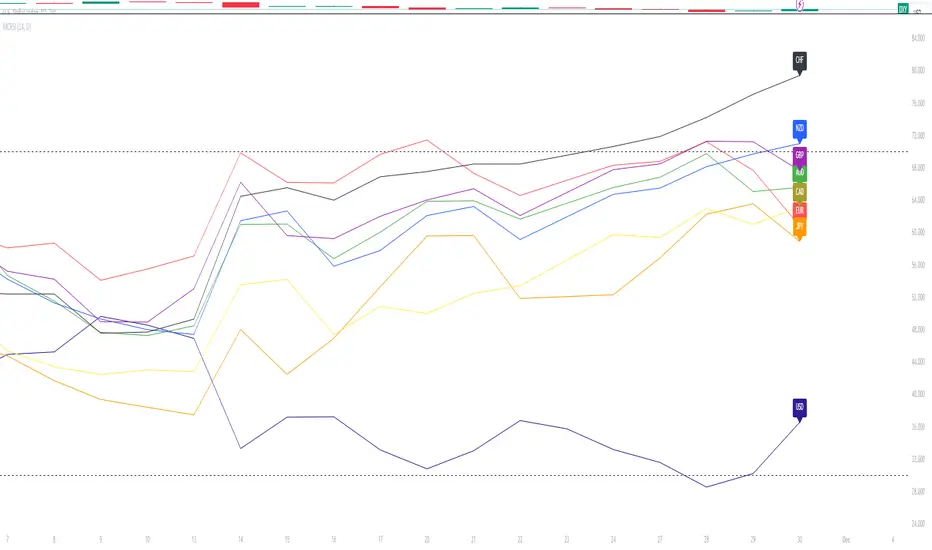
Major Currency RSI Indicator (MCRSI)Experience the power of multi-dimensional analysis with our Multi-Currency RSI Indicator (MCRSI). This innovative tool allows traders to simultaneously track and compare the Relative Strength Index (RSI) of eight different currencies in a single chart.
The MCRSI calculates the RSI for USD (DXY), EUR (EXY), JPY (JXY), CAD (CXY), AUD (AXY), NZD (ZXY), GBP (BXY), and CHF (SXY), covering a broad range of the forex market. Each RSI line is color-coded for easy differentiation and equipped with labels at the last bar for a clutter-free view.
Our indicator is designed with user-friendly customization features. You can easily adjust the length of the RSI and the time frame according to your trading strategy. It also handles gaps in the chart data with the barmerge.gaps_on option, ensuring accurate and consistent RSI calculations.
Whether you are a novice trader seeking to understand market dynamics better or an experienced trader wanting to diversify your technical analysis, the MCRSI offers a unique perspective of the forex market. This multi-currency approach can help identify potential trading opportunities that could be missed when analyzing currencies in isolation.
Harness the power of multi-currency RSI analysis with our MCRSI Indicator. It's time to step up your trading game!
Features:
Tracks 8 different currencies simultaneously
Color-coded RSI lines for easy identification
Customizable RSI length and time frame
Handles gaps in chart data
Last bar labels for a clutter-free view
Ideal for forex traders of all experience levels
How to Use:
Add the MCRSI to your TradingView chart.
Adjust the RSI length and time frame as needed.
Monitor the RSI lines and their intersections for potential trading signals.
Happy trading!
Relational Quadratic Kernel Channel [Vin]The Relational Quadratic Kernel Channel (RQK-Channel-V) is designed to provide more valuable potential price extremes or continuation points in the price trend.
Example:
Usage:
Lookback Window: Adjust the "Lookback Window" parameter to control the number of previous bars considered when calculating the Rational Quadratic Estimate. Longer windows capture longer-term trends, while shorter windows respond more quickly to price changes.
Relative Weight: The "Relative Weight" parameter allows you to control the importance of each data point in the calculation. Higher values emphasize recent data, while lower values give more weight to historical data.
Source: Choose the data source (e.g., close price) that you want to use for the kernel estimate.
ATR Length: Set the length of the Average True Range (ATR) used for channel width calculation. A longer ATR length results in wider channels, while a shorter length leads to narrower channels.
Channel Multipliers: Adjust the "Channel Multiplier" parameters to control the width of the channels. Higher multipliers result in wider channels, while lower multipliers produce narrower channels. The indicator provides three sets of channels, each with its own multiplier for flexibility.
Details:
Rational Quadratic Kernel Function:
The Rational Quadratic Kernel Function is a type of smoothing function used to estimate a continuous curve or line from discrete data points. It is often used in time series analysis to reduce noise and emphasize trends or patterns in the data.
The formula for the Rational Quadratic Kernel Function is generally defined as:
K(x) = (1 + (x^2) / (2 * α * β))^(-α)
Where:
x represents the distance or difference between data points.
α and β are parameters that control the shape of the kernel. These parameters can be adjusted to control the smoothness or flexibility of the kernel function.
In the context of this indicator, the Rational Quadratic Kernel Function is applied to a specified source (e.g., close prices) over a defined lookback window. It calculates a smoothed estimate of the source data, which is then used to determine the central value of the channels. The kernel function allows the indicator to adapt to different market conditions and reduce noise in the data.
The specific parameters (length and relativeWeight) in your indicator allows to fine-tune how the Rational Quadratic Kernel Function is applied, providing flexibility in capturing both short-term and long-term trends in the data.
To know more about unsupervised ML implementations, I highly recommend to follow the users, @jdehorty and @LuxAlgo
Optimizing the parameters:
Lookback Window (length): The lookback window determines how many previous bars are considered when calculating the kernel estimate.
For shorter-term trading strategies, you may want to use a shorter lookback window (e.g., 5-10).
For longer-term trading or investing, consider a longer lookback window (e.g., 20-50).
Relative Weight (relativeWeight): This parameter controls the importance of each data point in the calculation.
A higher relative weight (e.g., 2 or 3) emphasizes recent data, which can be suitable for trend-following strategies.
A lower relative weight (e.g., 1) gives more equal importance to historical and recent data, which may be useful for strategies that aim to capture both short-term and long-term trends.
ATR Length (atrLength): The length of the Average True Range (ATR) affects the width of the channels.
Longer ATR lengths result in wider channels, which may be suitable for capturing broader price movements.
Shorter ATR lengths result in narrower channels, which can be helpful for identifying smaller price swings.
Channel Multipliers (channelMultiplier1, channelMultiplier2, channelMultiplier3): These parameters determine the width of the channels relative to the ATR.
Adjust these multipliers based on your risk tolerance and desired channel width.
Higher multipliers result in wider channels, which may lead to fewer signals but potentially larger price movements.
Lower multipliers create narrower channels, which can result in more frequent signals but potentially smaller price movements.

Auto-Length Adaptive ChannelsIntroduction
The key innovation of the ALAC is the implementation of dynamic length identification, which allows the indicator to adjust to the "market beat" or dominant cycle in real-time.
The Auto-Length Adaptive Channels (ALAC) is a flexible technical analysis tool that combines the benefits of five different approaches to market band and price deviation calculations.
Traders often tend to overthink of what length their indicators should use, and this is the main idea behind this script. It automatically calculates length based on pivot points, averaging the distance that is in between of current market highs and lows.
This approach is very helpful to identify market deviations, because deviations are always calculated and compared to previous market behavior.
How it works
The indicator uses a Detrended Rhythm Oscillator (DRO) to identify the dominant cycle in the market. This length information is then used to calculate different market bands and price deviations. The ALAC combines five different methodologies to compute these bands:
1 - Bollinger Bands
2 - Keltner Channels
3 - Envelope
4 - Average True Range Channels
5 - Donchian Channels
By averaging these calculations, the ALAC produces an overall market band that generalizes the approaches of these five methods into a single, adaptive channel.
How to Use
When the price is at the upper band, this might suggest that the asset is overbought and may be due for a price correction. Conversely, when the price is at the lower band, the asset may be oversold and due for a price increase.
The space between the bands represents the market's volatility. Wider bands indicate higher volatility, while narrower bands suggest lower volatility.
Indicator Settings
The settings of the ALAC allow for customization to suit different trading strategies:
Use Autolength?: This allows the indicator to automatically adjust the length of the dominant cycle.
Usual Length: If "Use Autolength?" is disabled, this setting allows the user to manually specify the length of the cycle.
Moving Average Type: This selects the type of moving average to be used in the calculations. Options include SMA, EMA, ALMA, DEMA, JMA, KAMA, SMMA, TMA, TSF, VMA, VAMA, VWMA, WMA, and ZLEMA.
Channel Multiplier: This adjusts the distance between the bands.
Channel Multiplier Step: This changes the step size of the channel multiplier. Each next market band will be multiplied by a previous one. You can potentially use values below 1, which will plot bands inside the first, main channel.
Use DPO instead of source data?: This setting uses the DPO for calculations instead of the source data. Basically, this is how you can add or eliminate trend from calculation of an average leg-up / leg-down move.
Fast: This adjusts the fast length of the DPO.
Slow: This adjusts the slow length of the DPO.
Zig-zag Period: This adjusts the period of the zig-zag pattern used in the DPO.
(!) For more information about DPO visit official TradingView description here: link
Also, I want to say thanks to @StockMarketCycles for initial idea of Detrended Rhythm Oscillator (DRO) that I use in this script.
The Adaptive Average Channel is a powerful and versatile indicator that combines the strengths of multiple technical analysis methods.
In summary, with the ALAC, you can:
1 - Dynamically adapt to any asset and price action with automatic calculation of dominant cycle lengths.
2 - Identify potential overbought and oversold conditions with the adaptive market bands.
3 - Customize your analysis with various settings, including moving average type and channel multiplier.
4 - Enhance your trading strategy by using the indicator in conjunction with other forms of analysis.

Adaptive Mean Reversion IndicatorThe Adaptive Mean Reversion Indicator is a tool for identifying mean reversion trading opportunities in the market. The indicator employs a dynamic approach by adapting its parameters based on the detected market regime, ensuring optimal performance in different market conditions.
To determine the market regime, the indicator utilizes a volatility threshold. By comparing the average true range (ATR) over a 14-period to the specified threshold, it determines whether the market is trending or ranging. This information is crucial as it sets the foundation for parameter optimization.
The parameter optimization process is an essential step in the indicator's calculation. It dynamically adjusts the lookback period and threshold level based on the identified market regime. In trending markets, a longer lookback period and higher threshold level are chosen to capture extended trends. In ranging markets, a shorter lookback period and lower threshold level are used to identify mean reversion opportunities within a narrower price range.
The mean reversion calculation lies at the core of this indicator. It starts with computing the mean value using the simple moving average (SMA) over the selected lookback period. This represents the average price level. The deviation is then determined by calculating the standard deviation of the closing prices over the same lookback period. The upper and lower bands are derived by adding and subtracting the threshold level multiplied by the deviation from the mean, respectively. These bands serve as dynamic levels that define potential overbought and oversold areas.
In real-time, the indicator's adaptability shines through. If the market is trending, the adaptive mean is set to the calculated mean value. The adaptive upper and lower bands are adjusted by scaling the threshold level with a factor of 0.75. This adjustment allows the indicator to be less sensitive to minor price fluctuations during trending periods, providing more robust mean reversion signals. In ranging market conditions, the regular mean, upper band, and lower band are used as they are more suited to capture mean reversion within a confined price range.
The signal generation component of the indicator identifies potential trading opportunities based on the relationship between the current close price and the adaptive upper and lower bands. If the close price is above the adaptive upper band, it suggests a potential short entry opportunity (-1). Conversely, if the close price is below the adaptive lower band, it indicates a potential long entry opportunity (1). When the close price is within the range defined by the adaptive upper and lower bands, no clear trading signal is generated (0).
To further strengthen the quality of signals, the indicator introduces a confluence condition based on the RSI. When the RSI exceeds the threshold levels of 70 or falls below the threshold level of 30, it indicates a strong momentum condition. By incorporating this confluence condition, the indicator ensures that mean reversion signals align with the prevailing market momentum. It reduces the likelihood of false signals and provides traders with added confidence when entering trades.
The indicator offers alert conditions to notify traders of potential trading opportunities. Alert conditions are set to trigger when a potential long entry signal (1) or a potential short entry signal (-1) aligns with the confluence condition. These alerts allow traders to stay informed about favorable mean reversion setups, even when they are not actively monitoring the charts. By leveraging alerts, traders can efficiently manage their time and take advantage of market opportunities.
To enhance visual interpretation, the indicator incorporates background coloration that provides valuable insights into the prevailing market conditions. When the indicator generates a potential short entry signal (-1) that aligns with the confluence condition, the background color is set to lime. This color suggests a bullish trend that is potentially reaching an exhaustion point and about to revert downwards. Similarly, when the indicator generates a potential long entry signal (1) that aligns with the confluence condition, the background color is set to fuchsia. This color represents a bearish trend that is potentially reaching an exhaustion point and about to revert upwards. By employing background coloration, the indicator enables traders to quickly identify market conditions that may offer mean reversion opportunities with a directional bias.
The indicator further enhances visual clarity by incorporating bar coloring that aligns with the prevailing market conditions and signals. When the indicator generates a potential short entry signal (-1) that aligns with the confluence condition, the bar color is set to lime. This color signifies a bullish trend that is potentially reaching an exhaustion point, indicating a high probability of a downward reversion. Conversely, when the indicator generates a potential long entry signal (1) that aligns with the confluence condition, the bar color is set to fuchsia. This color represents a bearish trend that is potentially reaching an exhaustion point, indicating a high probability of an upward reversion. By using distinct bar colors, the indicator provides traders with a clear visual distinction between bullish and bearish trends, facilitating easier identification of mean reversion opportunities within the context of the broader trend.
While the "Adaptive Mean Reversion Indicator" offers a robust framework for identifying mean reversion opportunities, it's important to remember that no indicator is foolproof. Traders should exercise caution and employ risk management strategies. Additionally, it is recommended to use this indicator in conjunction with other technical analysis tools and fundamental factors to make well-informed trading decisions. Regular backtesting and refinement of the indicator's parameters are crucial to ensure its effectiveness in different market conditions.
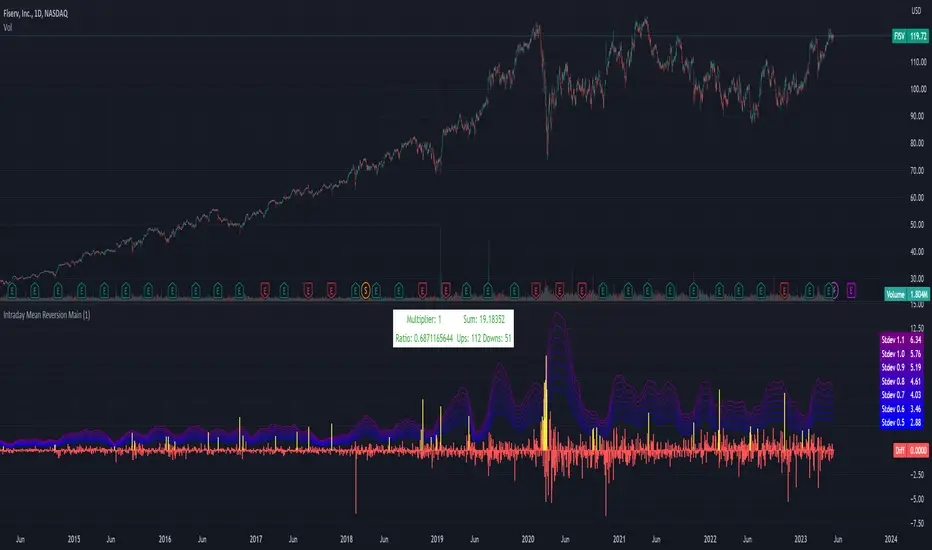
Intraday Mean Reversion MainThe Intraday Mean Reversion Indicator works well on certain stocks. It should be used for day trading stocks but need to be applied on the Day to Day timeframe.
The logic behind the indicator is that stocks that opens substantially lower than yesterdays close, very often bounces back during the day and closes higher than the open price, thus the name Intraday Mean reversal. The stock so to speak, reverses to the mean.
The indicator has 7 levels to choose from:
0.5 * standard deviation
0.6 * standard deviation
0.7 * standard deviation
0.8 * standard deviation
0.9 * standard deviation
1.0 * standard deviation
1.1 * standard deviation
The script can easily be modified to test other levels as well, but according to my experience these levels work the best.
The info box shows the performance of one of these levels, chosen by the user.
Every Yellow bar in the graph shows a buy signal. That is: The stocks open is substantially lower (0.5 - 1.1 standard deviations) than yesterdays close. This means we have a buy signal.
The Multiplier shows which multiplier is chosen, the sum shows the profit following the strategy if ONE stock is bought on every buy signal. The Ratio shows the ratio between winning and losing trades if we followed the strategy historically.
We want to find stocks that have a high ratio and a positive sum. That is More Ups than downs. A ratio over 0.5 is good, but of course we want a margin of safety so, 0.75 is a better choice but harder to find.
If we find a stock that meets our criteria then the strategy will be to buy as early as possible on the open, and sell as close as possible on the close!
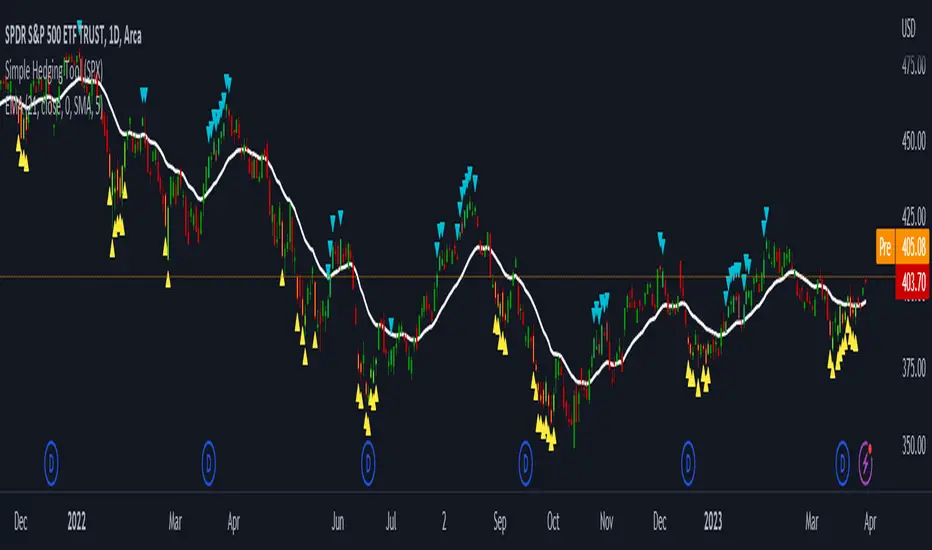
LNL Simple Hedging ToolLNL Simple Hedging Tool
Simple Hedging Tool was created specifically for swing traders who struggle with hedging. This tool helps to spot the ideal moments to put the hedges on (protection of the portfolio during "high risk" times). Simple Hedging Tool will not help you when day trading. It was designed for the daily charts. It is called simple because it is pretty much self-explanatory indicator. The candles are either blue or yellow. Meaning of the colors depend on the version you are using. This tool consist of two versions:
SPX Version:
This version was designed for indexes & overall market benchmarks. In contrast with the VIX version, the SPX version is little more sophisticated since it is based on key market internals. Blue arrows above the candles? More often than not this is signalizing that the key market internals are now approaching bearish signals which means it is the best time to hedge any bullish positions. On the contrary, the yellow arrows are the good reason to lighten up of the shorts & ease off the gas pedal on any bearish outlooks.
VIX Version:
Apart from the black swan events (big market crashes) Vix usually oscillates between the daily extremes. The VIX version is based on a simple bollinger band technique which is visualized with blue & yellow arrows. Whenever the yellow arrows & candles appear, it is good time to put the hedges on & perhaps lighten up on longs.
IMPORTANT DISCLAIMER:
The signals from this tool WILL NOT TELL YOU where to buy or sell! But rather when is a good time TO NOT buy or TO NOT sell. Once the signals appear it does not necessarily mean that the move is over & reversion willl happen immidiately. These signals can be flashing for days even weeks. They are not flashing for you to change the bias but rather tighten up your exposure in case your portfolio is mostly one sided.
Hope it helps.
Rekt Edge Reversion BandRekt Edge Reversion band is a technical indicator that utilizes a combination of moving averages and standard deviations to determine optimal entry and exit points in the market. By comparing the current price to its moving average, the indicator identifies potential trends and determines how you can position around them by plotting buy/sell signals and two channels based on user input parameters. The user can choose between Simple Moving Average ( SMA ) or Exponential Moving Average ( EMA ) and select the moving average period, the unit of separation, the multiples of the unit, and other important parameters. The indicator's inputs can be adjusted to suit different trading styles, and it can be used on any time frame. The indicator can be used to identify potential trend reversals or breakouts (or breakdowns) when the price moves outside of the channels. The indicators potential use cases include identifying overbought or oversold conditions. With its ability to provide a clear signal on when to enter and exit a trade, this indicator is a popular tool among traders looking to make more informed and profitable trading decisions. This indicator can also be used in conjunction with other technical analysis tools to confirm or invalidate trading signals.

range_statA basic statistic to describe "ranges". There are three inputs:
- short range
- long range
- moving average length
The output is a ratio of the short range to the long range. In the screenshot example, the short range is a single day (bar) and the long range is five days. A value near "1" would mean that every day entirely fills the five day range, and that a consolidation is likely present. A value near 0 would mean that each day fills only a small portion of the five day range, and price is probably "trending".
The moving average length is for smoothing the result (which also lags it of course).
The mean, and +- 2 standard deviations are plotted as fuchsia colored lines.

Keltner Channels Bands (RMA)Keltner Channel Bands
These normally consist of:
Keltner Channel Upper Band = EMA + Multiplier ∗ ATR
Keltner Channel Lower Band = EMA − Multiplier ∗ ATR
However instead of using ATR we are using RMA
This gives us a much smoother take of the KCB
We are also using 2 sets of bands built on 1 Moving average, this is a common set up for mean reversion strategies.
This can often be paired with RSI for lower timeframe divergences
Divergence
This is using the RSI to calculate when price sets new lows/highs whilst the RSI movement is in the opposite direction.
The way this is calculated is slightly different to traditional divergence scripts. instead of looking for pivot highs/lows in the RSI we are logging the RSI value when price makes it pivot highs/lows.
Gradient Bands
The Gradient Colouring on the bands is measuring how long price has been either side of the MA.
As Keltner bands are commonly used as a mean reversion strategy, I thought it would be useful to see how long price has been trending in a certain direction, the stronger the colours get,
the longer price has been trending that direction which could suggest we are looking for a retrace soon.
Alerts
Alerts included let you choose whether you want to receive an alert for the inside, outside or both band touches.
To set up these alerts, simply toggle them on in the settings, then click on the 3 dots next to the indicators name, from there you click 'Add Alert'.
From there you can customise the alert settings but make sure to leave the 2 top boxes which control the alert conditions. They will be default selected onto your correct settings, the rest you may want to change.
Once you create the alert, it will then trigger as soon as price touches your chosen inside/outside band.
Suggestions
Please feel free to offer any suggestions which you think could improve the script
Disclaimer
The default settings/parameters were shared by Jimtalbott, feel free to play about with the and use this code to make your own strategies.

Mean Reversion DotsMarkets tend to mean revert. This indicator plots a moving average from a higher time frame (type of MA and length selectable by the user). It then calculates standard deviations in two dimensions:
- Standard deviation of move of price away from this moving average
- Standard deviations of number of bars spent in this extended range
The indicator plots a table in the upper right corner with the % of distance of price from the moving average. It then plots 'mean reversion dots' once price has been 1 or more standard deviations away from the moving average for one or more standard deviations number of bars. The dots change color, becoming more intense, the longer the move persists. Optionally, the user can display the standard deviations in movement away from the moving average as channels, and the user can also select which levels of moves they want to see. Opting to see only more extreme moves will result in fewer signals, but signals that are more likely to imminently result in mean reversion back to the moving average.
In my opinion, this indicator is more likely to be useful for indices, futures, commodities, and select larger cap names.
Combinations I have found that work well for SPX are plotting the 30min 21ema on a 5min chart and the daily 21ema on an hourly chart.
In many cases, once mean reversion dots for an extreme enough move (level 1.3 or 2.2 and above) begin to appear, a trade may be initiated from a support/resistance level. A safer way to use these signals is to consider them as a 'heads up' that the move is overextended, and then look for a buy/sell signal from another indicator to initiate a position.
Note: I borrowed the code for the higher timeframe MA from the below indicator. I added the ability to select type of MA.

Daily/Weekly ExtremesBACKGROUND
This indicator calculates the daily and weekly +-1 standard deviation of the S&P 500 based on 2 methodologies:
1. VIX - Using the market's expectation of forward volatility, one can calculate the daily expectation by dividing the VIX by the square root of 252 (the number of trading days in a year) - also know as the "rule of 16." Similarly, dividing by the square root of 50 will give you the weekly expected range based on the VIX.
2. ATR - We also provide expected weekly and daily ranges based on 5 day/week ATR.
HOW TO USE
- This indicator only has 1 option in the settings: choosing the ATR (default) or the VIX to plot the +-1 standard deviation range.
- This indicator WILL ONLY display these ranges if you are looking at the SPX or ES futures. The ranges will not be displayed if you are looking at any other symbols
- The boundaries displayed on the chart should not be used on their own as bounce/reject levels. They are simply to provide a frame of reference as to where price is trading with respect to the market's implied expectations. It can be used as an indicator to look for signs of reversals on the tape.
- Daily and Weekly extremes are plotted on all time frames (even on lower time frames).

[Sidders]Std. Deviation from Mean/MA (Z-score)This indicator visualizes in a straight forward way the distance price is away from the mean in absolute standard deviations (Z-score) over a certain lookback period (can be configured). Additionally I've included a moving average of the distance, the MA type can be configured in the settings.
Personally using this indicator for some of my algo mean reversion strategies. Price reaching the extreme treshold (can be configured in settings, standard is 3) could be seen as a point where price will revert to the mean.
I've included alerts for when price crosses into extreme areas, as well as alerts for when crosses back into 'normal' territory again. Both are also plotted on the indicator through background coloring/shapes.
Since I've learned so much from other developers I've decided to open source the code. Let me know if you have any ideas on how to improve, I'll see if I can implement them.
Enjoy!

Multiple Indicator 50EMA Cross AlertsHere’s a screener including Symbol, Price, TSI, and 50 ema cross in a table output.
The 50 Exponential Moving Average is a trend indicator
You can find bullish momentum when the 50 ema crossed over or a bearish momentum when the 50 ema crossed under we are looking to take advantage by trading the reversion of these trends.
True strength index (TSI) is a trend momentum indicator
Readings are bullish when the True Strength Index shows positive values
Readings are bearish when the indicator displays negative values.
When a value is above 20, we look for selling overbought opportunity and when the value is under 20, we look for buying oversold opportunity.
You can select the pair of your choice in the settings.
Make sure to create an alert and choose any alerts then an alert will trigger when a price cross under or cross over the 50 ema for every pair separately.
This allow the user to verify if there is a trade set up or not.
Disclaimer
This post and the script don’t provide any financial advice.
