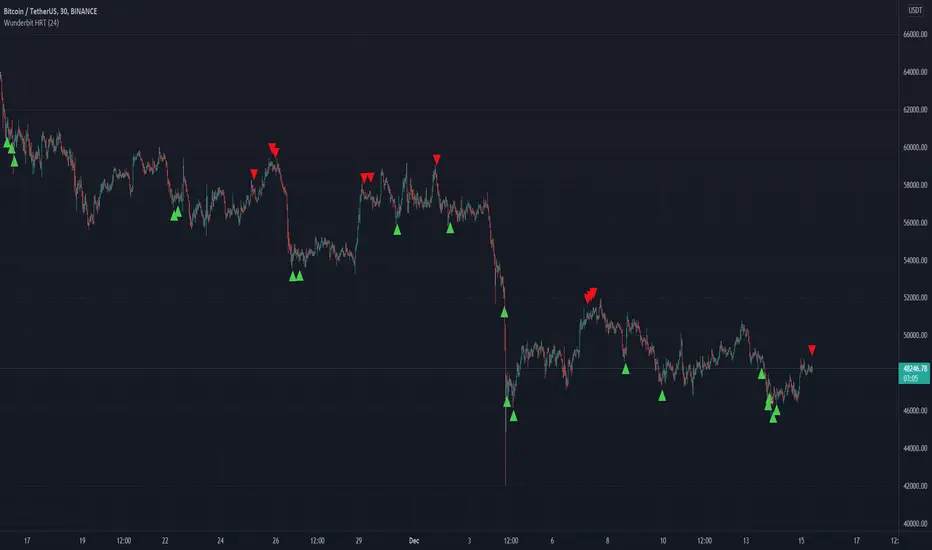
Wunderbit HRT BotWunderbit HRT is a proprietary indicator designed to find pivot points in the cryptocurrency market.
Working timeframes from 30 minutes and above.
The indicator is designed to create automated trading strategies using a webhook.
To create a cryptocurrency robot for this indicator, you need:
1. Create alerts and bind the URL to the webhook.
2. Link the Tradingview indicator to automation services.
For signals, alerts are used: LONG and SHORT
Recommendations for the indicator:
1. Use DSA technology for automation.
2. Be sure to disable the "multiple inputs" function.
3. Use an indicator with oscillators or MACD to confirm the entry point.
Reversal
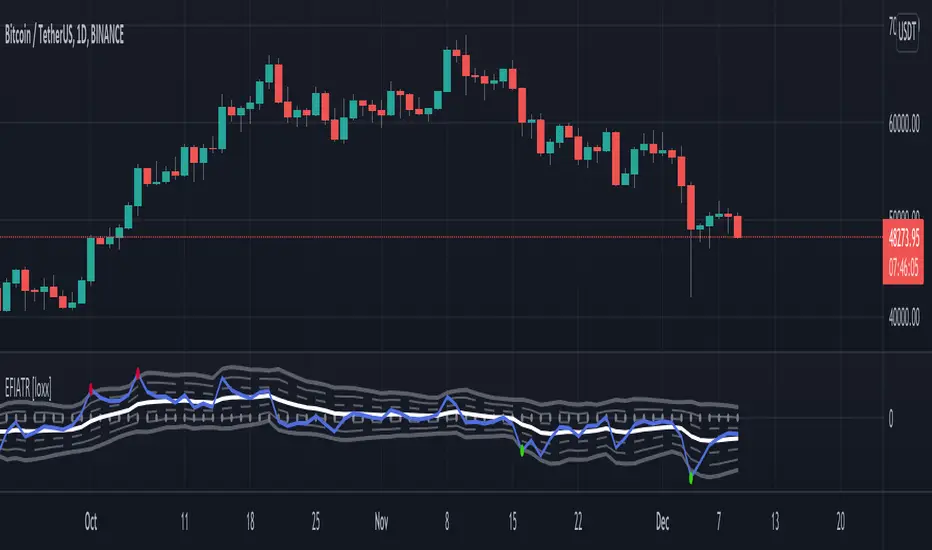
Elder Force Index With ATR Channels [loxx]Elder Force Index With ATR Channels, adaptive from original script by Dr. Alexander Elder
What it does
-EFI is used to sport reversals mainly on the weekly time frame
-When EFI spikes over 3 x ATR calculated on the signal line, price is said to have exhausted and you can start looking for reversals
Features
-Change all inputs
-Truncate EFI at 4 x ATR so as to not squish the indicator
-Open source, use code as you wish. If you use this code, shoot me a line and tell me how you're using it
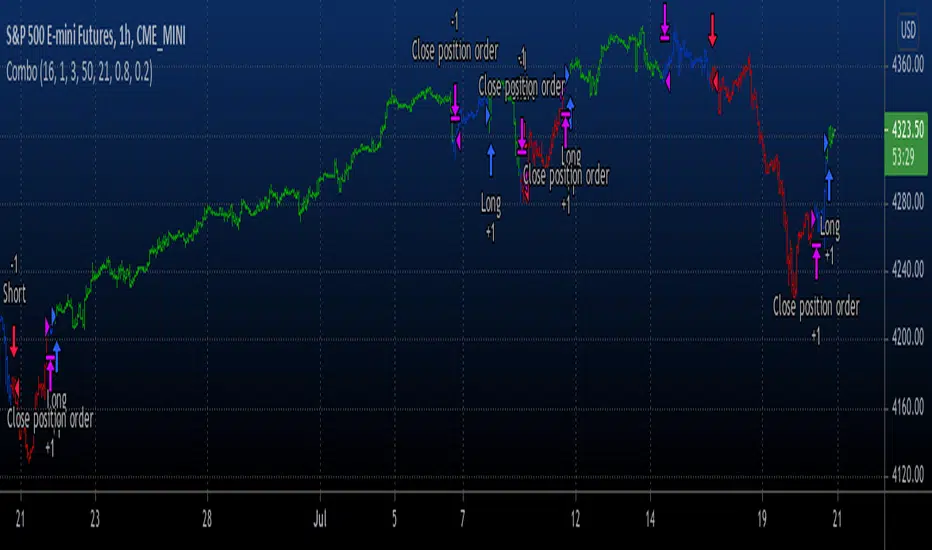
Combo Backtest 123 Reversal & TEMA1This is combo strategies for get a cumulative signal.
First strategy
This System was created from the Book "How I Tripled My Money In The
Futures Market" by Ulf Jensen, Page 183. This is reverse type of strategies.
The strategy buys at market, if close price is higher than the previous close
during 2 days and the meaning of 9-days Stochastic Slow Oscillator is lower than 50.
The strategy sells at market, if close price is lower than the previous close price
during 2 days and the meaning of 9-days Stochastic Fast Oscillator is higher than 50.
Second strategy
This study plots the TEMA1 indicator. TEMA1 ia s triple MA (Moving Average),
and is calculated as 3*MA - (3*MA(MA)) + (MA(MA(MA)))
WARNING:
- For purpose educate only
- This script to change bars colors.
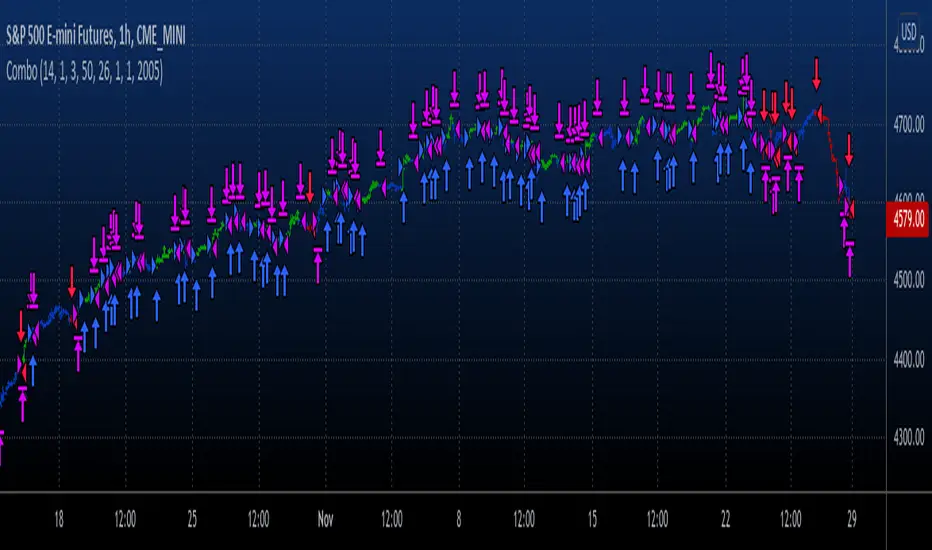
AG FX - Pivot PointsPivot Points High Low
Definition
The Pivot Points High Low indicator is used to determine and anticipate potential changes in market price and reversals. The Highs referred to in the title are created based on the number of bars that exhibit lower highs on either side of a Pivot Point High, whereas the Lows are created based on the number of bars that exhibit higher lows on either side of a Pivot Point Low.
Calculations
As mentioned above, Pivot Point Highs are calculated by the number of bars with lower highs on either side of a Pivot Point High calculation. Similarly, Pivot Point Lows are calculated by the number of bars with higher lows on either side of a Pivot Point Low calculation.
Takeaways and what to look for
A Pivot Point is more significant or noteworthy if the trend is extended or longer than average. This can mean if a trader selects a higher period for before and after the Pivot Point, the trend could be longer and therefore prove the Pivot Point itself more notable.
Additionally, Pivot Points can help a trader assess where would be best to draw. By analyzing price changes and reversals, a trader has more of an ability to determine and predict price patterns and general price trends.
Summary
The Pivot Points High Low indicator can predict and determine price changes and potential reversals in the market. Pivot Points can also help traders identify price patterns and trends, depending on the period and significance of the Pivot Point value.

Fear Of Missing Out grid of forex tradingAbstract
This script finds potential safe grids placing limit orders without fear of missing out.
This script computes grids according to power of 1.0025 .
You can reference those price levels for your trading.
Introduction
Grid trading is a popular trading method.
Traders plan several price levels as grids and repeat buying at lower grids and selling at higher grids.
Grids can be round number like multiple of 100 pips.
Grids can also be support and resistance according to price history.
Some traders may think they need to adjust grids to trade.
However, there are several problems in choosing grids.
One problem is rate of change is related and therefore exponential. 20 to 30 is different from 30 to 40.
Another interesting point is there are some special impressing reversal price levels.
Several months ago, I had a question why usdjpy bounced near 108.3 .
After using a calculator, I found that 108.3 = 100 * 1.083 ≒ 100 * pow(1.0025,31) .
1.0025 , as known as 0.25% of change, is a potential stop out zone.
Therefore, we can compute grids and one grid is a little more than 1.0025 times than an another one.
After we finished computing grids, we can consider buy and sell near those grids.
Note that different traders may obtain different grid values.
For example, from 1.0 to 2.0 , it can be splited as 270 grids or 277 grids because pow(1.0025,277)<2 .
Those grids cannot always imply potential reversal points but they can be useful for traders looking for 0.25% profit targets with reducing fearing of buying or selling too early.
Computing grids
This script split from 1.0 to 10.0 into three segments.
One is 1.0 to 2.0 .
The second segment is from 2.0 to 5.0 .
The third segment is from 5.0 to 10.0 .
This script does the same thing for 0.1 to 1.0 , 10.0 to 100.0 , and so on.
For 1.0 to 2.0 and 5.0 to 10.0 , this script split a segment as 270 grids.
For 2.0 to 5.0 , this script split a segment as 360 grids.
The last step is display the next grids to the daily low and daily high.
Maybe also display the grids behind grids shown.
Parameters
x1,x2,x3,x4 : display the next x1,x2,x3,x4 grids to daily high and daily low. 1 means the next grid to daily high and daily low. 2 means the next grid to 1.
x_seg : default 2.0 . This script split from 1.0 to 10.0 into three segments. One is 1.0 to x_seg. The second segment is from x_seg to 10.0/x_seg . The third segment is from 10.0/x_seg to 10.0 .
x_grid1 : how many grids in the first segment
x_grid2 : how many grids in the second segment
x_lowprice : add this number for bigger grid distance. Generally, you don't need this number when trading forex but you may need it in stock trading. For stocks with price between 50 to 100, I recommend you use x_lowprice=100.
Conclusion and suggestions
This script can find potential grids for trading.
If price touches grids usually, we can consider buy and sell after price touches grids.
If price reverses before touching grids usually, we may consider buy and sell before price touches grids.
Those grids can remind us don't buy too much unless the price touches the next grid.
For instruments with less volatility, maybe we need more grids.
For traders with more money, they may also consider more grids for more dedicated range trading to collect more profit.
Reference
Sorry, I forgot them.

EneX SignalEneX is signal that give recommendation signals for entry and exit on spot market. This indicators not suitable for leverage trading in futures market.
EneX signal consider several indicators and has entry and exit rules.
EneX signal is suitable for investors who believe in trend following strategy (disclaimer on).
This script composed by Yohan Naftali for educational purpose only. Reader who will use this signal must do own research.
Indicator and Plot Involved
1. Williams Fractals with default periods = 2
2. William Alligator Indicators with default simple moving average 8, 13, and 21
3. Exponential Moving Averages with default value EMA 50, 100, and 200
4. Relative Strength Index with default overbought level = 80 and oversold level = 20
5. Williams Fractals are joined to create support and resistance line and fill area between support and resistance lines.
Entry signal conditions
1. Entry on Weakness when bullish fractal appear on n/2 period
2. Entry when price break resistance line
All entry condition must above EMA and alligator signal and not in overbought RSI
Exit signal conditions
1. Lowest price is below Exponential Moving Average
2. Lowest price is below William alligator lines
You can easily find entry and exit points by using Entry (E), Exit(X) signals
How to use
1. Monitor chart and wait until E or X signals
2. Entry if Entry Signal (E) appear (green colored label)
3. Exit if Exit Signal (X) appear (red colored label)
4. Change indicators setting when necessary
Best Practice
1. Entry only when entry signal (E) appear
2. Never entry when price below William alligator signal
3. Exit when exit signal (X) appear
4. Not exit when exit signal appear when you believe or you have information that price will be rebound
5. Exit if you believe that current price meet your target price
6. Always wise when use EneX signals
Disclaimer
Do your own research and consider fundamental price of asset.
The indicators provided on this script is for educational purposes only.
Author does not offer advisory or brokerage services, nor does it recommend or advise users to buy or sell particular stocks or securities.
Please examined script and give feedback for further improvement.

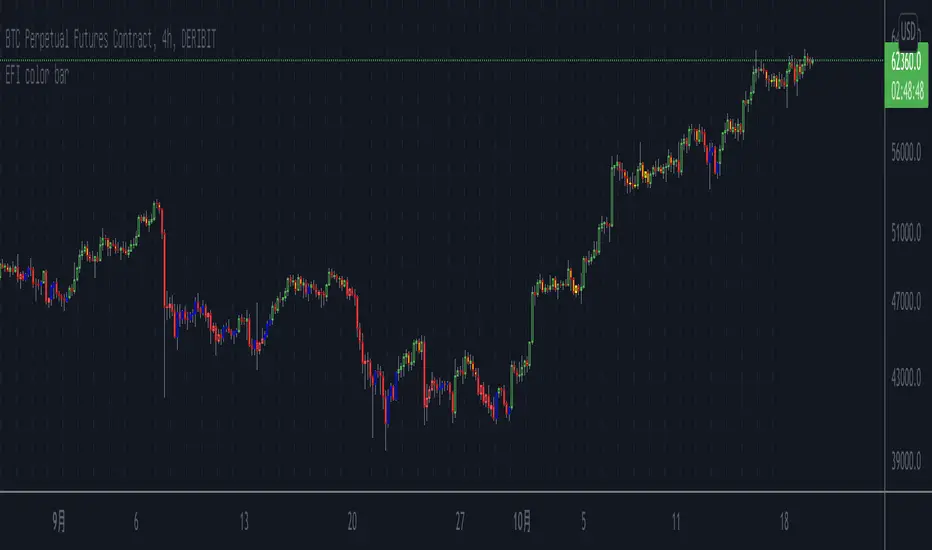
Elder's Force Index Color BarBased on the Elder's Force Index (EFI) , +/- of the EFI and its ema is used to describe the rise, fall or possible reversal of the market, and finally shown by bar color.
The green bar represents a strong bull and the red bar represents a strong bear;
The blue bar indicates that the downtrend is exhausted and may rise. Likewise the yellow bar.
Of course, it is difficult to buy the bottom and sell the top at any time. This indicator needs to be judged together with the pattern or other indicators that predict reversals in order to increase the win rate.
Happy Trading.
根据Elder's Force Index修改而成,取消了幅图指标,仅用bar color来表现上涨,下跌和转折。
绿色k线代表上涨动能充足,红色k线表示下跌动能充足;
蓝色k线表示下跌力竭,可能会上涨;
黄色k线表示上涨力竭,可能会下跌。
当然,任何时候抄底摸顶都是困难的,该指标需要和形态或者其他预测反转的指标一起判断才能增加成功率。
祝交易愉快。
緑は上昇トレンドで、赤は下落トレンドです;
青は下落が尽きて上昇する可能性があることを示すことで、黄色は上昇が終わり、下落の可能性があることを示しています。
成功率を高めるためには、パターンや反転を予測する他の指標と合わせて判断する必要があります。
Happy Trading。
Combo Backtest 123 Reversal & T3 Averages This is combo strategies for get a cumulative signal.
First strategy
This System was created from the Book "How I Tripled My Money In The
Futures Market" by Ulf Jensen, Page 183. This is reverse type of strategies.
The strategy buys at market, if close price is higher than the previous close
during 2 days and the meaning of 9-days Stochastic Slow Oscillator is lower than 50.
The strategy sells at market, if close price is lower than the previous close price
during 2 days and the meaning of 9-days Stochastic Fast Oscillator is higher than 50.
Second strategy
This indicator plots the moving average described in the January, 1998 issue
of S&C, p.57, "Smoothing Techniques for More Accurate Signals", by Tim Tillson.
This indicator plots T3 moving average presented in Figure 4 in the article.
T3 indicator is a moving average which is calculated according to formula:
T3(n) = GD(GD(GD(n))),
where GD - generalized DEMA (Double EMA) and calculating according to this:
GD(n,v) = EMA(n) * (1+v)-EMA(EMA(n)) * v,
where "v" is volume factor, which determines how hot the moving average’s response
to linear trends will be. The author advises to use v=0.7.
When v = 0, GD = EMA, and when v = 1, GD = DEMA. In between, GD is a less aggressive
version of DEMA. By using a value for v less than1, trader cure the multiple DEMA
overshoot problem but at the cost of accepting some additional phase delay.
In filter theory terminology, T3 is a six-pole nonlinear Kalman filter. Kalman
filters are ones that use the error — in this case, (time series - EMA(n)) —
to correct themselves. In the realm of technical analysis, these are called adaptive
moving averages; they track the time series more aggres-sively when it is making large
moves. Tim Tillson is a software project manager at Hewlett-Packard, with degrees in
mathematics and computer science. He has privately traded options and equities for 15 years.
WARNING:
- For purpose educate only
- This script to change bars colors.
Combo Backtest 123 Reversal & Stochastic Crossover This is combo strategies for get a cumulative signal.
First strategy
This System was created from the Book "How I Tripled My Money In The
Futures Market" by Ulf Jensen, Page 183. This is reverse type of strategies.
The strategy buys at market, if close price is higher than the previous close
during 2 days and the meaning of 9-days Stochastic Slow Oscillator is lower than 50.
The strategy sells at market, if close price is lower than the previous close price
during 2 days and the meaning of 9-days Stochastic Fast Oscillator is higher than 50.
Second strategy
This back testing strategy generates a long trade at the Open of the following
bar when the %K line crosses below the %D line and both are above the Overbought level.
It generates a short trade at the Open of the following bar when the %K line
crosses above the %D line and both values are below the Oversold level.
WARNING:
- For purpose educate only
- This script to change bars colors.

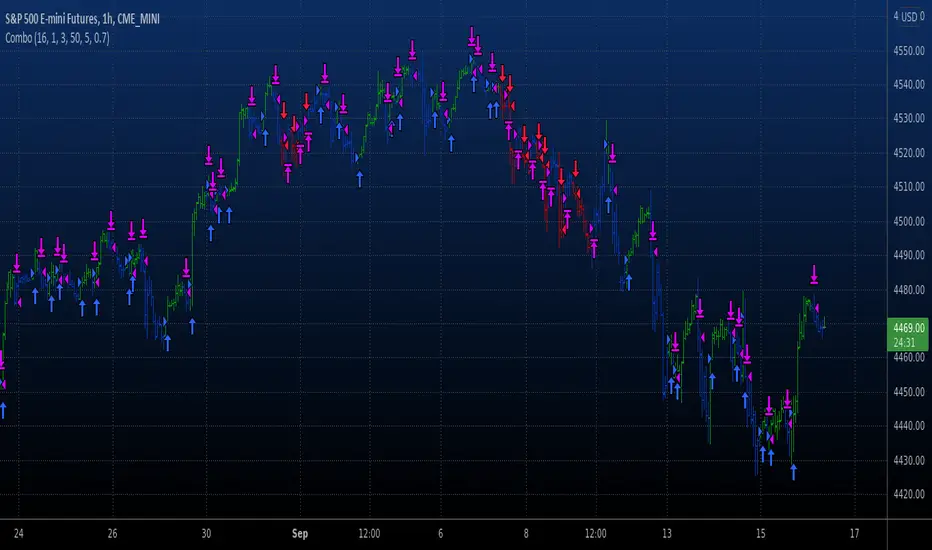
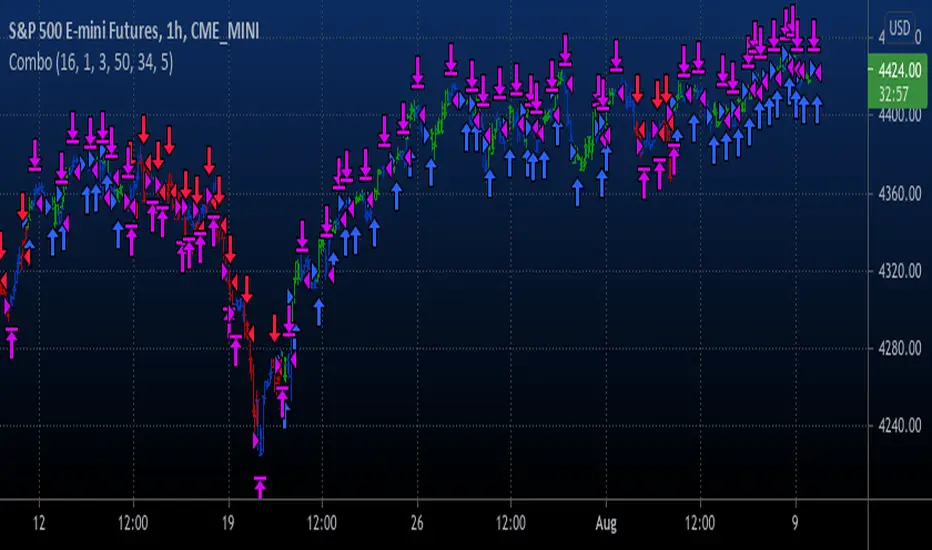
Volume Pressure AnalysisVolume Pressure Analysis is a new concept I have been working on designed to show the effort required to move price. An ideal tool for confirming trends or locating reversals early. This indicator can highlight whale action and market manipulation. It calculates volume vs volatility and displays the results as a meter:
Above 0 shows how easy price action is traveling, the bigger these bars the less volume and effort is required to push price. These are indicated with a teal or red arrows and can confirm the beginning or continuation of a trend. This is the natural direction the chart wants to travel at that time.
Below 0 shows how hard price is to move. The bigger these bars the more volume and effort is required to push price. When whales and market makers push price against its will these bars will get bigger.
Yellow arrows signal pressure in that direction and excessive amounts of volume is required to move price. These signals can lead to reversal/ pivot points as price action struggles to continue its trend. These signals can be turned on in settings or use the overlay version of this script to display signals on chart. This is a very powerful tool when used with relative volume.

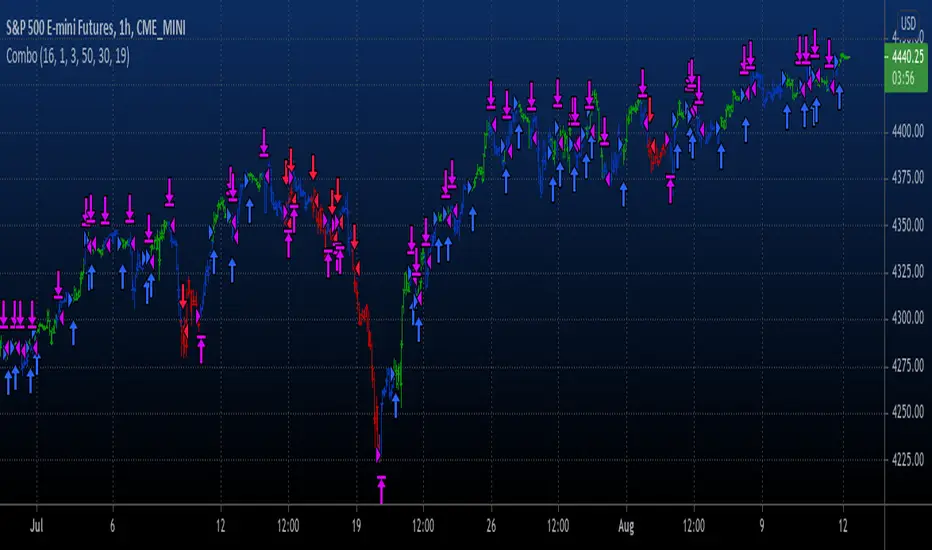
Volume Pressure Analysis - OverlayVolume Pressure Analysis is designed to show effort required to move price. This script is the overlay version that displays signals on the candles as well as changes the bar colors. Yellow arrows signal pressure in that direction and excessive amounts of volume is required to move price. These signals can lead to reversal/pivot points as price action struggles to continue its trend. Red and teal arrows indicate free flowing price action where very little effort or volume is needed to push price. These signals can confirm the beginning or continuation of a trend and is the natural direction the chart wants to travel at that time. For more information please check out the main Volume Pressure Analysis indicator.

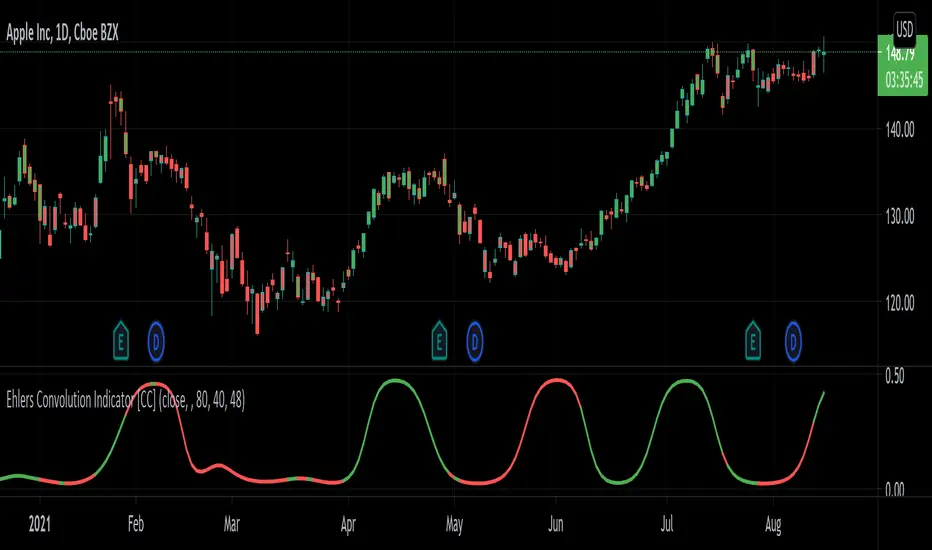
Ehlers Convolution Indicator [CC]The Convolution Indicator was created by John Ehlers (Cycle Analytics For Traders pgs 170-174) and this is version of an indicator to find potential reversal points. The idea behind this indicator is to use a variation of his AutoCorrelation Indicator that transforms the data using digital signal processing and as you can see it looks very similar to his BandPass Filter . The idea is that when this indicator peaks then it has reached a potential reversal point and so the stock may continue in the current direction but most of the time this indicator correctly points out the reversal points. I have included normal buy and sell signals but generally speaking you would want to buy when the indicator is around 0.05 to 0.10 and moving up and sell when it reaches its peak and is starting to move down.
Let me know if you have any other scripts you would like to see me publish!
Combo Backtest 123 Reversal & RSIThis is combo strategies for get a cumulative signal.
First strategy
This System was created from the Book "How I Tripled My Money In The
Futures Market" by Ulf Jensen, Page 183. This is reverse type of strategies.
The strategy buys at market, if close price is higher than the previous close
during 2 days and the meaning of 9-days Stochastic Slow Oscillator is lower than 50.
The strategy sells at market, if close price is lower than the previous close price
during 2 days and the meaning of 9-days Stochastic Fast Oscillator is higher than 50.
Second strategy
The RSI is a very popular indicator that follows price activity.
It calculates an average of the positive net changes, and an average
of the negative net changes in the most recent bars, and it determines
the ratio between these averages. The result is expressed as a number
between 0 and 100. Commonly it is said that if the RSI has a low value,
for example 30 or under, the symbol is oversold. And if the RSI has a
high value, 70 for example, the symbol is overbought.
WARNING:
- For purpose educate only
- This script to change bars colors.

Combo Backtest 123 Reversal & Awesome Oscillator (AO) This is combo strategies for get a cumulative signal.
First strategy
This System was created from the Book "How I Tripled My Money In The
Futures Market" by Ulf Jensen, Page 183. This is reverse type of strategies.
The strategy buys at market, if close price is higher than the previous close
during 2 days and the meaning of 9-days Stochastic Slow Oscillator is lower than 50.
The strategy sells at market, if close price is lower than the previous close price
during 2 days and the meaning of 9-days Stochastic Fast Oscillator is higher than 50.
Second strategy
This indicator is based on Bill Williams` recommendations from his book
"New Trading Dimensions". We recommend this book to you as most useful reading.
The wisdom, technical expertise, and skillful teaching style of Williams make
it a truly revolutionary-level source. A must-have new book for stock and
commodity traders.
The 1st 2 chapters are somewhat of ramble where the author describes the
"metaphysics" of trading. Still some good ideas are offered. The book references
chaos theory, and leaves it up to the reader to believe whether "supercomputers"
were used in formulating the various trading methods (the author wants to come across
as an applied mathemetician, but he sure looks like a stock trader). There isn't any
obvious connection with Chaos Theory - despite of the weak link between the title and
content, the trading methodologies do work. Most readers think the author's systems to
be a perfect filter and trigger for a short term trading system. He states a goal of
10%/month, but when these filters & axioms are correctly combined with a good momentum
system, much more is a probable result.
There's better written & more informative books out there for less money, but this author
does have the "Holy Grail" of stock trading. A set of filters, axioms, and methods which are
the "missing link" for any trading system which is based upon conventional indicators.
This indicator plots the oscillator as a histogram where periods fit for buying are marked
as blue, and periods fit for selling as red. If the current value of AC (Awesome Oscillator)
is over the previous, the period is deemed fit for buying and the indicator is marked blue.
If the AC values is not over the previous, the period is deemed fir for selling and the indicator
is marked red.
WARNING:
- For purpose educate only
- This script to change bars colors.
Combo Backtest 123 Reversal & Awesome Oscillator (AC) This is combo strategies for get a cumulative signal.
First strategy
This System was created from the Book "How I Tripled My Money In The
Futures Market" by Ulf Jensen, Page 183. This is reverse type of strategies.
The strategy buys at market, if close price is higher than the previous close
during 2 days and the meaning of 9-days Stochastic Slow Oscillator is lower than 50.
The strategy sells at market, if close price is lower than the previous close price
during 2 days and the meaning of 9-days Stochastic Fast Oscillator is higher than 50.
Second strategy
This indicator plots the oscillator as a histogram where blue denotes
periods suited for buying and red . for selling. If the current value
of AO (Awesome Oscillator) is above previous, the period is considered
suited for buying and the period is marked blue. If the AO value is not
above previous, the period is considered suited for selling and the
indicator marks it as red.
WARNING:
- For purpose educate only
- This script to change bars colors.
Volume Records + AlertContents
Overall Introduction
Settings menu parameters
Usage
How to use alerts
Limits
Overall Introduction
This indicator is a "volume analysis" tool for confirming the direction and strength of price trend and spotting trend reversals. This tool consists of two parts:
1- The colored graph is a custom volume oscillator which shows the relative changes in volume.
The darkening of the color of the bars is a sign of increasing volume.
2- Triangular labels that show trading volume records over different time periods based on the absolute values of the volume.
By creating an alert, you can be notified of new trading volume records. These records are:
Highest / lowest volume in one year,
Highest / lowest volume in six month
Highest / lowest volume in three month
Highest / lowest volume in one month
Highest / lowest volume in one week
Settings menu parameters
{Short Length} =>
The fast volume MA of the Volume Oscillator.
{Long Length} =>
The slow volume MA of the Volume Oscillator.
{Visual Parameters} =>
Parameters to personalize the appearance of the indicator.
{Alert Conditions Part 01: Highest Records ⏰ } =>
Parameters to customize the alert.
{Alert Conditions Part 02: Lowest Records ⏰ } =>
Parameters to customize the alert.
Usage
This indicator is a "volume analysis" tool for confirming the direction and strength of price trend and spotting trend reversals.
What Is Volume Analysis?
Volume analysis involves examining relative or absolute changes in an asset's trading volume in order to make inferences about future price movements.
A significant price increase along with a significant volume increase, for example, could be a credible sign of a continued bullish trend or a bullish reversal.
The gradual darkening of the bars is a sign of the strength of the trend.
Volume can be an indicator of market strength, as rising markets on increasing volume are typically viewed as strong and healthy.
How to use alerts
Note that by creating an alert, an instance of the indicator, with all your settings, will be activated on the site's server and alerts will be triggered by it.
After that, changing the indicator settings on the chart will no longer affect the alert.
Open the settings window and select the alert conditions as you wish
Click the Create Alert button (or press the A key while holding down the ALT key)
In the Condition section, select the name of the indicator.
Make the rest of the settings as you wish.
Finally, click on the Create button.
It's finished. After a few moments, your alert will be added to the Alerts menu.
Limits
The labels are displayed after the bars close.
Labels are displayed for the last 10,000 bars.

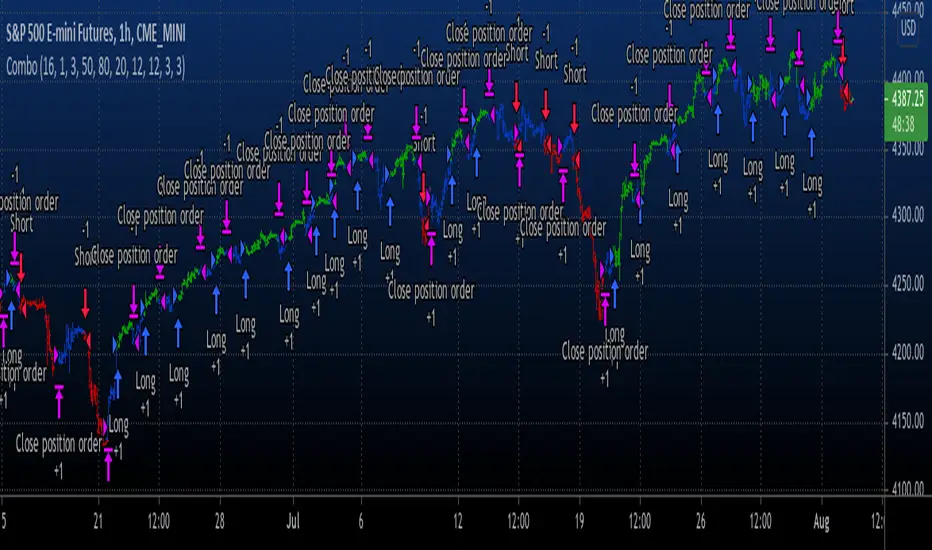
Pivot Reversal strategy long onlyPivot Point Reversal Strategy
Pivot point reversal strategy is based on the first support level’s price action during the bullish trend and the first resistance level during the bearish trend . Traders follow the main trend and enter into the trade after reversal analyzing pivot point levels.
This version is an upgraded version, combining the initial pivot point reversal strategy together with one of the most accuracy moving average in my opinion for day trade, the Least square moving average.
At the same time I applied an option to backtest using a date range and a leverage calculator.
The default options are optimized for BTC /USDT 2H charts, using 0.1% comission fee.
If you have any questions, let me know

Combo Backtest 123 Reversal & 2/20 Exponential MA This is combo strategies for get a cumulative signal.
First strategy
This System was created from the Book "How I Tripled My Money In The
Futures Market" by Ulf Jensen, Page 183. This is reverse type of strategies.
The strategy buys at market, if close price is higher than the previous close
during 2 days and the meaning of 9-days Stochastic Slow Oscillator is lower than 50.
The strategy sells at market, if close price is lower than the previous close price
during 2 days and the meaning of 9-days Stochastic Fast Oscillator is higher than 50.
Second strategy
This indicator plots 2/20 exponential moving average. For the Mov
Avg X 2/20 Indicator, the EMA bar will be painted when the Alert criteria is met.
WARNING:
- For purpose educate only
- This script to change bars colors.

Combo Backtest 123 Reversal & Stochastic RSIThis is combo strategies for get a cumulative signal.
First strategy
This System was created from the Book "How I Tripled My Money In The
Futures Market" by Ulf Jensen, Page 183. This is reverse type of strategies.
The strategy buys at market, if close price is higher than the previous close
during 2 days and the meaning of 9-days Stochastic Slow Oscillator is lower than 50.
The strategy sells at market, if close price is lower than the previous close price
during 2 days and the meaning of 9-days Stochastic Fast Oscillator is higher than 50.
Second strategy
This strategy used to calculate the Stochastic RSI
WARNING:
- For purpose educate only
- This script to change bars colors.
Combo Backtest 123 Reversal & Statistical Volatility This is combo strategies for get a cumulative signal.
First strategy
This System was created from the Book "How I Tripled My Money In The
Futures Market" by Ulf Jensen, Page 183. This is reverse type of strategies.
The strategy buys at market, if close price is higher than the previous close
during 2 days and the meaning of 9-days Stochastic Slow Oscillator is lower than 50.
The strategy sells at market, if close price is lower than the previous close price
during 2 days and the meaning of 9-days Stochastic Fast Oscillator is higher than 50.
Second strategy
This indicator used to calculate the statistical volatility, sometime
called historical volatility, based on the Extreme Value Method.
Please use this link to get more information about Volatility.
WARNING:
- For purpose educate only
- This script to change bars colors.

Combo Backtest 123 Reversal & STARC BandsThis is combo strategies for get a cumulative signal.
First strategy
This System was created from the Book "How I Tripled My Money In The
Futures Market" by Ulf Jensen, Page 183. This is reverse type of strategies.
The strategy buys at market, if close price is higher than the previous close
during 2 days and the meaning of 9-days Stochastic Slow Oscillator is lower than 50.
The strategy sells at market, if close price is lower than the previous close price
during 2 days and the meaning of 9-days Stochastic Fast Oscillator is higher than 50.
Second strategy
A type of technical indicator that is created by plotting two bands around
a short-term simple moving average (SMA) of an underlying asset's price.
The upper band is created by adding a value of the average true range
(ATR) - a popular indicator used by technical traders - to the moving average.
The lower band is created by subtracting a value of the ATR from the SMA.
STARC is an acronym for Stoller Average Range Channels. The indicator is
named after its creator, Manning Stoller.
WARNING:
- For purpose educate only
- This script to change bars colors.

Combo Backtest 123 Reversal & Smoothed Williams ADThis is combo strategies for get a cumulative signal.
First strategy
This System was created from the Book "How I Tripled My Money In The
Futures Market" by Ulf Jensen, Page 183. This is reverse type of strategies.
The strategy buys at market, if close price is higher than the previous close
during 2 days and the meaning of 9-days Stochastic Slow Oscillator is lower than 50.
The strategy sells at market, if close price is lower than the previous close price
during 2 days and the meaning of 9-days Stochastic Fast Oscillator is higher than 50.
Second strategy
Accumulation is a term used to describe a market controlled by buyers;
whereas distribution is defined by a market controlled by sellers.
Williams recommends trading this indicator based on divergences:
Distribution of the security is indicated when the security is making
a new high and the A/D indicator is failing to make a new high. Sell.
Accumulation of the security is indicated when the security is making
a new low and the A/D indicator is failing to make a new low. Buy.
WARNING:
- For purpose educate only
- This script to change bars colors.

Combo Backtest 123 Reversal & Smoothed RSIThis is combo strategies for get a cumulative signal.
First strategy
This System was created from the Book "How I Tripled My Money In The
Futures Market" by Ulf Jensen, Page 183. This is reverse type of strategies.
The strategy buys at market, if close price is higher than the previous close
during 2 days and the meaning of 9-days Stochastic Slow Oscillator is lower than 50.
The strategy sells at market, if close price is lower than the previous close price
during 2 days and the meaning of 9-days Stochastic Fast Oscillator is higher than 50.
Second strategy
This is new version of RSI oscillator indicator, developed by John Ehlers.
The main advantage of his way of enhancing the RSI indicator is smoothing
with minimum of lag penalty.
WARNING:
- For purpose educate only
- This script to change bars colors.