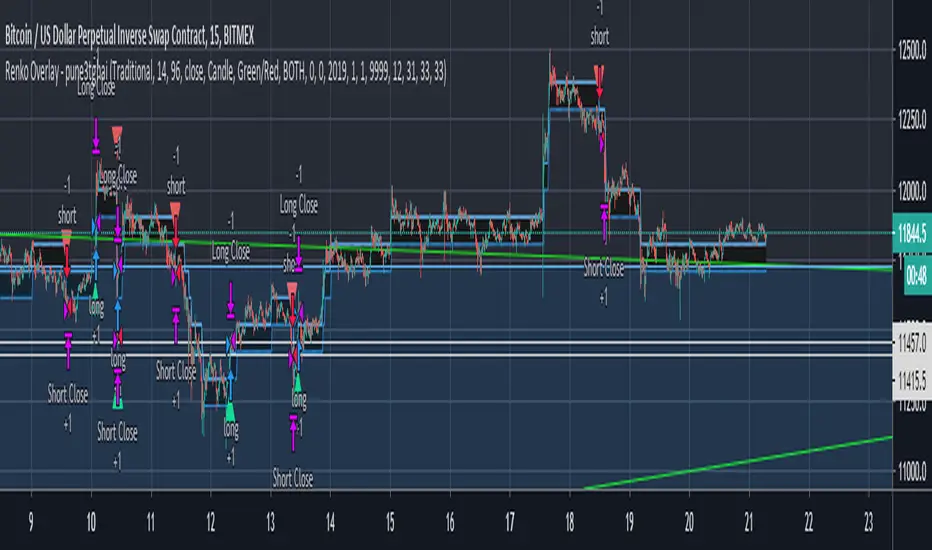
Renko Overlay - pune3tghaiThis is just one little upgrade to one of my Previously posted Premium Scripts. Posting it under public library for people so they start using Renko More.
The code is entirely my own and may repaint when used with ATR but with Traditional BrickSize it won't repaint.
I prefer using it with Renko Levels being considered as the Levels that need to break for further progression. For the time being I would Recommend that you simply study the indicator before applying it on your trades.
Remember, it is something that I follow personally but your trading settings may differ from mine.
If at any point you face problems using it, please feel free to reach out to me.
Renko
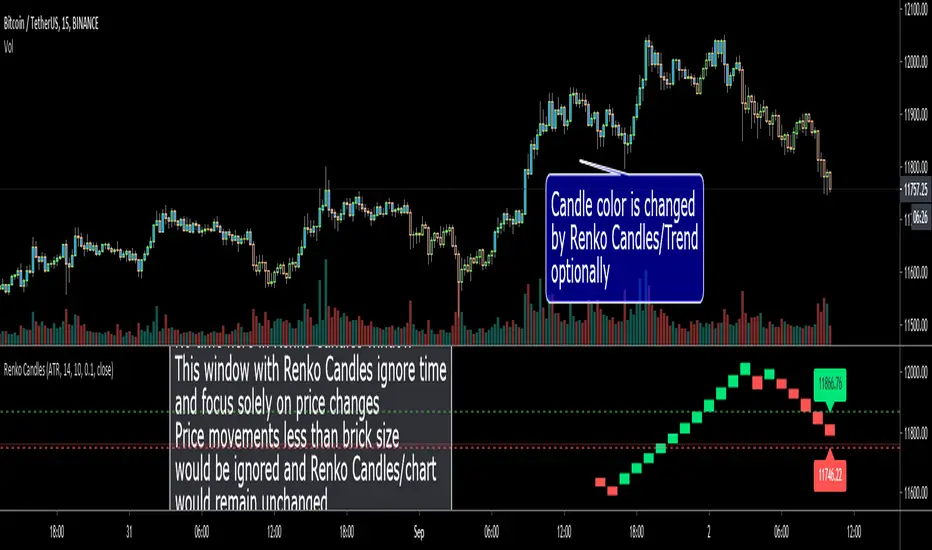
Renko CandlesHello Traders!
This scripts draws Renko Candles in a seperate window dynamically and live. it shows only last 20 Renko candles. there is no time in that window, that means this window with Renko candles ignore time and focus solely on price changes. For Example If the brick value is set at 10 points, a move of 10 points or more is required to draw another brick. Price movements less than 10 points would be ignored and the Renko chart would remain unchanged. If you don't know what Renko Chart/Candle is then you should read some articles about it ;)
"Method" in the option is same as in Renko Chart, two methods: "Traditional" or "ATR ". default value is ATR
if you choose Traditional method then you need to set brick size accordingly. Increasing or decreasing the box size will affect the "smoothness" of the chart.
if you choose ATR mode then brick size will be set by using Average True Range(ATR) indicator
You have option to use Closing Price or High/Low. by default it's "Close"
Optionally it can change candle colors by Renko Bricks/Trend
Optionally it can show the levels for new bricks.
in this example, Mode = Traditional and Brick size: 10
in this example, Mode = Traditional and Brick size: 50
in this example Mode = ATR
Do not forget to click "Donate" button ;)
Enjoy!
Hancock - Renko Brick ProductionThis is the accompanying script that shows how many renko bricks were produced in each direction per candle. It gives a basic indication of volatility, some might find it useful.
Happy trading
Hancock

renko candle strategy(lirshah)Renko candles strategy has been written based on renko box plots.
the strategy plots renko boxes and levels for trading,
the buy signals trigger when renko is on uptrend and hit the lower box border and similar scenario for sell signal.
the standard parameter are as bellow:
box size: 3.5$
take profit: 1000 pip
stop loss: 200 pip
the below overview is results of strategy on 1sec chart(normal candle) of Nasdaq index, with 1 contract and 0.5 $ commission per order during New york session.
in order to access scripts contact me directly.

Renko Level Strategy 2Renko Level Strategy
Main change of my previous strategy, that it look to one level of RENKO and use ATR value from each previous candle.
I think it is more correct than use levels that appears in first candle of new RENKO level, cause it base on current volatility, but not on volatility that was many candles ago.

Hancock - RenkoThis is the first release of Renko indicator.
Renko is plotted over candles and best calculates the number of Renko bricks printed up or down per candle which can be viewed from the data window. It plots the high and low of a the bricks, if numerous bricks are printed on a candle, as well as the open and close of a Renko brick.
This will be actively developed and improved over the next few months and i will be basing other indicators from this Renko.
Happy trading
Hancock

Up/Down Trend MarkerA simple indicator of trend by using 3 EMAs of multiplies of 2, 5 and 10, filtered by standard positive/negative directional movements (DM) which are the base of Average Directional Index (ADX).
The "Trend Strength" option is included to set the EMA multipliers and also the variation between DM+ and DM- which interpret the trend as a weak or a strong one.
Note that the markers only point to almost the beginning of the trends and just change the direction when the opposite trend is detected.
Feel free to send me your opinions.

RenkoNow you can plot a "Renko" chart on any timeframe for free! As with my previous algorithm, you can plot the "Linear Break" chart on any timeframe for free!
I again decided to help TradingView programmers and wrote code that converts a standard candles / bars to a "Renko" chart. The built-in renko() and security() functions for constructing a "Renko" chart are working wrong. Do not try to write strategies based on the built-in renko() function! The developers write in the manual: "Please note that you cannot plot Renko bricks from Pine script exactly as they look. You can only get a series of numbers similar to OHLC values for Renko bars and use them in your algorithms". However, it is possible to build a "Renko" chart exactly like the "Renko" chart built into TradingView. Personally, I had enough Pine Script functionality.
For a complete understanding of how such a chart is built, you can read to Steve Nison's book "BEYOND JAPANESE CANDLES" and see the instructions for creating a "Renko" chart:
Rule 1: one white brick (or series) is built when the price rises above the base price by a fixed threshold value or more.
Rule 2: one black brick (or series) is built when the price falls below the base price by a fixed threshold or more.
Rule 3: if the rise or fall of the price is less than the minimum fixed value, then new bricks are not drawn.
Rule 4: if today's closing price is higher than the maximum of the last brick (white or black) by a threshold or more, move to the column to the right and build one or more white bricks of equal height. A new brick begins with the maximum of the previous brick.
Rule 5: if today's closing price is below the minimum of the last brick (white or black) by a threshold or more, move to the column to the right and build one or more black bricks of equal height. A new brick begins with the minimum of the previous brick.
Rule 6: if the price is below the maximum or above the minimum, then new bricks are not drawn on the chart.
So my algorithm can to plot Traditional Renko with a fixed box size. I want to note that such a "Renko" chart is slightly different from the "Renko" chart built into TradingView, because as a base price I use (by default) close of first candle. How the developers of TradingView calculate the base price I don’t know. Personally, I do as written in the book of Steve Neeson.
The algorithm is very complicated and I do not want to explain it in detail. I will explain very briefly. The first part of the get_renko () function — // creating lists — creates two lists that record how many green bricks should be and how many red bricks. The second part of the get_renko () function — // creating open and close series — creates open and close series to plot bricks. So, this is a white box - study it!
As you understand, one green candle can create a condition under which it will be necessary to plot, for example, 10 green bricks. So the smaller the box size you make, the smaller the portion of the chart you will see.
I stuffed all the logic into a wrapper in the form of the get_renko() function, which returns a tuple of OHLC values. And these series with the help of the plotcandle() annotation can be converted to the "Renko" chart. I also want to note that with a large number of candles on the chart, outrages about the buffer size uncertainty are heard from the TradingView blackbox. Because of it, in the annotation study() set the value of the max_bars_back parameter.
In general, use this script (for example, to write strategies)!

Brick count (Renko)Brick is a part of Renko chart. It is reasonable to think, that is the number of green brick is higher than the number of red brick then the trend is bullish. This indicator plots the relative number of red bricks vs green bricks.

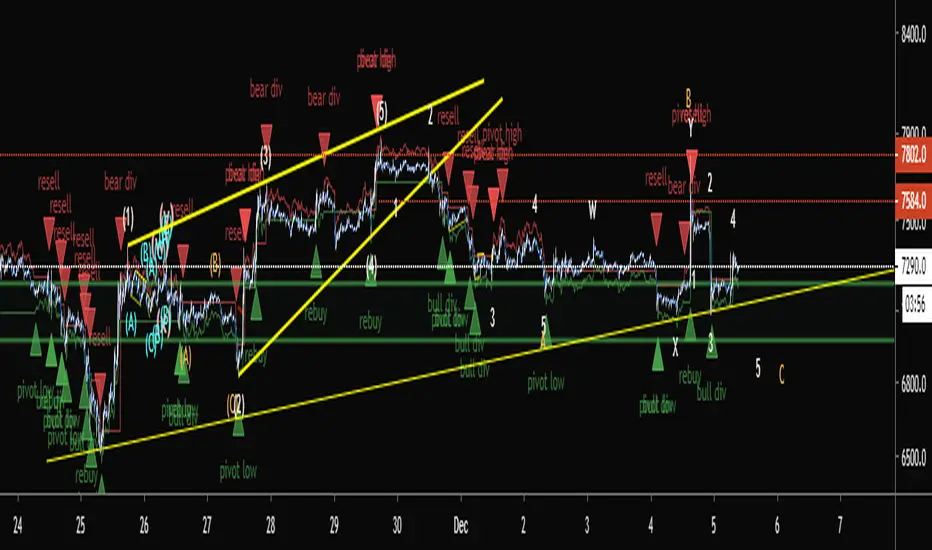
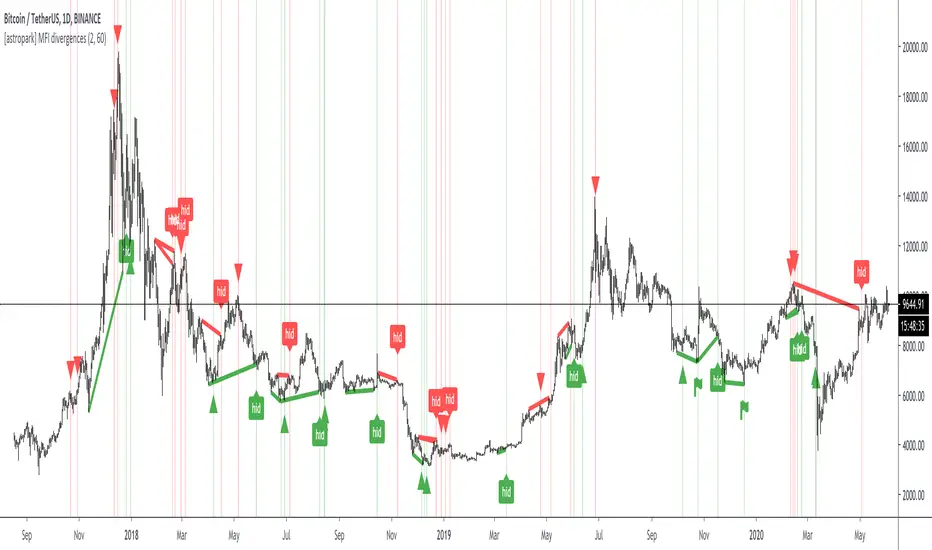
[astropark] MFI divergencesDear Followers,
today a new great Scalper Tool , based on a custom version of Money Flow (MFI) oscillator, which works on both Candlesticks, Heiking Ashi and Renko charts , from 1 second Renko chart and above (on non Renko charts, the higher, the better of course!), both on FOREX, Cryptocurrencies, Stocks and Commodities!
This tool has some cool features:
it works on all timeframes , on both Renko, Heikin Ashi and Candlesticks chart
it shows you both bullish and bearish divergences with a triangle up or down respectively
when it finds a strong bullish/bearish divergence , a flag will be displayed instead of a triangle
it shows you both hidden bullish and bearish divergences with a label "hid"
This script will let you set all notifications you may need in order to be alerted on each triggered divergence.
You may like to use it together with my Renko OBV Divergences indicator (which works on Candlesticks and Heiking Ashi too)
and my Renko RSI Divergences indicator (which works on Candlesticks and Heiking Ashi too)
On Bitmex/ByBit/Binance Bitcoin/USD chart best Renko settings is Traditional Renko chart with 11$ box size, while 0.5$ box size is suggested on Ethereum/USD pair.
This is a premium indicator , so send me a private message in order to get access to this script.
Renko AccelerationRenko is a very useful charting method for analyzing stock movement. It does a great job of filtering out all the excess noise so that all we're left with is pure price action. But, what about time? Time is a fundamental part of chart analysis and we are only seeing part of the picture. After all, shouldn't we take a very different approach to trading signals from a block that renders in 2 seconds as opposed to a block that renders in 30 minutes?
This indicator provides the best of both worlds, enabling us to correlate the passing of time with price movement and clearly see when squeezes and breakouts occur.
As the indicator turns up to green we can see that volatility is on the move and the market is accelerating (breakout), and as it turns down to red the market is stagnating (squeeze). There is also an alternate 'Precise' view which renders the exact time per block for more granular analysis.

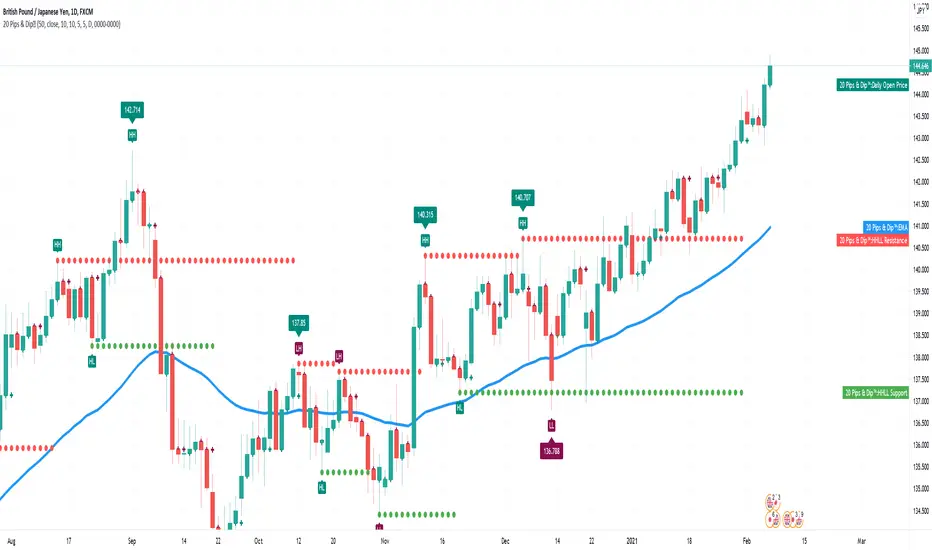
20 Pips & Dip™ Indicator20 Pips & Dipp script based on a few different indicators which together provides powerful help for all level of traders, especially beginners. Also, script have toggles to switch on/off: Renko Reversal, EMA, HHLL, Support/Resistance, Daily Open modules.
1st Module – Renko Reversal Alerts Indicator. The Indicator point out a spot where the revers are happens. Any changes in Price that do not reach a minimum amount are usually filtered. This helps to keep attention on larger, significant moves, and helps not to avoid the minute fluctuations in the market.
How it’s works?
- ENTER a trade JUST AFTER 1 Renko brick is printed. BUY triangle (green buy text with green triangle) is generated if a bearish Renko Brick is followed by a bullish brick. In other words, a buy signal happens when a white block is drawn after a black one. The buy happens then at the closing price that may be higher than the top of the last brick. It can go two bricks up minus a tick or pip.
- EXIT that trade, and open a new reverse position, just after 1 Renko brick is printed in the opposite direction. SELL triangle (red sell text with red triangle) is generated if a bullish brick is followed by a bearish brick. In other words, a sell signal happens when a black block is drawn, after a white block. The same situation as with a buy signal happens on sell signals. There is an uncertainty on the close price that may go as far as one tick above the next potential bearish block.
How to create custom ALERTS? Right click on a sell or buy triangle > Add Alert > 20 Pips & Dipp > Choose between Long or Short opportunity. In options field choose ONCE PER BAR. All other options you can choose according to your personal needs. If you want alert for another option (i.e. Short opportunity) just add one more.
Just to know! To understand how those module work better to switch to Renko chart. But Renko Chart with Renko brick size & Timeframe less than 1 day available only for PRO+ accounts and better. Also, we need to say that TradingView platform do not provide TICK data as we know. So, it may confuse you. Be careful!
2nd Module – Moving Average Exponential. The exponential moving average (EMA) is a weighted moving average (WMA) that gives more weighting, or importance, to recent price data than the simple moving average (SMA) does. The EMA responds more quickly to recent price changes than the SMA. The formula for calculating the EMA just involves using a multiplier and starting with the SMA. Like all moving averages, this technical indicator is used to produce buy and sell signals based on crossovers and divergences from the historical average. By default, our EMA have 50 period. The 50 moving average is the standard swing-trading moving average and very popular. Most traders use it to ride trends because it’s the ideal compromise between too short and too long term. Some people call it medium-term.
How to use it? EMAs are commonly used in conjunction with other indicators to confirm significant market moves and to gauge their validity. For traders who trade intraday and fast-moving markets, the EMA is more applicable. Quite often, traders use EMAs to determine a trading bias. For example, if an EMA on a daily chart shows a strong upward trend, an intraday trader’s strategy may be to trade only from the long side on an intraday chart.
Limitations of EMA! An EMA relies wholly on historical data. Many people believe that markets are efficient - that is, that current market prices already reflect all available information. If markets are indeed efficient, using historical data should tell us nothing about the future direction of asset prices.
3rd Module - Pivot Points (High/Low). Also known as Bar Count Reversals, are used to anticipate potential price reversals. Pivot Point Highs are determined by the number of bars with lower highs on either side of a Pivot Point High. Pivot Point Lows are determined by the number of bars with higher lows on either side of a Pivot Point Low. Default period is 10.
How this indicator works? The longer the trend (the higher the period selected) before and after the Pivot Point, the more significant the Pivot Point. Pivot Points can be used to help determine where to draw trendlines in order to visualize price patterns.
Calculation! Pivot Point Highs are determined by the number of bars with lower highs on either side of a Pivot Point High. Pivot Point Lows are determined by the number of bars with higher lows on either side of a Pivot Point Low.
4th Module - Higher High Lower Low indicator. Higher high and higher lows and Lower lows and lower highs are trends in a chart. Stocks in general never go up or down in linear fashion, every rise is followed by correction and then again it may either go up or down, same is true for downtrend every fall is followed by a correction in the upward direction and then new downtrend or uptrend is followed. After every rise, the stock took breather corrected to some extent and then new uptrend began, when you see the correction every low is higher than the previous lows and every next peak is higher than it’s previous peak. This is higher highs and higher lows trend.
How it’s work? This script finds pivot highs and pivot lows then calculates Higher Highs, Higher Lows & Lower Lows, Lower Highs. And it calculates support/resistance by using HH-HL-LL-LH points. Generally, HH and HL shows up-trend, LL and LH shows down-trend. If price breaks resistance levels it means the trend is up or if price breaks support level it means the trend is down, so the script can change bar colour blue or black by default. if there is up-trend then bar colour is blue, or if down-trend then bar colour is black. Support and resistance levels change dynamically.
Trick! If you use smaller numbers for Left Hand/Right Hand sides then it will be more sensitive!
5th Module - Daily Open Price. The opening price is the price at which a security first trades upon the opening of an exchange on a trading day; for example, the New York Stock Exchange (NYSE) opens at precisely 9:30 a.m. Eastern time. The price of the first trade for any listed stock is its daily opening price. The opening price is an important marker for that day's trading activity, particularly for those interested in measuring short-term results such as day traders.
Important! If daily open price was higher than current price, crosses will be red. And if daily open price lower than current price crosses will be green. Colours change dynamically.
You need to know it! An opening price is not identical to the previous day's closing price. There are several day-trading strategies based on the opening price of a market or security. Research “Gap Fade and Fill” or “Fade”.
Author – Christian Kopachelli . Huge thanks and credits to peoples which ideas, formulas, calculations, code snippets and code parts were used: Robert Nance, CryptoJoncis , FritzHaber , vacalo69 , Molle de Jong, Baris Yakut, LonesomeTheBlue , ChrisMoody , Robert N. ~~~ THANK you all! You are awesome!
DISCLAIMER! RISK WARNING!
PAST PERFORMANCE IS NOT NECESSARILY INDICATIVE OF FUTURE RESULTS. TRADERS SHOULD NOT BASE THEIR DECISION ON INVESTING IN ANY TRADING PROGRAM SOLELY ON THE PAST PERFORMANCE PRESENTED, ADDITIONALLY, IN MAKING AN INVESTMENT DECISION, TRADERS MUST ALSO RELY ON THEIR OWN EXAMINATION OF THE PERSON // OR ENTITY MAKING THE TRADING DECISIONS.
Flex Renko Emulator Strategy by Zack_The_LegoThe author of the study is Zack_The_Lego but i made it into a strategy because its an awesome study by him.

Renko Weis Wave VolumeThis is live and non-repainting Renko Weis Wave Volume tool. The tool has it’s own engine and not using integrated function of Trading View.
Renko charts ignore time and focus solely on price changes that meet a minimum requirement. Time is not a factor on Renko chart but as you can see with this script Renko RSI created on time chart.
Renko chart provide several advantages, some of them are filtering insignificant price movements and noise, focusing on important price movements and making support/resistance levels much easier to identify.
As source Closing price or High/Low can be used.
Traditional or ATR can be used for scaling. If ATR is chosen then there is rounding algorithm according to mintick value of the security. For example if mintick value is 0.001 and brick size (ATR/Percentage) is 0.00124 then box size becomes 0.001. And also while using dynamic brick size (ATR), box size changes only when Renko closing price changed.
This tool is based on the Weis Wave described by David H. Weis (a Wyckoff specialist). The Weis Waves Indicator sums up volumes in each wave. This is how we receive a bar chart of cumulative volumes of alternating waves and The cumulative volume makes the Weis wave charts unique.
If there is no volume information for the security then this tool has an option to use “True Range” instead of volume .
Better to use this script with the following one:
Enjoy!

Renko RSIThis is live and non-repainting Renko RSI tool. The tool has it’s own engine and not using integrated function of Trading View.
Renko charts ignore time and focus solely on price changes that meet a minimum requirement. Time is not a factor on Renko chart but as you can see with this script Renko RSI created on time chart.
Renko chart provide several advantages, some of them are filtering insignificant price movements and noise, focusing on important price movements and making support/resistance levels much easier to identify.
As source Closing price or High/Low can be used.
Traditional or ATR can be used for scaling. If ATR is chosen then there is rounding algorithm according to mintick value of the security. For example if mintick value is 0.001 and brick size (ATR/Percentage) is 0.00124 then box size becomes 0.001. And also while using dynamic brick size (ATR), box size changes only when Renko closing price changed.
Renko RSI is calculated by own Renko RSI algorithm.
Alerts added:
Renko RSI moved below Overbought level
Renko RSI moved above Overbought level
Renko RSI moved below Oversold level
Renko RSI moved above Oversold level
RSI length is 2 by default, you can set as you wish.
You better to use this script with the following one:
Enjoy!

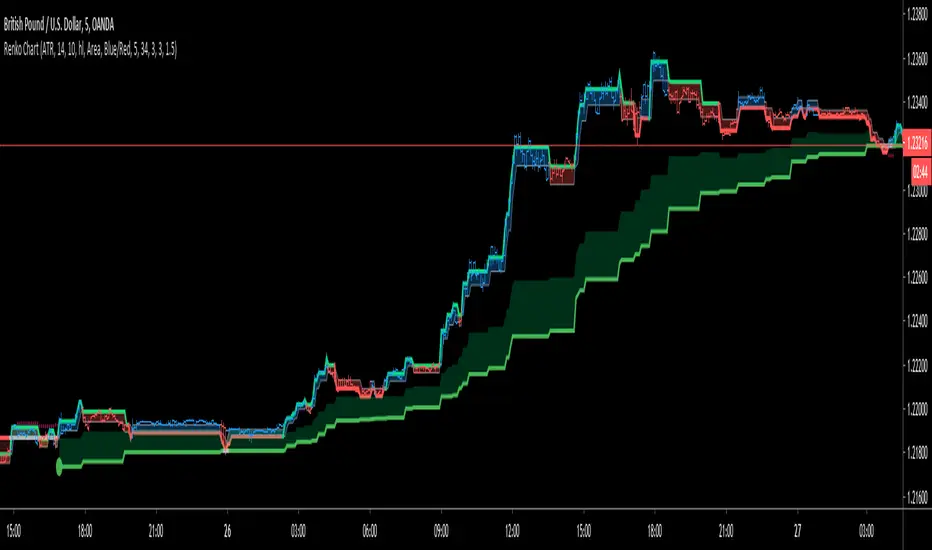
Renko ChartHello All. This is live and non-repainting Renko Charting tool. The tool has it’s own engine and not using integrated function of Trading View.
Renko charts ignore time and focus solely on price changes that meet a minimum requirement. Time is not a factor on Renko chart but as you can see with this script Renko chart created on time chart.
Renko chart provide several advantages, some of them are filtering insignificant price movements and noise, focusing on important price movements and making support/resistance levels much easier to identify.
in the script Renko Trend Line with threshold area is included. and also there is protection from whipsaws, so you can catch big waves with very good entry points. Trend line is calculated by EMA of Renko closing price.
As source Closing price or High/Low can be used. Traditional or ATR can be used for scaling. If ATR is chosen then there is rounding algorithm according to mintick value of the security. For example if mintick value is 0.001 and brick size (ATR/Percentage) is 0.00124 then box size becomes 0.001. And also while using dynamic brick size (ATR), box size changes only when Renko closing price changed.
Renko bar can be seen as area or candle and also optionally bar color changes when Renko trend changed.
Soon other Renko scripts (Renko RSI, Renko Weis Wave, Renko MACD etc) are coming ;)
ENJOY!
Renko Chart Alerts with PivotsAdd alerts to renko charts to be notified when:
new brick
brick up
brick down
direction change
direction change up
direction change down
Also shows pivots based on brick reversals. Alerts also available for:
pivot breakout
pivot high breakout
pivot low breakout
You can hide the plots for pivot high/low and breakouts in the style tab of the settings for the indicator.
To add the alerts:
add the indicator to your renko chart
click add alert
click the condition dropdown and choose Renko Alerts
you should see all the alerts there and you can add any one or more to your chart

MATRIX Rises on the wavesJust one more go at a zigzag , this time with the aid of renko emulator.
Apenas mais uma vez em zigue-zague, desta vez com a ajuda do emulador renko.
Surfe nas ondas do MATRIX

[astropark] Renko OBV divergencesDear Followers,
today a new great Scalper Tool , based on Ob Balance Volume (OBV) oscillator, which works from 1 minute timeframe Renko chart , which is the best and more secure timeframe to use on a Renko chart. But of course it works great on all timeframes (included the 1D timeframe), both on FOREX and on Cryptocurrencies!
This tool has some cool features:
it works on all timeframes , starting from 1 minute: so you can enjoy high-frequency trading by using a 24/7 running bot and a proper money and risk management strategy
it shows you both bullish and bearish divergences with a triangle up or down respectively
when it finds a strong bullish/bearish divergence , a flag will be displayed instead of a triangle
This script will let you set all notifications you may need in order to be alerted on each triggered divergence.
You may like to use it together with my Renko Scalper V2
and my Renko RSI Divergences indicator
On Bitmex/ByBit/Binance Bitcoin/USD chart best settings is Traditional Renko chart with 10$ box size, while 0.5$ box size is suggested on Ethereum/USD pair.
This is a premium indicator , so send me a private message in order to get access to this script.

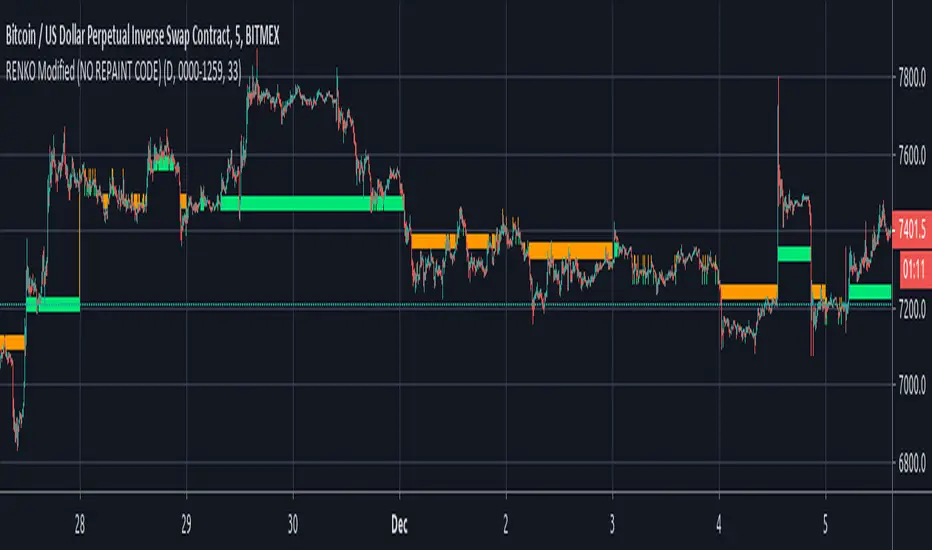
RENKO Modified (NO REPAINT CODE)I'm releasing this code in public Interest in hope of getting it improved by the community. If someone wants to use this code, then he/she should publish this code in Public Library with Open Source reference.
The code is entirely mine and not anyone else's.
I would love to see some imporvements to this code, so if you have any suggestions then let me know in the comments section and if someone can actually make it better than it would be great.
I'll share the logic for BUY and Sell upon agrreing on mutual terms.
As of this moment, the code simply plots Renko Bars, based on Daily Open.
I have added Daily close as an option in this, just in case someone wants it.
similarly you can call upon High and Low (for Obvious Reasons)
It CAN NOT REPAINT at all!!!!
[astropark] Renko RSI divergencesDear Followers,
today a new great Scalper Tool , which works excellent from 1 minute timeframe Renko chart , which is the best and more secure timeframe to use on a Renko chart. But of course it works great on all timeframes (included the 1D timeframe)!
This tool has some cool features:
it works on all timeframes , starting from 1 minute: so you can enjoy high-frequency trading by using a 24/7 running bot and a proper money and risk management strategy;
it shows you both bullish and bearish divergences with a triangle up or down respectively
when it finds a strong bullish/bearish divergence , a flag will be displayed instead of a triangle
This script will let you set all notifications you may need in order to be alerted on each triggered divergence.
You may like to use it together with my Renko Scalper V2
On Bitmex/ByBit/Binance Bitcoin/USD chart best settings is Traditional Renko chart with 10$ box size, while 0.5$ box size is suggested on Ethereum/USD pair.
This is a premium indicator , so send me a private message in order to get access to this script.

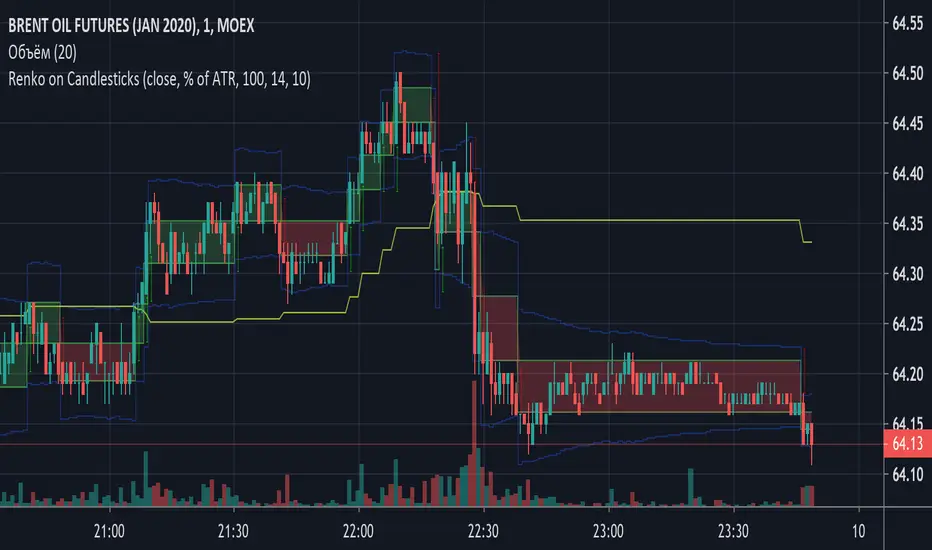
Renko on CandlesticksThis script drowse renkoboxes on top of candlesticks. This script does not repaint and can be used for alerts generation. If you add Renko to the same chart using security function it won't be the same (which seems to be a bug in TV). To check if my implementation is correct you can open Renko in a separate window and check timestamps.
Unlike standard implementation, when you use ATR based Renko bars, every box can have different size! The current ATR is applied after every bar. The standard implementation takes the current ATR value and applies it to the whole chart, so the chart may look totally different when you reload the page.
G-SIRPG-SIRP Has been Developed with One Idea in Mind... Automated Trading.
Just set it up and walk away.
It makes use of the noise cancelling power of our Re engineered Renko Candles on Traditional Settings.
Using Normal Code on Normal Renko will NOT work as the Candles will repaint thereby causing a Skewed backtest result.
This is Why G-SIRP is one of a kind as we have managed to find a solution to a Problem using Pine that is not currently available in any documentation on Pine.
We have incorporated Alot of Logic into the script to allow you to ride a trend successfully that includes a Trailing Stop Loss So that you are making sure that profit is being locked in.