Volume Oscillators Focus IndicatorVolume Oscillators Focus Indicator
Short name VolumeFocus
This indicator seeks to show episodes of high and low volumes analyzing these by calculating three lines and create colorings on the basis of where these lines go relative to each other.
The first line is a percent based on the current volume level, for which a 3 period sma is taken.
It is calculated by using the lowest volume in the lookback as zero, the highest as 100 percent
This line is called “current volume level”
The second line is a percent, based on the median volume of the last five periods. This line is called “new normal volume”
The third line is a percent, based on the median volume of the lookback period. This is called “old normal volume”
For the second and third line the lowest “new normal volume” in the lookback is used as zero while the 100 percent level is the same as in the calculation of the first line.
The reasoning for the colors is as follows:
When both current en new normal level are below old normal, the volume is to be considered ‘low’. When volume is low, the background color is gray and the fill color between the old normal and current lines is navy.
When both current and new normal level are above old normal, the volume is to be considered ‘significantly expanded’. When this happens the fill color between current and old normal is orange.
When volume is not low it is considered normal or high and the background color is green.
The lookback is set to 50, it advise to keep it that way.
Use of the indicator.
Volume results from focus of the market on the instrument. When the price seems correct, some buy it, some sell it but most don’t care. Then the volume is low, the background is gray. The navy fill color indicates ‘how low’.
When the price seems off, many will care and start trading. Then volume is high, background is green. When the trading is really heating up the orange fill color appears, showing that the market has high focus on this instrument, perhaps move in a trend.
Of course we don’t know in which way the market tries to ‘correct’ the price, for that purpose I use this indicator together with REVE Cohorts which provide useful markers to explain what the excess volume means.
Eykpunter
Relativevolume

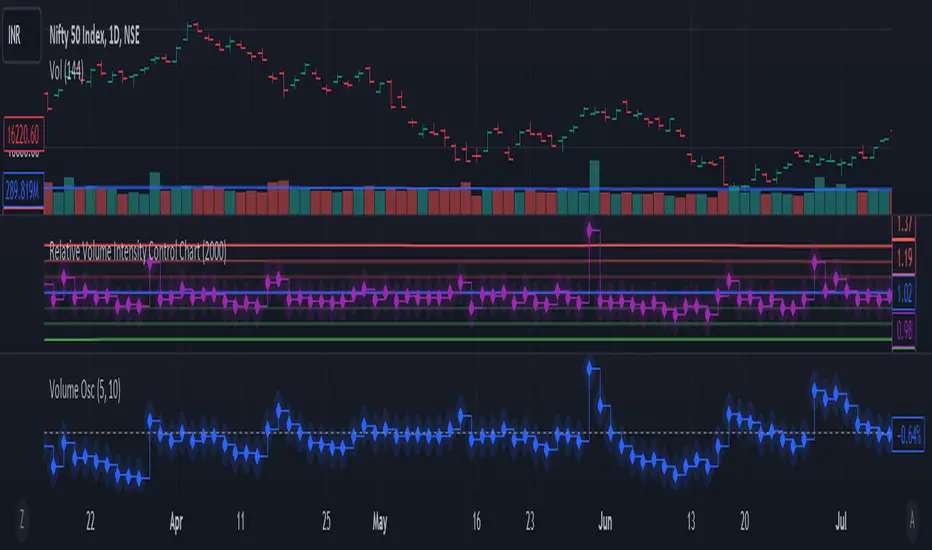
Relative Volume Intensity Control Chart***NOTE THE VOLUME OSCILATOR PROVIDED AT THE BOTTOM IS FOR COMPARSION AND IS NOT PART OF THE INDICATOR****
This indicator provides a comprehensive and a nuanced representation of volume relative to historical volume. The indicator aims to provide insights into the relative intensity of trading volume compared to historical data. It calculates two types of relative volume intensity: mean volume intensity and point volume intensity. The final indicator, "Relative_volume_intensity," is a combination of these two.
1. Point Volume Intensity:
Calculate the ratio of the current volume to the corresponding SMA from the previous period for each of the periods.
Normalize each ratio by dividing it by the corresponding normalized SMA.
Assign weights to each normalized ratio and calculate the point volume intensity.
Point volume intensity calculates the intensity of the current trading volume at a specific point in time relative to its historical moving average. It assesses how much the current volume deviates from the previous historical average for different lookback periods(current volume/ average volume of previous n days). The calculation involves dividing the current volume by the corresponding previous historical moving average and normalizing the result. The purpose of point volume intensity is to capture the immediate impact of the current volume on the overall intensity, providing a more dynamic and responsive measure.
2. Mean Volume Intensity:
Calculate the simple moving averages (SMA) of the volume for different periods (5, 8, 13, 21, 34, 55, 89, 144).
Normalize each SMA by dividing it by the SMA with the longest lookback (144).
Assign weights to each normalized SMA and calculate the mean volume intensity.
Mean volume intensity, on the other hand, takes a broader approach by looking at the mean (average) of various historical moving averages of volume. Instead of focusing on the current volume alone, it considers the historical average intensity over multiple periods. The purpose of mean volume intensity is to provide a smoother and more stable representation of the overall historical volume intensity. It helps filter out short-term fluctuations and provides a more comprehensive view of how the current volume compares to historical norms.
Purpose of Both:
Both point volume intensity and mean volume intensity contribute to the calculation of the final indicator, "Relative_volume_intensity." The idea is to combine these two perspectives to create a more comprehensive measure of relative volume intensity. By assigning equal weights to both components and taking a balanced approach, the indicator aims to capture both short-term spikes in volume and trends in volume intensity over a relatively extended periods.
In calculation of both point volume intensity and mean volume intensity, shorter-term moving averages (e.g., 5, 8) have higher weights, suggesting a greater emphasis on recent volume behavior.
Visualization:
The script then calculates the mean and standard deviation of the relative volume intensity over a specified lookback length.
Plot lines for the centerline (mean), upper and lower 3 standard deviations, upper and lower 2 standard deviations, and upper and lower 1 standard deviation.
Plot the relative volume intensity as a step line with diamond markers.
It is displayed like a control chart where we can see how the relative intensity is behaving when compared to longer historical lookback period.
ka66: Normalised/Relative VolumeThis is an idea taken from a John Bollinger (of Bollinger Bands fame) talk. Instead of showing volume with a moving average overlay, we show volume relative to its moving average:
avgVolume = sma(volume, 10) // several configurable MAs allowed
relativeVolume = volume / avgVolume
Now if we get a value of 1, that means the current volume is the same as its historical average. Under 0, less than average, and above zero, greater than its average.
If we get a value like 2, then current volume is twice its average. I hope the implication of this being displayed visually is becoming clearer.
We plot this relative volume as columns.
We then plot horizontal levels, like 1, 2, 3 to see the magnitude of the current volume relative to its average.
Consecutive rising or falling relative volume is shown in the same colour.
I am still exploring volume as trading data point, but we see some ideas from this visual representation:
How do volume patterns change across timeframes? Do we get better signals or higher or lower time frames (e.g. big relative volume spikes)
Can consecutive rises or falls indicate a big potential move, even though price is just fluctuating.
What about a switch from rise to fall.
If we get pinbars/spikes with a big relative volume spike, can we then infer more clearly whether buyers or sellers are in control.
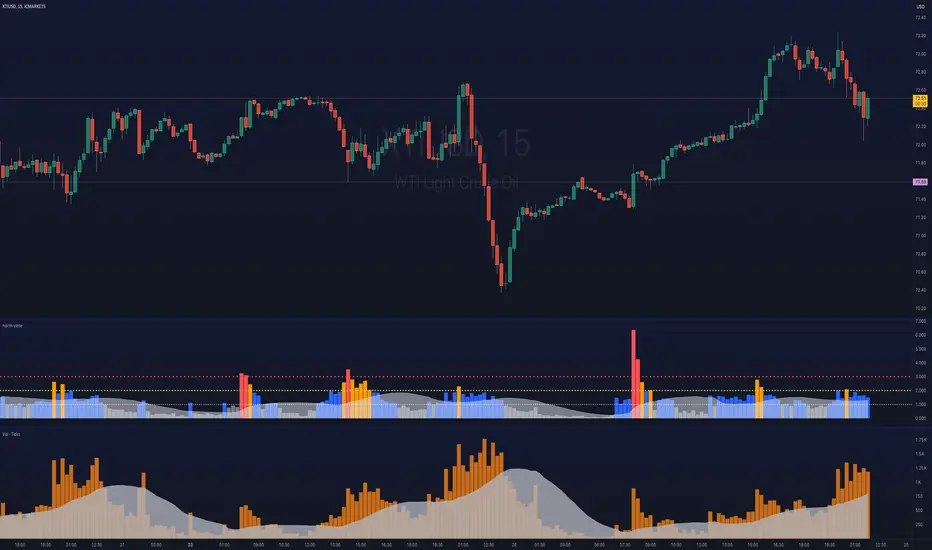
Intraday Volume Rating [Honestcowboy]The Intraday Volume Rating aims to provide a clearer picture of what volume is telling you on intraday charts.
What is different to other forms of volume analysis
While Volume averages and other measures of volume base their calculations on the previous bars on the chart (for example bars 1954 to 1968). The average volume in this indicator measures expected volume during that time of the day.
🔷 Why would you take this approach?
Markets behave different during certain times of the day, also called sessions.
Here are a couple examples.
Asian Session (generally low volatility)
London Session (bigger volatility starts)
New York Session (overlap of New York with London creates huge volatility)
Generally when using other types of volume averaging it does not take into account these sessions and that the market has a pattern for volume in an intraday chart.
🔷 CALCULATION
Think of this script like an average of volume but instead it uses past days data instead of previous bars data.
This is a chart explaining the indicator this script is based on The same principle applies but instead we measure volume at each bar of the day.
The script also counts the number of bars that exist in a day on your current timeframe chart. After knowing that number it creates the matrix used in it's calculations and data storage.
See how it works perfectly on a lower timeframe chart below:
Getting this right was the hardest part, check the coding if you are interested in this type of stuff. I commented every step in the coding process.
Every setting of the script is commented so no need for further explanation, enjoy!

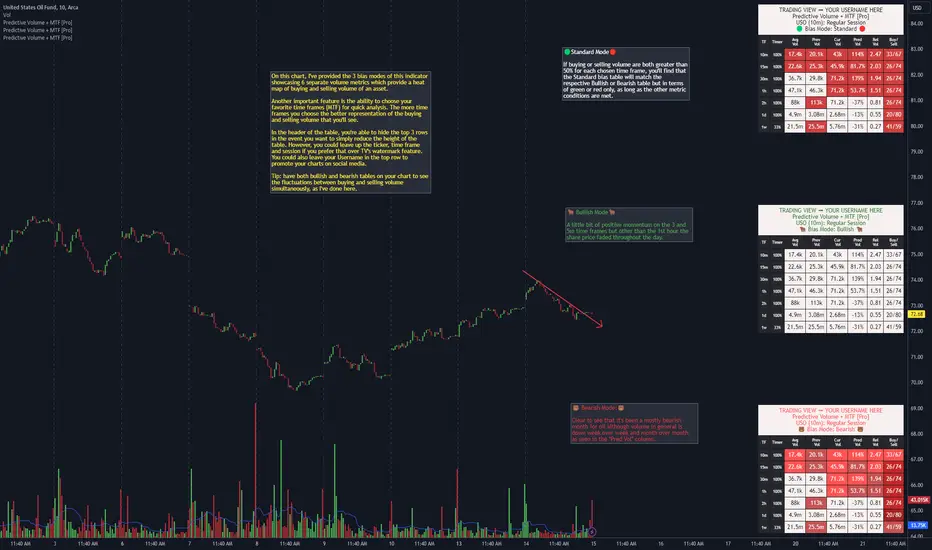
Predictive Volume + MTF [Pro]"Predictive Volume + MTF " is a predictor of near-future volume available on 13 of your favorite time frames. The script calculates the volume's % change (PredVol) between Current Volume vs. Previous Volume by predicting whether PredVol will be higher or lower at the end of the current bar using an "elapsed time" vs "volume so far" concept. This gives the benefit of the most up-to-date information without artificial low/high comparisons when a bar has just formed. For example, it would be common to see -100% in a lot of instances when a new bar is just forming which would be normal because volume at the start of a new candle will generally be lower than where it was when the last bar closed. Where this indicator shines is during this old to new bar formation relative to the volume that's carried over to the new bar. As a result, it will now be common to see PredVol values starting much higher because the calculation is dividing up the bar and analyzing fractions of it instead of the entire bar that would otherwise lead to these incorrect volume % change calculations.
Examples of Predictive Volume % Change:
In addition, this indicator uses many other advanced and robust features:
⚡ Matrices that create the table, allowing you to add and remove rows and columns to customize the table to show only the information that's important to you
⚡ View up to 13 time frames at once - it's generally a good idea to have at least 5 time frames up to get an overall feeling of the direction/sentiment of volume with the 1d being 1 of the 5
⏩ Includes the following popular time frames: 1m, 3m, 5m, 10m, 15m, 30m, 1h, 2h, 4h, 8h, 1d, week, month
⚡ 3 "bias mode" choices that use Relative Volume (RVOL) from calculations between Current, Previous & Average Volume that provide a heat map with varying degrees of color representing buying & selling momentum of your favorite asset. Traders generally have an innate bias when it comes to their trading methodology. The script's
author created separate modes to account for this. One way to utilize the indicator is to use 2 on your chart, 1 Bullish and 1 Bearish, to see if volume sentiment is skewed towards your particular bias
⏩ 🟢 Standard Mode 🔴 - displays green and red to depict volume momentum using same RVOL calculations as Bullish & Bearish modes
⏩ 🐂 Bullish Mode 🐂 - displays 5 colors to represent the levels of intensity of the Buy/Sell/RVOL data (light blue, green, yellow, light orange, dark orange)
⏩ 🐻 Bearish Mode 🐻 - displays 5 colors to represent the levels of intensity of the Buy/Sell/RVOL data (light red to dark red)
Ex. of all 3 bias modes showing very bullish volume sentiment:
Ex. of all 3 bias modes showing very bearish volume sentiment:
⚡ 2 types of alerts: PREDEFINED and CUSTOM
💡 PREDEFINED ALERTS consist of 4 Bullish & Bearish levels with Lvl 1 designed to be less sensitive than Lvl 2 etc
⏩ Configurable for every time frame, "On Close" or "Each Bar". On Close could be a better choice on lower time frames so that you're not getting a bunch of triggers over a short duration & Each Bar could be a better option for higher time frames so that you don't miss a move mid bar for instance
⏩ Creating a PREDEFINED BULLISH/BEARISH ALERT saves a snapshot of the alert's settings. You can then change the settings and create another alert
⏩ For example, you could create one alert for any alert type (bull and/or bear), for every time frame all at once, or you can create multiple & separate alerts, giving each one a unique name with the time frame that it's for: ex. BTC - Bullish Vol Lvl1 (1m) (keep in mind that TV provides you the ticker, time frame & alert
type automatically (the script's author hard-coded the label names within the script and as a result when they do fire you're provided the type of alert, such as "Bearish Vol (Lvl 1). Technically, you don't even need to name the alert again)
In this example, you're provided information on how to create PREDEFINED ALERTS, what conditions cause the alerts to trigger and how they'll look when they do fire
💡 CUSTOM ALERTS consists of 6 metrics giving you the ability to create your own custom compound alerts
⏩ Configurable for every time frame, "On Close" or "Each Bar". On Close could be a better choice on lower time frames so that you're not getting a bunch of triggers over a short duration & Each Bar could be a better option for higher time frames so that you don't miss a move mid bar for instance
⏩ Creating a CUSTOM ALERT works the same way as PREDEFINED ALERTS (see chart below)
⏩ Check your conditions in real-time for accuracy via a debug feature aka "SHOW HELP FOR TIME FRAME"
In this example, you're provided information on how to create CUSTOM ALERTS
⚡ Header function that provides the ticker, time frame and session that you're on (can use in lieu of TV's watermark feature, or use together)
⏩ There's 2 customizable header inputs - you could include your TradingView username in one of them for the times when promoting your charts across your favorite social media sites
⚡ Timer that shows you when a bar will begin/end plus other features that allow you to change the size and positioning of the table within your charts
⚡ An input that allows you to change the "significant figures" for rounding purposes - can be especially useful when volume is low or when you're trading OTC stocks
⚡ 4 volume moving average lengths - Intraday, Daily, Weekly, Monthly - for those times when 1 moving average to cover the entire gamut of just won't suffice
////////////////////////////////
There's quite a bit more information provided in the attached charts as well as the tooltips within the inputs section of the indicator. Should you have any questions, feedback etc, please do not hesitate to contact the script's author. My hope is that this indicator becomes an invaluable resource to you and you're able to integrate it in to your everyday trading tool bag to make more informed decisions.
Market Open - Relative VolumeThe indicator calculates the Pre-market volume percentage of the current day, relative to the average volume being traded in the trading session (14 days), displayed in Table Row 1, Table Cell 1, as V%. Pre-market volume between 15% & 30% has a orange background color. Pre-market volume percentage above 30% has a green background color.
The indicator calculates the relative volume per candle relative to the average volume being traded in that time period (14 days) (e.g., "1M," "2M," up to "5M"), displayed in a table. Relative volume between 250% & 350% has a orange background color. Relative volume above 350% has a green background color.
FYI >> Indicator calculations are per candle, not time unit (due to pine script restrictions). Meaning, the indicator current table data is only accurate in the 1M chart. If you are using the indicator in a higher timeframe, e.g., on the 5M chart, then the values in table cells >> (1M value == relative volume of the first 5-minute candle) (5M value = relative volume of the first five 5-minute candles) and so on. (Future versions will have a dynamic table).

YD_Volume_Alert"YD_Volume_Alert" is a simple alert based on the increasing volume.
Although it is a simple indicator, strategies to determine accumulation and distribution can be developed using this indicator, which will also be published as well.
📌 Usage, Details and Alert
Using this indicator is simple.
You can enter two scales, "Increased Percentage 1 (%)" and "Increased Percentage 2 (%)", with default values set to 200% and 500%.
Signals are displayed in green and red triangles at the bottom of the bar, also printed with the text "Increased Volume" and "Hugely increased Volume".
Alerts are provided as a combination of the chart's symbol and the set percentage. For example,
"BINANCE:BTCUSDT.P 's Volume : 200% increased."
===========================================================
"YD_Volume_Alert" 는 거래량 증가에 따른 얼러트를 제공하는 간단한 지표입니다.
간단한 지표이지만 위 지표를 이용하여 매집과 매도의 타이밍으로 이용하는 전략 또한 개발할 수 있으며, 이 역시도 퍼블리시 할 예정입니다.
📌 사용 예시와 알림 설정
지표를 사용하는 방법은 간단합니다.
"Increased Percentage 1 (%)" 과 "Increased Percentage 2 (%)" 두 가지의 배율을 입력할 수 있으며, 기본값은 200%와 500%로 설정되어 있습니다.
시그널은 바 하단에 초록색, 빨간색 삼각형으로 각각 표시되며, "Increased Volume"과 "Hugely increased Volume"이라는 텍스트가 함께 출력됩니다.
얼러트는 자신이 설정한 차트의 심볼과 설정한 퍼센티지의 조합으로 제공되며 예를 들면 다음과 같습니다.
"BINANCE:BTCUSDT.P 's Volume : 200% increased."

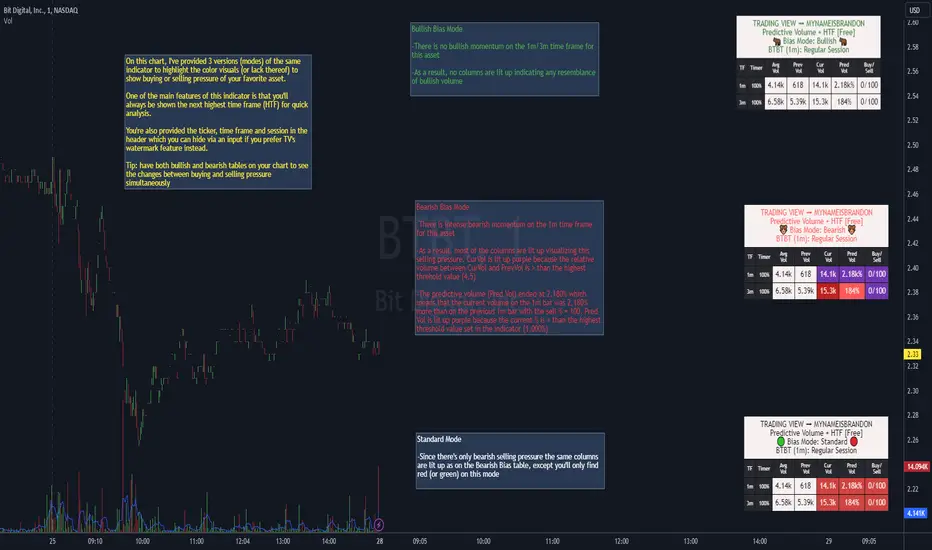
*Predictive Volume + HTF [Free]*"Predictive Volume + HTF " is a predictor of real-time to near-future volume % change on the current chart and the next highest time frame. The script calculates the volume's % change (Pred Vol) between Current Volume vs. Previous Volume by predicting whether Pred Vol will be higher or lower at the end of the current bar using an "elapsed time" vs "volume so far" concept. This gives the benefit of the most up-to-date information without artificial low/high comparisons when a bar has just formed. For example, it would be common to see -100% in a lot of instances when a new bar is just forming which would be normal because volume at the start of a new candle will generally be lower than where it was when the last bar closed. Where this indicator shines is during this old to new bar formation and the volume that's carried over to the new bar. As a result, it will now be common to see Pred Vol values starting much higher because the calculation is dividing up the bar and analyzing fractions of it instead of the entire bar that would otherwise lead to these incorrect volume % change calculations.
A few examples of Predictive Volume % Change:
In addition, this indicator uses many advanced and dynamic features:
⚡ Matrices that create the table, allowing you to add and remove columns to customize the table to show only the information that's important to you
⚡ View 2 time frames at once - meaning every time you switch time frames, the table will auto-adjust to show the next highest time frame, or "HTF"
⚡ Header function that keeps you aware of the ticker, time frame and session that you're on at all times (can use in lieu of TV's watermark feature, or use together)
⚡ Timer that shows you when a bar will begin/end
⚡ Includes the following popular time frames: 1m, 3m, 5m, 10m, 15m, 30m, 1h, 2h, 4h, 8h, 1d, week, month
⚡ 3 "bias mode" choices that use Relative Volume (RVOL) from calculations between Current, Previous & Average Volume that provide a visual with varying degrees of color representing buying & selling momentum of your favorite asset. Traders generally have an innate bias when it comes to their trading methodology. Of course it can change quickly depending on current market structure. The script's author created separate modes to account for these biases. One way to utilize the indicator is to use 2 on your chart with 1 Bullish bias \"middle right\" and another Bearish bias \"lower right\" to see if volume pressure is skewed towards your particular bias by showing how many colored boxes there are on each table.
⏩ Standard - 🟢🔴 - displays green and red to depict volume momentum using same RVOL calculations as Bullish & Bearish modes
⏩ Bullish - 🐂🐂 - displays 5 colors to represent the levels of intensity of the Buy/Sell/RVOL data (light blue, green, yellow, light orange, dark orange)
⏩ Bearish - 🐻🐻 - displays 5 colors to represent the levels of intensity of the Buy/Sell/RVOL data (light red to dark purple)
Ex. of all 3 bias modes during a burst of bullish volume momentum:
Ex. of all 3 bias modes during a burst of bearish volume momentum:
⚡ 2 alert types: 1 bullish & 1 bearish with 2 levels for each
⏩ The PREDEFINED ALERTS consist of 2 Bullish & Bearish levels with Lvl 1 designed to be less sensitive than Lvl 2
⏩ Configurable for every time frame, "On Close" or "Each Bar". On Close could be a better choice on lower time frames so that you're not getting a bunch of triggers over a short duration & Each Bar could be a better option for higher time frames so that you don't miss a move mid bar for instance
⏩ Creating a PREDEFINED BULLISH/BEARISH ALERT saves a snapshot of the alert's settings. You can then change the settings and create another alert. In this way, you can create multiple unique alerts
⏩ Create one alert for any alert type (bull and/or bear), for every time frame all at once, or you can create multiple & separate alerts, giving each one a unique name with the time frame that it's for: ex. BTC - Bullish Vol Lvl1 (1m)
In this example, you'll see what causes the alerts to trigger as well as how to create them and how they'll look when they do fire.
////////////////////////////////
It is with a sense of gratitude, appreciation and indebtedness to the coder of this script ©SimpleCryptoLife that I'm able to present this indicator to you after months of hard work. We hope that you find it invaluable during your own trading journey! Should you have any questions, feedback or critiques please do not hesitate to leave a comment.
Strategy - Relative Volume GainersStrategy - Relative Volume Gainers
Overview:
This trading strategy, called "Relative Volume Gainers," is designed for Long Entry opportunities in the stock market. The strategy aims to identify potential trading candidates based on specific technical conditions, including volume, price movements, and indicator alignments.
Strategy Rules:
The strategy is focused solely on Long Entry positions.
The volume for the current trading day must be greater than or equal to the volume of the previous day.
The percentage change in price must be greater than or equal to 2.5%.
The Last Traded Price (LTP) must be greater than or equal to the Exponential Moving Average (EMA) 200.
The Relative Volume for the current trading day (calculated over the last 30 days) must be greater than or equal to the Simple Moving Average (SMA) of Relative Volume over the same 30 days.
The current candle on the chart should be Green or Bullish, indicating positive price movement.
The price difference between bid and ask prices should be kept to a minimum.
It's recommended to also analyze market depth for better insights.
Strategy Requirements:
Add the Exponential Moving Average (EMA) 200 to your trading chart.
This strategy can be applied on charts of any timeframe.
For intraday trading, particularly for early entry, consider using a 1-minute timeframe.
It is advisable to create a screener to identify potential trades in real-time market conditions.
Risk Warning:
Stocks that meet the strategy criteria might exhibit high volatility and a high beta, making them inherently risky to trade. Exercise caution and adhere to predetermined risk management strategies.
Determine your trading quantity based on your entry price and stop loss in order to manage risk effectively.
Quantity Calculation Formula:
Quantity calculation is crucial to manage risk and position sizing. The following formulas can be used based on your trading scenario:
Quantity with Leverage:
Quantity = (((Using Capital / 100) * Risk Percent) / (Entry Price - Stop Loss)) * Leverage
Eg: Quantity = (((10000 / 100) * 0.2) / (405.5 - 398.5)) * 5
Quantity = 14
Risk = Rs.100 (Rs.100 is 1% of Rs.10000. So the risk is 1%, means we lose only Rs.100 when the SL is hit. If SL is increased the Quantity will get reduced to maintain a fixed risk of Rs.100)
Quantity without Leverage:
Quantity = (((Using Capital / 100) * Risk Percent) / (Entry Price - Stop Loss))
Note:
Always stay informed about market conditions and be prepared for potential rapid price movements when trading stocks that meet the strategy criteria. Strictly adhere to your predefined risk management strategy to safeguard your capital.

Volume Bars - Leviathan x Tradingriot This script is a collaboration with Tradingriot. It improves the regular volume indicator by coloring the bars based on different criteria to provide additional insights into market activity.
Coloring conditions are calculated using a combination of relative volume (current trading volume relative to past trading volume) and price movements (candle high-low range):
1. **High Volume**: This is represented by bars that exceed a user-defined relative volume (RVOL) or are the highest volume over a certain lookback period. They often signal a start or the end of a price move.
2. **Low Volume**: These are bars where volume is lower than a certain RVOL or is the lowest volume over a certain lookback period. Low Volume bars often act as weak spots that later get filled.
3. **Churn Bars**: Churn bars represent periods where there is a lot of volume, but little price movement. They often signal a start or the end of a price move.

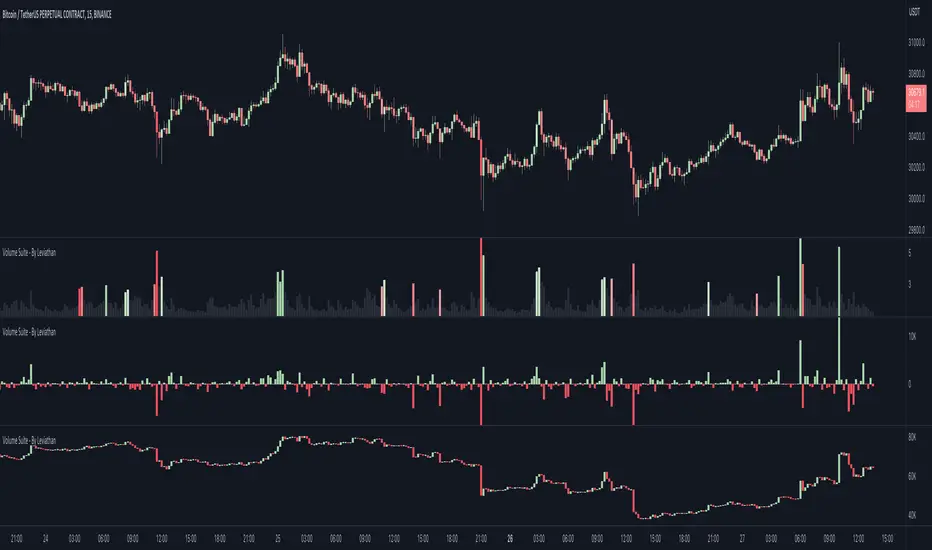
Volume Suite - By Leviathan (CVD, Volume Delta, Relative Volume)Volume Suite is an all-in-one script that includes several volume-based indicators such as CVD, Volume Delta, Relative Volume, Buy/Sell Volume, Cumulative Relative Volume and more. Additionally, it offers fully customisable appearance and features for improved data visualization, such as highlights for high volume activity, small price changes with high volume, or large price changes with low volume and more.
Data available in version 1:
- Volume Delta
Volume Delta is the net difference between Buy Volume and Sell Volume at a given bar. Positive Delta indicates that Buy Volume > Sell Volume, while Negative Delta means that Sell Volume > Buy Volume. As there is not way to get tick data on Tradingview, calculating Volume Delta is improvised by using the direction of lower timeframe candles and their volume.
- Cumulative Volume Delta (CVD)
CVD is a running total/cumulation of Volume Delta values, where positive VD gets added to the sum and negative VD gets subtracted from the sum. It can be used for trend strength analysis, divergence strategies, sentiment, etc.
- Buy/Sell Volume
Buy and Sell Volume provides an insight into volume activity in a given bar by estimating the buying/selling volume based on the direction of lower timeframe candles and their volume.
- Relative Volume
Relative Volume is used to compare current trading volume to past trading volume over a given period. For instance, a relative volume of 1.0 indicates that volume is at an average level, while a relative volume of 2.0 suggests that the volume is twice as high as the average.
- Cumulative Relative Volume (CRVOL)
CRVOL is a running total/cumulation of Relative Volume values, where RVOL at close>open gets added to the sum and RVOL at close
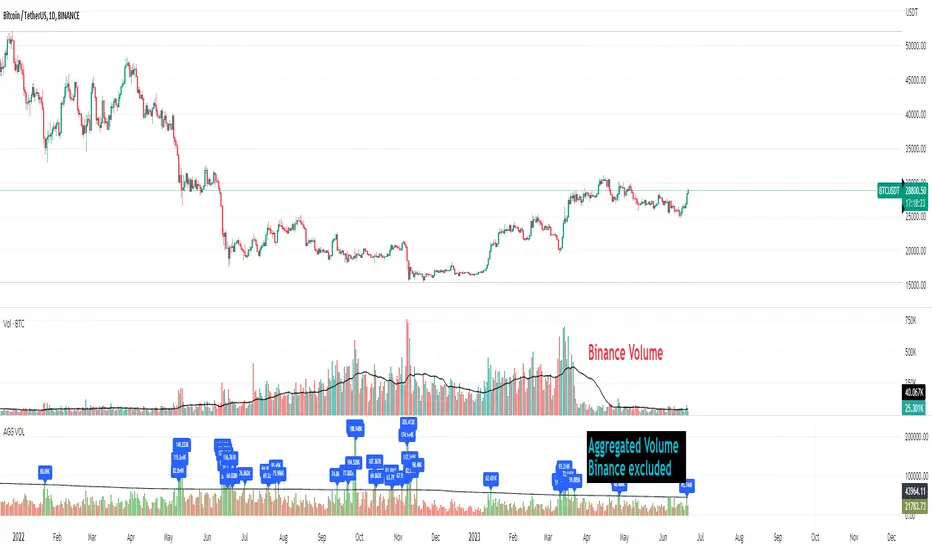
Crypto Aggregated Volume «NoaTrader»If you use volume in your crypto analysis, you may have encountered the situation which an exchange's policy change can affect your judgement falsely. For example, you can see the huge difference of volume on the given chart since binance transferred its fee discount from USDT to TUSD pair.
This script sums up volume of all major centralized exchanges ( according to coinmarketcap ) on the symbol you are visiting and has an option to exclude Binance's volume which can give you a more stable understanding for judgement when needed (and you can see the difference on the chart).
The colors also give a good vision about the relative volume in the area which can show the interest of market in trading.
The script only aggregates the same symbol on different exchanges and does not get the volume from other pairs.
Included CEXs are:
binance
bitstamp
coinbase
huobi
kraken
bitfinex
bybit
okx
kucoin
bithumb
Relative VolumeHello traders,
"There's nothing new on Wall Street" is an age-old saying that still shows its relevance in modern day financial markets; volume still serves as a valuable tool for any trader just as it did for those that came and succeeded before us; in order to succeed in modern day markets one has to take it up a notch and dabble in complicated topics, like math. Now I dunno about you reader but I’m not keen on sitting around all day just to watch numbers on a screen; it’s pretty important to add some color into your life before it becomes dull but how can someone add colors into their trading toolkit as an aid rather than bother? With a bit of help from 3 other amazing open-source indicators you too can become a statistics enjoyer by combining math and colors to make pattern recognition much more intuitive and offering more peace of mind when trading. “Sir but how?”, glad you didn’t ask, it helps with simplifying statistics, in this case a Gaussian bellcurve
“HUH?”, you say? Alright class, Gaussian bellcurves for math dislikers 101 is in session
- Imagine that we have a bunch of numbers that we want to graph. We could just draw a line and plot the numbers on it, but that might not be very interesting.
- Instead, we can use the shape of a bell to show how many of each number we have.
- Let's say we have a lot of people and we want to graph how tall they are. We would start by making a line from the shortest person to the tallest person, and then we would draw the bell shape around the line.
- The bell shape is called a "Gaussian Bell Curve," and it shows us how many people are a certain height.
- In the middle of the bell, where it's the widest, we have the most people who are about average height. As we move to the sides of the bell, the curve gets lower because there are fewer people who are really tall or really short.
The bell curve discussed is the main idea for the candle coloring component of this indicator as being able to analyze the distribution of an entire dataset, in this case volume, can alert us when volume/participation in the market is away from its average using color, and therefore an opportunity could be present. Fair warning, it’s important to not strictly focus on volume as volume is meant to be confluence to the current structure of the market rather than causing tunnel vision.
Why 3 indicators to combine?
It starts with the RVOL by Mik3Christ3ns3n indicator as the backbone by calculating the average volume over a specified period of time, and then compares each new volume value to this average to determine whether it is above or below the average. The indicator then normalizes the volume data and calculates the z-score/standard deviation to determine whether the volume is within normal range or is an anomaly beyond a specified threshold which can also be set into an alert to aid in eyeing possible opportunities.
The code also includes Candle Coloring by Morty as it calculates a function to get the z-score for the size of the candle's body, and then compares it to the z-score for volume to determine whether the body size is a factor in the price action.
Finally, the code plots the anomalies and the normalized volume data on the chart using the first RVOL indicator mentioned, and colors the bars of the chart based on whether they are within normal range or are anomalies which comes from using code from veryfid's relative volume indicator.
Overall, this custom technical indicator is best used to identify unusual changes in trading volume, which may indicate potential price movements in the underlying.
How about some examples?
This first example is for my scalpers wanting to get in and out but not having much of an idea where or let alone how; using a tool like VWAP can be great for determining the area value to execute mean reversion trades once a speculator spots a colored candle anomaly at standard deviation band. Works best when VWAP is flat as it signals lack of conviction from both bulls and bears
This second example is for my fire and forget intraweek swing traders who want to execute a higher timeframe trend-following bias. A speculator starting 2023 off notices that the negative sentiment around Binance from late last year has quieted down and has conviction in upside after BTC began an uptrend as monthly VWAP (right chart) has began sloping up as well as a rally with momentum shown with the blue colored candle so the trader waits wait for a pullback for entry. On the chart to the left of the 4H the speculator notices a pullback into the area of interest to do business so a limit bid is left to enter for continued upside in Bitcoin through January 2023 just by keeping things simple
That’s really the main purpose of this indicator: simplicity of statistics for confluence using volume
Volume precedes price and price moves only for narrative to follow- why wait for your subjective Twitter timeline to give you a biased narrative to trade when you can use objective analysis by combining statistics and colors to allow for a cleaner execution process
“But what about risk management?” Glad you didn’t ask reader!
One last example then, we meet our trend following trader again feeling euphoric so they know profit taking season is coming soon but wants to leave emotion out of it. How to go about it? Same idea as our last trend following example: we see on the 4h chart to the right side shows Bitcoin lose and trade back within the 2nd standard deviation of quarterly VWAP which is telling our speculator that the uptrend has broken on top of which notices on the 30 minute chart on the left that aggressive market buyers have been steadily absorbed by limit sellers on multiple occasions of retesting 30,500 shown with the green colored candles and volume bars below, time to sell.
Turns out that selling was proactive risk management because price dumped thereafter
Hope this explanation gave you some useful insights on using statistics as colors from cherrypicked examples, remember that just because my examples are cherrypicked doesn’t invalidate these concepts at all as the market only does two things, initiate aggressive auctions and respond passively to auctions. This tool makes for seeing where that initiative aggressive activity is happening much simpler to deduce if others will respond to an anomaly of initiative aggressive activity or if the aggression will continue.
If there’s just one thing you take from this- simplicity above all, cheers and good luck

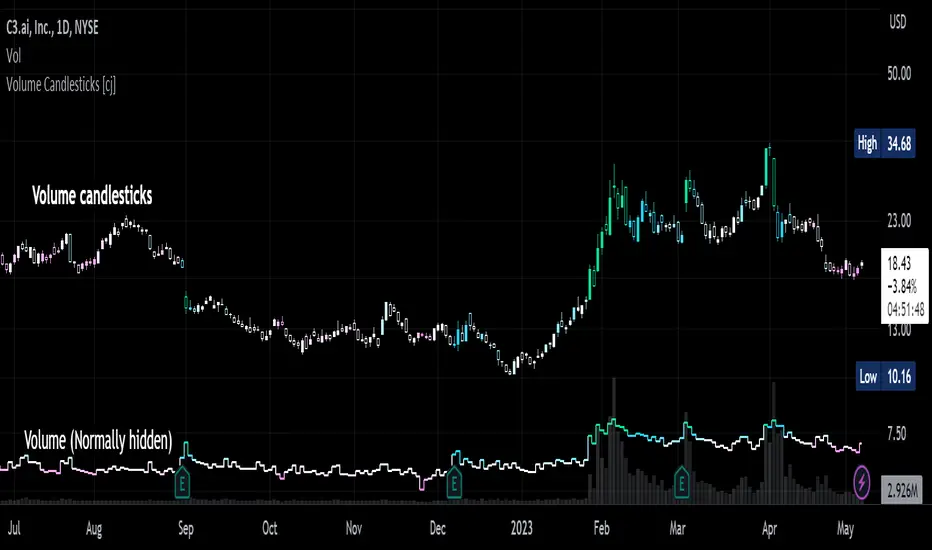
Volume Candlesticks [cajole]
This script lets you create the equivalent of "volume candlesticks" in TradingView.
"Volume candlesticks" normally vary their width according to the bar's volume. This script varies COLOUR instead of WIDTH.
Bar charts are also supported.
Candles/Bars are coloured by their distance from the average volume. You can also add a "huge volume" colour to further highlight the most extremely-high volume bars.
Note that volume is extrapolated for incomplete bars by default. So, if the average volume of the past 10 days is 5M shares, and 5M shares trade in the first 10% of today's session, that bar will be coloured as though 50M shares have traded. Set the "Extrapolate" option to 1.0 to disable this.
For this script to work properly, you should set TradingView's default candle/bar colours to be at least 20% transparent. By default, TradingView tends to overlay its own bars on top of indicators.
Nerdy details:
The script works best on a dark background, because it is easier to change the hue of white bars than of black bars. If you find a set of colours that work for white backgrounds, please comment with them!
The geometric mean is used instead of the arithmetic mean, to keep the 'average' from being strongly influenced by spikes. Bars are
then coloured by assuming a normal probability distribution and highlighting outliers. (This means that the first high-volume bars are coloured differently to later ones.)
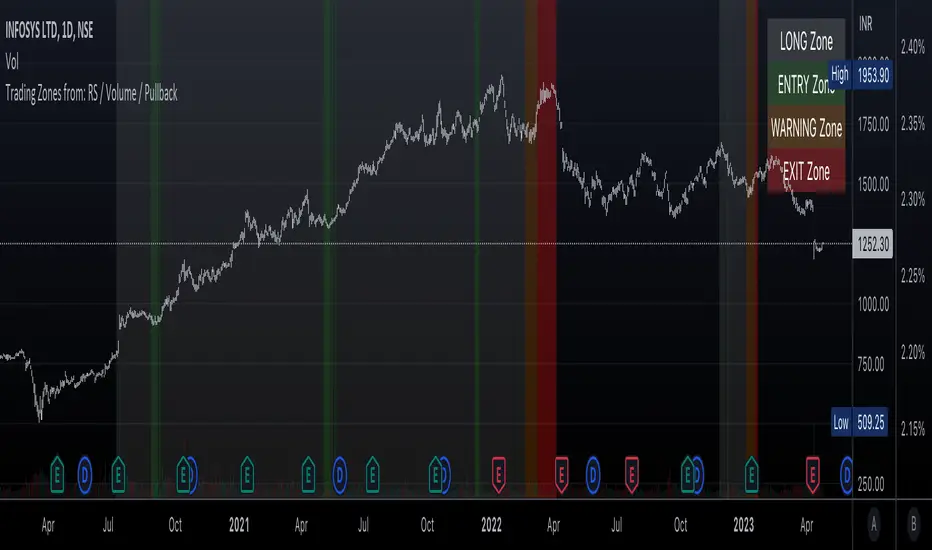
Trading Zones based on RS / Volume / PullbackThis is an Indicator which identifies different Trading Zones on the chart.
This should be Primarily used for Long Trades.
Trading Zones: and the Reasoning behind them
Long Zone -> One can do a Potential Entry (Buy) when this Zone is identified, but one could also wait for 'Entry Zone' (explained next) for a better Risk/Reward Trade.
Long Zones are identified with the help of Relative Strength and by an Intermediate Top in price.
Entry Zone -> This can be a better Risk/Reward zone to enter positions within the Long Zone.
Entry Zone is identified by a Pullback in Price & Volume contraction after the Long Zone is activated
Warning Zone -> One needs to be careful in this zone, no need to panic, Script will now try to find an Exit when Price Retraces towards Highs.
Warning Zone identifies weakness in the Price using Relative Strength of the current Stock (w.r.t. the Reference Symbol configured) and the severity of Pullback in Price.
Exit Zone -> are found only after transitioning to Warning Zone, this is a Zone which helps in minimising losses after a trade has gone into losses. Exit Zone is identified by making sure a local peak forms in Warning Zone. However, there are instances when Exit Zone detection can get prolonged when a local price peak is not formed soon enough. So one needs to be careful and use other strategies for exit.
------------------------------------------------------------------------------------
What is different in this Script:
The Script uses Relative Strength in combination with Pullback in Price from Highs in a Novel way.
Over-trading is avoided by ignoring Sideways price movements, using Relative Strength.
Only Trending Upward movement is detected and traded.
How to use this Indicator:
Use these 'Trading Zones' only as a reference so it can minimise your time in screening stocks.
Preferred Settings for using the Indicator:
Stick to 1-Day candles
Keep Relative Symbol as "Nifty" for Indian Stocks.
For US stocks, we can use "SPX" as the Relative Symbol.
//----------------
FEW EXAMPLES:
//----------------
ASIANPAINT
TATAMOTORS
TITAN
ITC
DIVISLAB
MARUTI
---------------------------------------------
Feedback is welcome.
[TTI] Zanger Volume Ratio - Intraday––––HISTORY & CREDITS 🏦
The Zanger Volume Ratio - Intraday indicator is inspired by the work of Dan Zanger, a renowned trader and creator of the Zanger Volume Ratio tool. This specific adaptation of the ratio is designed for the TradingView platform and focuses on intraday trading. Dan Zanger used this same method of reading the chart to establish a world record in turning HKEX:10 ,775 into HKEX:18 ,000,000 in under 2 years.
––––WHAT IT DOES 💡
The Zanger Volume Ratio - Intraday indicator measures the estimated end-of-day volume percentage based on intraday (depending on the timeframe of your chart) comparisons for the last X days (input in the settings). It provides insights into the stock's trading volume in real-time throughout the trading day, giving traders an idea of the stock's relative volume compared to its recent trading history. For instance if you add it to a 5min chart the ratio represents the estimated end of day volume percent based on the last 3 days, the indicator will compare the cumulative volume of the current day to the X days back cumulative average up to that same point in time and tell you how it is around the thresholds.
The indicator categorizes the volume into five levels: Extreme, High, Average, Light, and Dry Up, each represented by different colors on the chart. It also displays a pace indicator, which shows whether the volume is increasing or decreasing during the trading session.
There is also a label that shows the current reading and its pace. The pace is the indication wether the volume ratio pace is increasing and picking up or it is slowing down.
Thesholds
👉EXTREME (red): >200, means "Volume is 200% of average daily volume
👉HIGH (magenta): 110
👉AVERAGE (peach): 85
👉LIGHT (orange): 60
👉DRY (gray): <60
––––HOW TO USE IT 🔧
To use the Zanger Volume Ratio - Intraday indicator effectively, follow these steps:
1️⃣ Apply the indicator to your TradingView chart with an intraday timeframe (>=1min and less than 1 day).
2️⃣Observe the real-time volume levels and their corresponding categories (Extreme, High, Average, Light, and Dry Up) to understand the current volume dynamics.
3️⃣Keep an eye on the pace indicator (arrows) to see if the volume is increasing or decreasing during the session.
4️⃣Use the information provided by the indicator to confirm trade setups, identify potential breakouts, or detect possible reversals. For example, a stock breaking out of a key area with high or extreme volume and an increasing pace arrow may indicate a strong upward move. Conversely, a stock pulling back on light or dry up volume could signal a continuation of the trend once the volume picks up again.
Remember to combine the Zanger Volume Ratio - Intraday indicator with other technical analysis tools and your own trading strategy to make informed decisions.

RBX - Enhanced VolumeThe Enhanced Volume indicator is a powerful tool designed to help traders identify trends and patterns in market volume. This indicator combines multiple components to provide traders with a comprehensive view of volume trends in a particular market.
The Volume Oscillator component of this indicator calculates the difference between two volume moving averages and presents the result as a percentage. The two moving averages used are user-defined, allowing traders to customize the indicator to fit their preferred trading style. The oscillator's value is used to determine whether volume is heating up (red) or cooling down (green). It is recommended to have an evidence-based knowledge on price-volume relationship to make this indicator more useful.
The Relative Volume component of this indicator measures volume trends relative to previous periods. Traders can set the length of the period for which volume is compared to previous periods. This component also considers the size of the candle to determine whether it is a high bullish candle or not.
The Volume Color component of this indicator provides traders with a visual representation of volume trends. Different colors are used to represent different levels of volume, with green and red representing high buying and selling volumes, respectively. Orange is used to represent low relative volume.
The Enhanced Volume indicator also includes a table that displays average volume values, providing traders with additional insight into market trends. This indicator also includes alert conditions that can be customized to suit individual trading strategies.
Overall, the Enhanced Volume indicator is a versatile tool that can help traders make informed trading decisions by providing valuable insights into market volume trends.

RedK EVEREX - Effort Versus Results ExplorerRedK EVEREX is an experimental indicator that explores "Volume Price Analysis" basic concepts and Wyckoff law "Effort versus Result" - by inspecting the relative volume (effort) and the associated (relative) price action (result) for each bar - showing the analysis as an easy to read "stacked bands" visual. From that analysis, we calculate a "Relative Rate of Flow" - an easy to use +100/-100 oscilator that can be used to trigger a signal when a bullish or bearish mode is detected for a certain user-selected length of bars.
Basic Concepts of VPA
-------------------------------
(The topics of VPA & Wyckoff Effort vs Results law are too comprehensive to cover here - So here's just a very basic summary - please review these topics in detail in various sources available here in TradingView or on the web)
* Volume Price Analysis (VPA) is the examination of the number of shares or contracts of a security that have been traded in a given period, and the associated price movement. By analyzing trends in volume in conjunction with price movements, traders can determine the significance of changes in price and what may unfold in the near future.
* Oftentimes, high volumes of trading can infer a lot about investors’ outlook on a market or security. A significant price increase along with a significant volume increase, for example, could be a credible sign of a continued bullish trend or a bullish reversal. Adversely, a significant price decrease with a significant volume increase can point to a continued bearish trend or a bearish trend reversal.
* Incorporating volume into a trading decision can help an investor to have a more balanced view of all the broad market factors that could be influencing a security’s price, which helps an investor to make a more informed decision.
* Wyckoff's law "Effort versus results" dictates that large effort is expected to be accompanied with big results - which means that we should expect to see a big price move (result) associated with a large relative volume (effort) for a certain trading period (bar).
* The way traders use this concept in chart analysis is to mainly look for imbalances or invalidation. for example, when we observe a large relative volume that is associated with very limited price change - that should trigger an early flag/warning sign that the current price trend is facing challenges and may be an early sign of "reversal" - this applies in both bearish and bullish conditions. on the other hand, when price starts to trend in a certain direction and that's associated with increasing volume, that can act as kind of validation, or a confirmation that the market supports that move.
How does EVEREX work
---------------------------------
* EVEREX inspects each bar and calculates a relative value for volume (effort) and "strength of price movement" (result) compared to a specified lookback period. The results are then visualized as stacked bands - the lower band represents the relative volume, the upper band represents the relative price strength - with clear color coding for easier analysis.
* The scale of the band is initially set to 100 (each band can occupy up to 50) - and that can be changed in the settings to 200 or 400 - mainly to allow a "zoom in" on the bands.
* Reading the resulting stacked bands makes it easier to see "balanced" volume/price action (where both bands are either equally strong, or equally weak), or when there's imbalance between volume and price (for example, a compression bar will show with high volume band and very small/tiny price action band) - another favorite pattern in VPA is the "Ease of Move", which will show as a relatively small volume band associated with a large "price action band" (either bullish or bearish) .. and so on.
* a bit of a techie piece: why the use of a custom "Normalize()" function to calculate "relative" values in EVEREX?
When we evaluate a certain value against an average (for example, volume) we need a mechanism to deal with "super high" values that largely exceed that average - I also needed a mechanism that mimics how a trader looks at a volume bar and decides that this volume value is super low, low, average, above average, high or super high -- the issue with using a stoch() function, which is the usual technique for comparing a data point against a lookback average, is that this function will produce a "zero" for low values, and cause a large distortion of the next few "ratios" when super large values occur in the data series - i researched multiple techniques here and decided to use the custom Normalize() function - and what i found is, as long as we're applying the same formula consistently to the data series, since it's all relative to itself, we can confidently use the result. Please feel free to play around with this part further if you like - the code is commented for those who would like to research this further.
* Overall, the hope is to make the bar-by-bar analysis easier and faster for traders who apply VPA concepts in their trading
What is RROF?
--------------------------
* Once we have the values of relative volume and relative price strength, it's easy from there to combine these values into a moving index that can be used to track overall strength and detect reversals in market direction - if you think about it this a very similar concept to a volume-weighted RSI. I call that index the "Relative Rate of Flow" - or RROF (cause we're not using the direct volume and price values in the calculation, but rather relative values that we calculated with the proprietary "Normalize" function in the script.
* You can show RROF as a single or double-period - and you can customize it in terms of smoothing, and signal line - and also utilize the basic alerts to get notified when a change in strength from one side to the other (bullish vs bearish) is detected
* In the chart above, you can see how the RROF was able to detect change in market condition from Bearsh to Bullish - then from Bullish to Bearish for TSLA with good accuracy.
Other Usage Options in EVEREX
------------------------------------
* I wrote EVEREX with a lot of flexibility and utilization in mind, while focusing on a clean and easy to use visual - EVEREX should work with any time frame and any instrument - in instruments with no volume data, only price data will be used.
* You can completely hide the "EVEREX bands" and use EVEREX as a single or dual period strength indicator (by exposing the Bias/Sentiment plot which is hidden by default) -
here's how this setup would look like - in this mode, you will basically be using EVEREX the same way you're using a volume-weighted RSI
* or you can hide the bias/sentiment, and expose the Bulls & Bears plots (using the indicator's "Style" tab), and trade it like a Bull/Bear Pressure Index like this
* you can choose Moving Average type for most plot elements in EVEREX, including how to deal with the Lookback averaging
* you can set EVEREX to a different time frame than the chart
* did i mention basic alerts in this v1.0 ?? There's room to add more VPA-specific alerts in future version (for example, when Ease-of-Move or Compression bars are detected...etc) - let me know if the comments what you want to see
Final Thoughts
--------------------
* EVEREX can be used for bar-by-bar VPA analysis - There are so much literature out there about VPA and it's highly recommended that traders read more about what VPA is and how it works - as it adds an interesting (and critical) dimension to technical analysis and will improve decision making
* RROF is a "strength indicator" - it does not track price values (levels) or momentum - as you will see when you use it, the price can be moving up, while the RROF signal line starts moving down, reflecting decreasing strength (or otherwise, increasing bear strength) - So if you incorporate EVEREX in your trading you will need to use it alongside other momentum and price value indicators (like MACD, MA's, Trend Channels, Support & Resistance Lines, Fib / Donchian..etc) - to use for trade confirmation

Volume Spike Scanner█ OVERVIEW
This script adds a volume spike scanner table to the top-right of the chart space. Table cells light up with colored signals when volume spikes occur on the associated tickers on a low timeframe. The colored signals correspond to different levels of volume spike intensity and the table columns are continuously sorted so that the tickers with the most intense volume spikes are always at the top. One table can have up to 40 tickers (this is a pine script limitation) and the indicator comes with 7 pre-load ticker lists. (6 stock lists and 1 crypto list) Add the indicator several times and use all the pre-load lists to scan 280 stocks and 40 cryptocurrencies simultaneously.
By monitoring so many tickers simultaneously for volume spikes you will have early awareness of tickers that are reacting to catalysts/news. In some cases there may be no known catalyst, but the ticker is still making a significant move with high volume. Getting to these charts early in the move can provide trade-able opportunities.
█ SIGNALS
There are 6 signals for increasing levels of volume spike intensity
Orange - Most Intense
Yellow
Green
Light Green
Blue
Pink - Least Intense
█ USER INPUTS
Alerts
Check the boxes in the Alerts section next to the color signals you want alerts for. Then after closing the user inputs pane right-click on the table and select "Add Alert on ..."
Filters
Currently the only filter available is the Minimum Volume Filter. More filters may be added on future updates.
When this filter is turned on any signals that are generated by a spike that has volume below the set value will be filtered out and will not show up on the scanner.
The default value of 10,000 is recommended for stocks. There is no recommendation for crypto.
Positioning
• Compact Mode - Reduces the table width to about half size to conserve screen space.
• Table Number - Table number 1 is the farthest right position. Each increase in this value by 1 will move the table roughly one table space inward from the right side of the chart.
• Move Down - Each increment of 1 will move the table downward roughly the height of one table row.
Usually the lowest rows of the table are insignificant so it's okay to move the table down and have these rows offscreen.
• Left/Right Spacing - Each increment of 1 or -1 will move the table slightly left and right respectively. This is for fine tuning the left/right positioning if you like all your tables equally spaced.
Ticker Lists
• Pre-Built List # - The first release of this script contains seven pre-built lists each containing 40 tickers. Lists 1 thru 6 are all stocks. List 7 is all crypto.
For day trading stocks and options add the indicator 6 times to the chart, set the tables side by side, and set a different pre-built list number for each table.
• Symbol Lists - The pre-built lists can all be customized to your preference. Remove tickers you don't like and replace with ones you like. Save your lists as the new default.
Also not every table has to contain 40 tickers. You can uncheck the boxes next to the tickers to shorten the list.
█ TIPS
General
1 — Use news alert/notification services to add context to volume spikes and resulting price movements.
2 — When a ticker goes straight to the highest two signals (Orange and Yellow) that is usually noteworthy
and worth looking at the ticker's chart to see how the volume inflow is affecting price.
3 — When the lowest signals (Pink and Blue) appear for a ticker that is often not noteworthy except in the most liquid tickers
4 — It is best to use a multi-chart layout with one chart in the layout dedicated to the scanner.
This will allow you to switch tickers on the other charts without re-rendering the tables each time.
Set the chart dedicated to the scanner to the 3m timeframe or lower due to an issue mentioned lower down.
To make the scanner easier to see you can turn off visibility of all chart features on this chart.
Stocks
1 — Very liquid stocks such as AAPL, AMZN, MSFT, TSLA, NVDA, NFLX, BA, GOOGL, META, etc. rarely have volume spikes that give the highest signals (Orange and Yellow).
For these tickers the lower signals are significant. To prevent them from getting lost at the bottom of a 40 ticker table you can give them their own dedicated table
along with other favorite stocks to ensure they are always easily visible. You can set alerts for the lower level signals on this table.
2 — To use all 6 pre-loaded stock lists and scan 240 stocks simultaneously add the indicator 6 times.
Each time you add the indicator customize the user incrementing the Table Number and Pre-Load List #. This will give you 6 tables side-by-side with 40 tickers each.
3 — The Minimum Volume Filter is recommended to be set on and at the default value for the stock pre-load lists.
Crypto
1 — The Minimum Volume Filter is recommended to be set off for the crypto list.
2 — Use mobile app notifications to get 24/7 crypto volume spike alerts to your phone.
█ KNOWN ISSUES
Alerts are sometimes given more than once for the same volume spike signal.
The table does not display when using higher timeframes. It is recommended to use a split chart layout and dedicate one section of the layout to this indicator. Set the timeframe on this section to 3m or lower.
If fixes are found for the above issues they will be included in future updates.
█ SPECIAL THANKS
With permission this script utilizes some of the logic from the open-source script "Screener for 40+ instruments" by QuantNomad.

Weis V5 zigzag jayySomehow, I deleted version 5 of the zigzag script. Same name. I have added some older notes describing how the Weis Wave works.
I have also changed the date restriction that stopped the script from working after Dec 31, 2022.
What you see here is the Weis zigzag wave plotted directly on the price chart. This script is the companion to the Weis cumulative wave volume script.
What is a Weis wave? David Weis has been recognized as a Wyckoff method analyst he has written two books one of which, Trades About to Happen, describes the evolution of the now-popular Weis wave. The method employed by Weis is to identify waves of price action and to compare the strength of the waves on characteristics of wave strength. Chief among the characteristics of strength is the cumulative volume of the wave. There are other markers that Weis uses as well for example how the actual price difference between the start of the Weis wave from start to finish. Weis also uses time, particularly when using a Renko chart
David Weis did a futures io video which is a popular source of information about his method. (Search David Weis and futures.io. I strongly suggest you also read “Trades About to Happen” by David Weis.
This will get you up and running more quickly when studying charts. However, you should choose the Traditional method to be true to David Weis technique as described in his book "Trades About to Happen" and in the Futures IO Webcast featuring David Weis
. The Weis pip zigzag wave shows how far in terms of bar close price a Weis wave has traveled through the duration of a Weis wave. The Weis zigzag wave is used in combination with the Weis cumulative volume wave. The two waves should be set to the same "wave size".
To use this script, you must set the wave size: Using the traditional Weis method simply enter the desired wave size in the box "How should wave size be calculated", in this example I am using a traditional wave size of .25. Each wave for each security and each timeframe requires its own wave size. Although not the traditional method devised by David Weis a more automatic way to set wave size would be to use Average True Range (ATR). Using ATR is not the true Weis method but it does give you similar waves and, importantly, without the hassle described above. Once the Weis wave size is set then the zigzag wave will be shown with volume. Because Weis used the closing price of a wave to define waves a line Bar highs and bar lows are not captured by the Weis Wave. The default script setting is now cumulative volume waves using an ATR of 7 and a multiplication factor of .5.
To display volume in a way that does not crowd out neighbouring volumes Weis displayed volume as a maximum of 3 digits (usually). Consider two Weis Wave volumes 176,895,570 and 2,654,763,889. To display wave volume as three digits it is necessary to take a number such as 176,895,570 and truncate it. 176,895,570 can be represented as 177 X 10 to the power of 6. The number displayed must also be relative to other numbers in the field. If the highest volume on the page is: 2,654,763,889 and with only three numbers available to display the result the value shown must be 265 (265 X 10 to the power of 7). Since 176,895,570 is an order of magnitude smaller than 2,654,763,889 therefore 175,895,570 must be shown as 18 instead of 177. In this way, the relative magnitudes of the two volumes can be understood. All numbers in the field of view must be truncated by the same order of magnitude to make the relative volumes understandable. The script attempts to calculate the order of magnitude value automatically. If you see a red number in the field of view it means the script has failed to do the calculation automatically and you should use the manual method – use the dialogue box “Calculate truncated wave value automatically or manually”. Scroll down from the automatic method and select manual. Once "manual" is selected the values displayed become the power values or multipliers for each wave.
Using the manual method you will select a “Multiplier” in the next dialogue box. Scan the field and select the largest value in the field of view (visible chart) is the multiplier of interest. If you select a lower number than the maximum value will see at least one red “up”. If you are too high you will see at least one red “down”. Scroll in the direction recommended or the values on the screen will be totally incorrect. With volume truncated to the highest order values, the eye can quickly get a feel for relative volumes. It also reduces the crowding and overlapping of values on the screen. You can opt to show the full volume to help get a sense of the magnitude of the true volumes.
How does the script determine if a Weis wave is continuing to grow or not?
The script evaluates the closing price of each new bar relative to the "Weis wave size". Suppose the current bar closes at a new low close, within the current down wave, at $30.00. If the Weis wave size is $0.10 then the algorithm will remember the $30.00 close and compare it to the close of the next bar. If the bar close price does not close equal to or lower than $30.00 or close equal to or higher than $30.10 then the wave is still a down wave with a current low of $30.00. This is true even if the bar low is less than $30.00 or the bar high is greater than 30.10 – only the bar’s closing price matters. If a bar's closing price climbs back up to a close of $30.11 then because the closing price has moved more than $0.10 (the Weis wave size) then that is a wave reversal with a new up-trending wave. In the above example if there was currently a downward trending wave and the bar closes were as follows $30.00, $30.09, $30.01, $30.05, $30.10 The wave direction would continue to stay downward trending until the close of $30.10 was achieved. As such $30.00 would be the low and the following closes $30.09, $30.01, $30.05 would be allocated to the new upward-trending wave. If however There was a series of bar closes like this $30.00, $30.09, $30.01, $30.05, $29.99 since none of the closes was equal to above the 10-cent reversal target of $30.10 but instead, a new Weis wave low was achieved ($29.99). As such the closes of $30.09, $30.01, $30.05 would all be attributed to the continued down-trending wave with a current low of $29.99, even though the closing price for the interim bars was above $30.00. Now that the Weis Wave low is now 429.99 then, in order to reverse this continued downtrend price will need to close at or above $30.09 on subsequent bar closes assuming now new low bar close is achieved. With large wave sizes, wave direction can be in limbo for many bars before a close either renews wave direction or reverses it and confirms wave direction as either a reversal or a continuation. On the zig-zag, a wave line and its volume will not be "printed" until a wave reversal is confirmed.
The wave attribution is similar when using other methods to define wave size. If ATR is used for wave size instead of a traditional wave constant size such as $0.10 or $2 or 2000 pips or ... then the wave size is calculated based on current ATR instead of the Weis wave constant (Traditional selected value).
I have the option to display pseudo-Ord volume. In truth, Ord used more traditional zig-zag pivots of bar highs and lows. Waves using closes as pivots can have some significant differences. This difference can be lessened by using smaller time frames and larger wave sizes.
There are other options such to display the delta price or pip size of a Weis Wave, the number of bars in a wave, and a few other options.

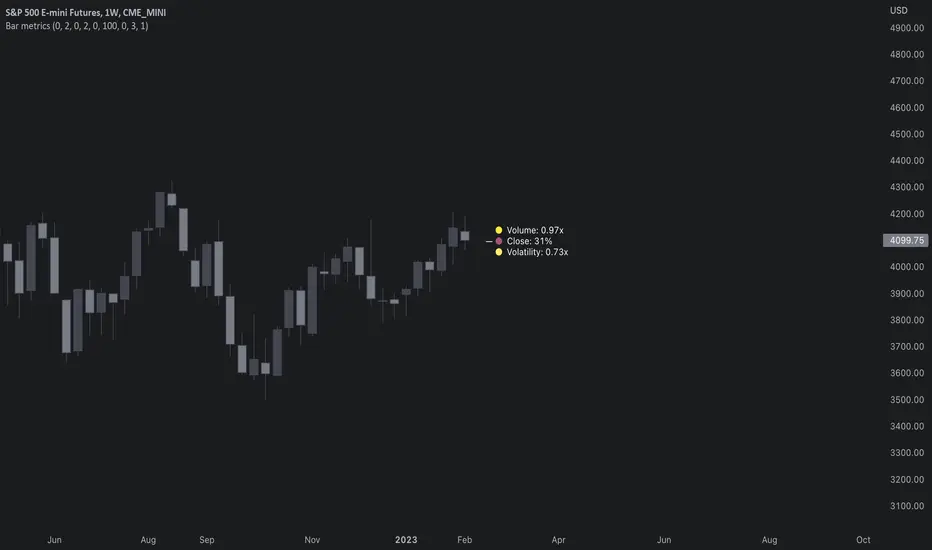
Bar metrics / quantifytools— Overview
Rather than eyeball evaluating bullishness/bearishness in any given bar, bar metrics allow a quantified approach using three basic fundamental data points: relative close, relative volatility and relative volume. These data points are visualized in a discreet data dashboard form, next to all real-time bars. Each value also has a dot in front, representing color coded extremes in the values.
Relative close represents position of bar's close relative to high and low, high of bar being 100% and low of bar being 0%. Relative close indicates strength of bulls/bears in a given bar, the higher the better for bulls, the lower the better for bears. Relative volatility (bar range, high - low) and relative volume are presented in a form of a multiplier, relative to their respective moving averages (SMA 20). A value of 1x indicates volume/volatility being on par with moving average, 2x indicates volume/volatility being twice as much as moving average and so on. Relative volume and volatility can be used for measuring general market participant interest, the "weight of the bar" as it were.
— Features
Users can gauge past bar metrics using lookback via input menu. Past bars, especially recent ones, are helpful for giving context for current bar metrics. Lookback bars are highlighted on the chart using a yellow box and metrics presented on the data dashboard with lookback symbols:
To inspect bar metric data and its implications, users can highlight bars with specified bracket values for each metric:
When bar highlighter is toggled on and desired bar metric values set, alert for the specified combination can be toggled on via alert menu. Note that bar highlighter must be enabled in order for alerts to function.
— Visuals
Bar metric dots are gradient colored the following way:
Relative volatility & volume
0x -> 1x / Neutral (white) -> Light (yellow)
1x -> 1.7x / Light (yellow) -> Medium (orange)
1.7x -> 2.4x / Medium (orange) -> Heavy (red)
Relative close
0% -> 25% / Heavy bearish (red) -> Light bearish (dark red)
25% -> 45% / Light bearish (dark red) -> Neutral (white)
45% - 55% / Neutral (white)
55% -> 75% / Neutral (white) -> Light bullish (dark green)
75% -> 100% / Light bullish (dark green) -> Heavy bullish (green)
All colors can be adjusted via input menu. Label size, label distance from bar (offset) and text format (regular/stealth) can be adjusted via input menu as well:
— Practical guide
As interpretation of bar metrics is highly contextual, it is especially important to use other means in conjunction with the metrics. Levels, oscillators, moving averages, whatever you have found useful for your process. In short, relative close indicates directional bias and relative volume/volatility indicates "weight" of directional bias.
General interpretation
High relative close, low relative volume/volatility = mildly bullish, bias up/consolidation
High relative close, medium relative volume/volatility = bullish, bias up
High relative close, high relative volume/volatility = exuberantly bullish, bias up/down depending on context
Medium relative close, low relative volume/volatility = noise, no bias
Medium relative close, medium to high relative volume/volatility = indecision, further evidence needed to evaluate bias
Low relative close, low relative volume/volatility = mildly bearish, bias down/consolidation
Low relative close, medium relative volume/volatility = bearish, bias down
Low relative close, high relative volume/volatility = exuberantly bearish, bias down/up depending on context
Nuances & considerations
As to relative close, it's important to note that each bar is a trading range when viewed on a lower timeframe, ES 1W vs. ES 4H:
When relative close is high, bulls were able to push price to range high by the time of close. When relative close is low, bears were able to push price to range low by the time of close. In other words, bulls/bears were able to gain the upper hand over a given trading range, hinting strength for the side that made the final push. When relative close is around middle range (40-60%), it can be said neither side is clearly dominating the range, hinting neutral/indecision bias from a relative close perspective.
As to relative volume/volatility, low values (less than ~0.7x) imply bar has low market participant interest and therefore is likely insignificant, as it is "lacking weight". Values close to or above 1x imply meaningful market participant interest, whereas values well above 1x (greater than ~1.3x) imply exuberance. This exuberance can manifest as initiation (beginning of a trend) or as exhaustion (end of a trend):
Volume Breakouts v2The Volume Breakouts Indicator 2.0 is a comprehensive improvement on its predecessor "Volume Breakouts" with new features and improved performance. It offers high customization options where almost every aspect can be changed to suit your preferences.
The main functionality of the indicator is to display volume that exceeds a certain level of relative volume with a specific color, and now it also differentiates between strong up and strong down days. The legacy mode from the previous version is still available, and the calculation error has been corrected in the legacy mode.
Volume Bars in their default configuration are determined by the following factors: Up and Down days, relative volume , and a strong/weak close range. The strong/weak close range is determined by marking bars with a "strong" color only if the close price is higher/weaker than 60% or 40% of the candlestick range - otherwise the color gets downgraded by one level (for example from strong green upday to medium strong blue upday). The main options for Volume Bars are the "Multipliers", where a multiplier of 1.5 represents 150% relative volume . For example, if there is an up day closing above 60% of its range and the volume is above the defined moving average threshold times the multiplier, the bar will be colored green.
(the option: "Strong/week close range" is optional and can be disabled)
Upday and multiplier 2: green
Upday and multiplier 1: blue
Downday and multiplier 2: red
Downday and multiplier 1: pink
The indicator also integrates Pocket Pivots , which are displayed as "star" icons above the current volume bar. There are two types of Pocket Pivots:
The day's volume should be larger than the highest down volume day over the prior 10 days (Rule No. 3, Chris Kacher)
If the pocket pivot occurs in an uptrend after the stock has broken out, it should act constructively around its 10-dma." The star will appear in black if the first condition is met and red if the second condition is met. (Rule No. 4, Chris Kacher)
The signal (star) will appear in black if the first condition is met and red if the second condition is met.
A new addition to the indicator is the Dashboard of different variables, which can be individually enabled or disabled. These variables include:
Actual volume: the volume of the most recent bar
Actual dollar volume: the amount of $ traded on the most recent bar
Average volume: the average volume over a defined period of time (same as moving average)
Average dollar volume: the amount of $ traded over a defined period of time (same as moving average)
Relative volume: the relative value of the current bar compared to the moving average of the volume
Up/down volume ratio: the total of the stock's volume on days when it closes up divided by the volume traded on days when the stock closed down. The assumption is that if a stock closes up for the day, the volume was buying induced and thus the stock is under accumulation
Free floating shares: Free float, also known as public float, refers to the shares of a company that can be publicly traded and are not restricted (for example held by insiders)
Rocket Ratio: Is a value (Formula: Float/AvgVolume) which measures the liquidity of the stock. A lower value means that fewer shares can move the stock fast. The default threshold is < 150
All colors can be customized, and there is also a predefined option for dark mode.

BE - Pr_DayLowHigh_BreakoutScreener AlgoHerewith presenting the Screener based indicator which supports Algo trade on the NSE stocks. The idea behind this indicator is when the Current day stock breaks out of Yesterday's high or Low with promising volumes (Using MA's and POC of Volume Profile) along with formation of candle Pattern. Initiates the Trade entries.
Note: Indicator is designed to take an entry even before the candle is closed as soon as the entry level is crossed and it shall exit the trade as soon as the SL is hit even before candle is close.
How to Work with this Indicator.
You can map up to 15 Scripts in this indicator. However you may decide if you wish to load all 15 are few of them. if you wish to load only 10, below settings should help you ignore the rest 10 symbols from screening it for setups
Updating Symbol Script.
This is an important part is used for Algo trades. Read the tooltip for better understanding of the format. Acceptable format is Broker Name followed with : and space with Symbol mapping Name followed with / and Instrument token provided by broker if no token alloted for the script then you may keep 0 against symbol name followed with / and Qty in terms of absolute value or in terms of percentage.
Trade and Scan Settings
Symbol List Mapping
For Improvements in Results - Use Events and keep a track of it / use Nudges etc.
