Filter Bar1. Indicator Name
Filter Bar
2. One-line Introduction
A trend-aware bar coloring system that visualizes market direction and strength through adaptive transparency based on regression scoring.
3. General Overview
Filter Bar+ is a minimalist but powerful trend visualization tool that colors chart bars according to market direction and momentum strength.
It analyzes the linear regression trend alignment over a specified lookback period and uses a pairwise comparison algorithm to determine whether the market is in a bullish, bearish, or neutral state.
The result is a "trend score" that gets normalized to reflect trend intensity (0~1).
Bar colors are then dynamically updated using the specified bullish or bearish base colors, where higher intensity results in more opaque (darker) bars, and weaker trends lead to lighter, faded tones.
If no strong trend is detected, bars are shown in gray, signaling indecision or neutrality.
The strength of this indicator lies in its simplicity—it doesn’t draw lines, waves, or shapes, but overlays insight directly onto the chart through smart color cues.
It’s particularly effective as a background filter for price action traders, scalpers, and anyone who prefers clean charts but still wants embedded directional context.
4. Key Advantages
🎨 Adaptive Bar Coloring
Bar color opacity increases with trend strength, offering instant visual confirmation without clutter.
📊 Quantified Trend Direction
Uses a regression-based scoring system to reliably detect uptrends, downtrends, or sideways markets.
⚖️ Customizable Sensitivity
Parameters like lookback period and tolerance percentage give users full control over signal responsiveness.
🧼 Clean Chart Presentation
No lines, shapes, or overlays—just color-coded bars that blend into your existing chart setup.
🚀 Lightweight & Fast
Minimal computational load ensures it works smoothly even on lower-end devices or multiple chart setups.
🔒 Secure Internal Logic
Algorithm is neatly encapsulated and optimized, with no critical logic exposed.
📘 Indicator User Guide
📌 Basic Concept
Filter Bar+ evaluates trend direction and strength using a pairwise comparison of linear regression values.
The result determines whether the market is bullish, bearish, or neutral, and adjusts bar colors accordingly.
It visually amplifies the current market state without drawing any indicators on the chart.
⚙️ Settings Explained
Lookback Period: Number of bars used to compare regression values
Range Tolerance (%): Minimum score required to label a trend as bullish or bearish
Regression Source: Data input used for regression (default: close)
Linear Regression Length: Period for generating the base regression line
Bull/Bear Base Colors: Choose colors to represent bullish or bearish bars
📈 Buy Timing Example
Bars are green (or user-set bullish color) and becoming more vivid
Indicates a strengthening bullish trend; helpful when used alongside breakout confirmation or support zones
📉 Sell Timing Example
Bars turn red (or your custom bearish color) with increasing opacity
Signals growing bearish pressure; acts as confirmation during short setups or breakdowns
🧪 Recommended Use Cases
Combine with volume, RSI, or price action setups for direction filtering
Ideal for clean chart strategies where visual simplicity is preferred
Use as a confirmation layer to reduce noise in sideways markets
🔒 Precautions
This is a visual filter, not a signal generator—use alongside other strategies for entries/exits
In choppy markets, bars may flicker between colors—adjust sensitivity as needed
Works best when you already have a directional thesis and want to validate it visually
Always test settings for your asset/timeframe before applying in live trades
Pullbacktrading

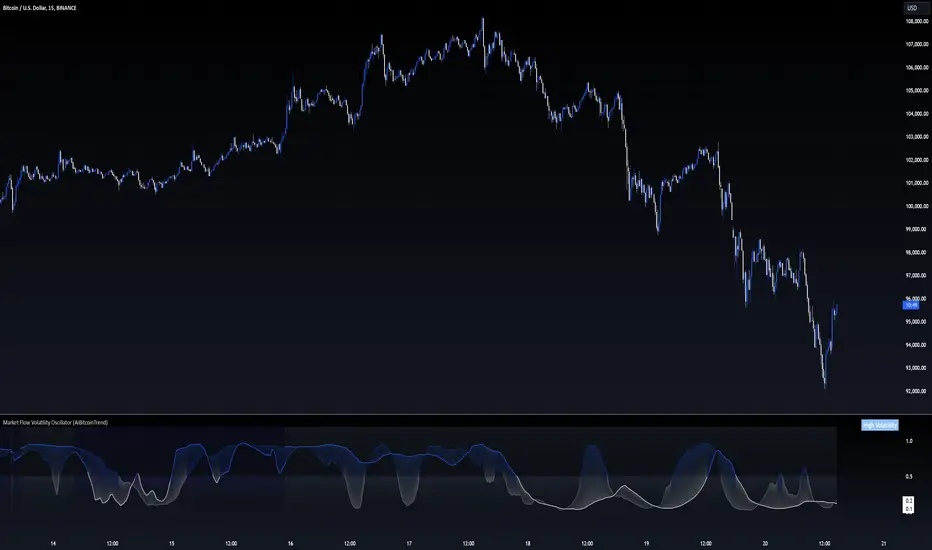
Market Flow Volatility Oscillator (AiBitcoinTrend)The Market Flow Volatility Oscillator (AiBitcoinTrend) is a cutting-edge technical analysis tool designed to evaluate and classify market volatility regimes. By leveraging Gaussian filtering and clustering techniques, this indicator provides traders with clear insights into periods of high and low volatility, helping them adapt their strategies to evolving market conditions. Built for precision and clarity, it combines advanced mathematical models with intuitive visual feedback to identify trends and volatility shifts effectively.
👽 How the Indicator Works
👾 Volatility Classification with Gaussian Filtering
The indicator detects volatility levels by applying Gaussian filters to the price series. Gaussian filters smooth out noise while preserving significant price movements. Traders can adjust the smoothing levels using sigma parameters, enabling greater flexibility:
Low Sigma: Emphasizes short-term volatility.
High Sigma: Captures broader trends with reduced sensitivity to small fluctuations.
👾 Clustering Algorithm for Regime Detection
The core of this indicator is its clustering model, which classifies market conditions into two distinct regimes:
Low Volatility Regime: Calm periods with reduced market activity.
High Volatility Regime: Intense periods with heightened price movements.
The clustering process works as follows:
A rolling window of data is analyzed to calculate the standard deviation of price returns.
Two cluster centers are initialized using the 25th and 75th percentiles of the data distribution.
Each price volatility value is assigned to the nearest cluster based on its distance to the centers.
The cluster centers are refined iteratively, providing an accurate and adaptive classification.
👾 Oscillator Generation with Slope R-Values
The indicator computes Gaussian filter slopes to generate oscillators that visualize trends:
Oscillator Low: Captures low-frequency market behavior.
Oscillator High: Tracks high-frequency, faster-changing trends.
The slope is measured using the R-value of the linear regression fit, scaled and adjusted for easier interpretation.
👽 Applications
👾 Trend Trading
When the oscillator rises above 0.5, it signals potential bullish momentum, while dips below 0.5 suggest bearish sentiment.
👾 Pullback Detection
When the oscillator peaks, especially in overbought or oversold zones, provide early warnings of potential reversals.
👽 Indicator Settings
👾 Oscillator Settings
Sigma Low/High: Controls the smoothness of the oscillators.
Smaller Values: React faster to price changes but introduce more noise.
Larger Values: Provide smoother signals with longer-term insights.
👾 Window Size and Refit Interval
Window Size: Defines the rolling period for cluster and volatility calculations.
Shorter windows: adapt faster to market changes.
Longer windows: produce stable, reliable classifications.
Disclaimer: This information is for entertainment purposes only and does not constitute financial advice. Please consult with a qualified financial advisor before making any investment decisions.
LNL Pullback ArrowsBuying the dip has never been easier! LNL Pullback Arrows are here to pinpoint the best possible entries for the trend following setups. With the Pullback Arrows, trader can pick his own approach and risk level thanks to four different types of arrows. The goal of these arrows is to force the traders to scale in & out of trades which is in my opinion crucial when it comes to trend following strategies. These arrows were designed primarily for the daily & weekly time frame (swing trading).
Four Types of Pullback Arrows:
1. Aggro Arrows - Ideal for aggresive approach during parabolic trends. Sometimes trends are so strong that the price barely revisits the daily 8 EMA. This is where the aggro arrows can perfectly pinpoint the aggresive high risk entries. Ideal for halfsize or 1/4 size of the full position. Aiming for quick 1-2 day moves targeting the recent high/low. These arrows could be also named as scalping arrows for the swing traders. A quick In & Out.
2. HalfSize Arrows - Medium risk approach. First arrows to scale in. HalfSize arrows are the first sign that the pullback might be ending, yet there is still some space left for an even deeper pullback. That is the reason why they are called half-size. Ideally taken with half-sized position. When trading the HalfSize Arrows, It is better to have some "spare ammo in the gun" ready to use.
3. FullSize Arrows - Regular risk approach. These arrows represent a zone where the core of the posititon should be taken. The point of validity for the trend is not that far away, meaning the risk can be kept tight. Ideal for scailing the other halfs or quarters of the full position. Also great for more conservative traders or environments with higher volatility.
4. Rare Arrows - Offer the best risk to reward entries during the trend. Rare Arrows should be the "last kick" of the retracement, therefore stops can be positioned really tight. They either trigger the stop immidiately or they provide another juicy leg up or down in the direction of the trend. However, they really do appear rarely.
Simple EMA Cloud:
A simple cloud based on 21 and 55 exponential moving averages. This default length creates a pullback zone that is wide enough for the conservative traders but also give the opportunities to more aggresive traders. Alternatives such as 8 & 21, or 21 & 34 are forming the zone that is too aggresive and usually too thin. Of course, cloud can be fully adjusted or turned off completely. The only role of the cloud is to gauge the trend.
Tips & Tricks:
1.Importance of the Scailing
- As already stated, scailing is crucial to this since there is no way of knowing the exact level at which the price magically bounce every time. It is hard to tell where and which EMA will be respected. How can we know it will be 21 EMA every time? or 34 EMA or 10 EMA or 100 SMA or 50 DMA ... Single MA does not make a trend. This is the reason why scailing is so important. Scailing can make a difference.
2. Nothing is Perfect
- Same as any other study, nothing works 100% perfectly. Sometimes the setup will go right against you and sometimes the price will fade away sideways and breaks off the structure of the trend. This is not a magic certainty tool. This is just another probability tool.
3. Point of Validity & Other Studies
- Even though the pullback arrows can be a stand-alone strategy. It is important to use other indicators that visualize the actual trend. Whether its EMA Cloud or EMAs or DMI Bars or Keltner Channels, there should be something that validates the trend, something that tells the trend is over. (Pullback Arrows are not showing the actual stops!).
Hope it helps.

Follow the Trend - Trade PullbacksKindly follow the rules stated below for entry, exit and stop loss. Not every Buy / Sell signal will be profitable.
Timeframe of the chart acts as current timeframe. You need to choose 2 more as middle and higher timeframes.
This indicator is based on candlesticks, ATR and CCI indicators and the logic provides buy / sell signals at the pullbacks of the trend depicted by higher timeframe, that must be respected throughout.
Enter the long / short trade respectively when the indicator gives buy / sell signal after price has gone below the green / above the red line for higher timeframe.
Stop loss shall be low / high of recent swing. Exit when the price closes below / above the middle timeframe, to be used as trailing target.
Use it for any instrument for any timeframe of your choice.
For example, check the shared chart. It is a 1 min intraday, but the indicator can be used for short or long term positional trades as well.
Enter long at 14102, with stop loss 14077. Trailing target is achieved at 14156 giving a Risk:Reward ratio of 1:2.
Another Buy signal is observed around same level and uptrend continues till day end, again for a Risk:Reward ratio of approx. 1:2.
Rules to follow for Long trades -
Enter long position at Buy signal given after price has moved below green line of higher timeframe.
Exit the position when price closes below orange / blue line of middle timeframe.
Stop loss must be at low of recent swing, appearing just before the Buy signal.
Rules to follow for Short trades -
Enter short position at Sell signal given after price has moved above red line of higher timeframe.
Exit the position when price closes above orange / blue line of middle timeframe.
Stop loss must be at high of recent swing, appearing just before the Sell signal.

Simple TrenderOriginates from:
I was reading some Impulse Trading literature by A. Elder.. In it, someone named Kerry Lovvorn proposed "An End of Day Trend Following System" for someone lazy.
Originally it is just price closing above an 8 ema (low) for long. Exit when price closes below an 8 ema (low). The opposite for a short position.
Conditions: Buy when price closed below ema (low) for two bars or more, then closes above. Opposite for a short position. I do not follow this condition. Though it may help with whipsaw.
My condition is when price closes above the 26 ema (low) (works the best for me) I place orders above the initial crossing bars high. Opposite for lows.
I look for stocks that are low in price to go long on. I want the run from 2's to 15's
I look for stocks that are mid-teens/20's in price to go short on. I want the run from 20's to 2's
I look for stock with news and earnings that are already running (up or down) to play the pullback.
These conditions can easily be scanned for on thinkorswim
From first glance, the system looks like CMsling shotsystem. Although, I plagiarized some parts of the codes, because I am inept when it comes to that shit, it differs as it is not a moving average crossover system.
It is a price crossing over concept. A moving average VWAP is used for best entries on pullbacks.
Purpose:
--To catch the majority of a trend/wave/run.
--To identify pullback areas to go long or short while in midst of trend. To catch pullbacks off news and earning runners.
--To catch the initial start of trend with clear rules to enter
--Clear rules to exit
Issues
--possibilities of getting ninja sliced the fuck up. Can be mitigated by entering stocks with decent average volume. And also only going long above 200 ema and short below it. ADX won't work, at the initial start of the trend it will show not trending. Can look at blow off volume at the bottom followed by increase in buying for long and vice versa for short.
--Can give some huge gains away through gap ups or gap downs from news or earnings during trend. However, can get huge gain on gaps from news or earning. Nature of the game.
--Need some brass balls and a supply of pepto to stomach through some of the pullbacks. Gut wrenching seeing big gains dwindle. But they all even out at the end, you hope. (see NBEV and IGC, and CRON and others. shit don't go in straight lines, homie)
Pros
--It's simple and easy. Overall, you profit
--works with any security
Cons
--It can be stressful.
--does not work well on lower time frames. Do not recommend going below 15 minutes
--Possibility of working on 5 minutes with a time frame breakout strategy (15,30 min).
Couple it with LazyBear "Weis Wave Volume" indicator. Works well for pullback entries.
Enjoy. Ride some waves.
