Probability

Cumulative distribution function - Probability Cumulative distribution function (tScore and zScore)
This script provides the calculation of the cumulative distribution function (i.e., probability). The measure allows you to calculate the chances of a value of interest being above or below a hypothesized value over the measurement period—nothing fancy here, just good old statistics and mathematics. The closer you are to 0 or 1, the more significant your measurement. We’ve included a significance level highlighting feature. The ability to turn price and/or volume off.
We have included both the Z and T statistics. Where the ‘Z’ is looking at the difference of the current value, minus the mean, and divided by the standard deviation. This is usually pretty noisy on a single value, so a smoother is included. Nice shoutout to the Pinecoders Github Page with this function also. The t-statistic is measuring the difference between a short measurement, an extended measurement, and divided by the standard error (sigma/sqrt(n)). Both of these are neatly wrapped into a function, so please feel free to use them in your code. Add a bit of science to your guessing game. For the purists out there, we have chosen to use sigma in the t-statistic because we know the population's behavior (as opposed to the s-measure). We’ve also included two levels of the t-statistic cumulative distribution function if you are using a short sample period below 6.
Finally, because everyone loves choices, we’ve included the ability to measure the probability of:
the current value (Price and volume)
change
percent change
momentum (change over a period of time)
Acceleration (change of the change)
contribution (amount of the current bar over the sum)
volatility (natural log ratio of today and the previous bar)
Here is a chart example explaining some of the data for the function.
Here are the various options you have the print the different measurements
A comparison of the t-statistic and z-statistic (t-score and z-score)
And the coloring options

Bull/Bear Probability [Anan]Hello Friends,,,
===================================
This indicator is based on Bayes' Theorem and is fully based on probabilities.
===================================
Formula For Bayes' Theorem:
P(Bull|Bear) = P(Bear∣Bull) * P(Bull) / P(Bear)
where:
Bull and Bear are events and P is probability
P(Bull|Bear) is the posterior probability, the probability of Bull after taking into account Bear
P(Bear∣Bull) is the conditional probability or likelihood, the degree of belief in Bear given that proposition of Bull belief (Bull true)
P(Bull) is the prior probability, the probability of Bull belief
P(Bear) is the prior probability, the probability of Bear belief
===================================
The indicator output 2 trend lines and (Bull/Bear) Signal :
Bull/Bear Probability Trend :
when the price is above it = Up Trend
when the price is below it = Down Trend
Bull/Bear Probability Trend Moving Average :
when the price is above it = Up Trend
when the price is below it = Down Trend
(Bull/Bear) Signal :
when Probability Trend Moving Average crossover Probability Trend = Bull Signal
when Probability Trend Moving Average crossunder Probability Trend = Bear Signal
===================================
Disclaimer:
This script is for informational and educational purposes only.
Use of the script does not constitutes professional and/or financial advice.
You alone the sole responsibility of evaluating the script output and risks associated with the use of the script.
===================================
Thanks to my friends dgtrd because he inspired me about probability, take a look at his scripts.
===================================

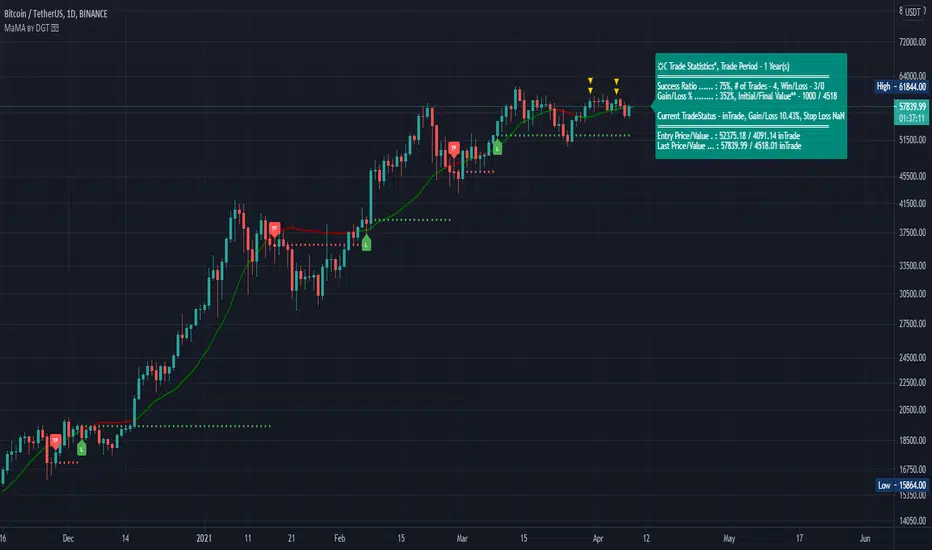
Momentum adjusted Moving Average by DGTA brand new Moving Average , calculated using Momentum, Acceleration and Probability (Psychological Effect).
Momentum adjusted Moving Average(MaMA) is an indicator that measures Price Action by taking into consideration not only Price movements but also its Momentum, Acceleration and Probability. MaMA, provides faster responses comparing to the regular Moving Average
Here is the math of the MaMA idea
Momentum measures change in price over a specified time period
momentum = source – source(length)
where,
source, indicates current bar’s price value
source(length), indicates historical price value of length bars earlier
Lets play with this formula and rewrite it by moving source(length) to other side of the equation
source = source(length) + momentum
to avoid confusion let’s call the source that we aim to predict as adjustedSource
adjustedSource = source(length) + momentum
looks nice the next value of source simply can be calculated by summing of historical value of the source value and value of the momentum. I wish it was so easy, the formula holds true only when the momentum is conserved/constant/steady but momentum move up or down with the price fluctuations (accelerating or decelerating)
Let’s add acceleration effects on our formula, where acceleration is change in momentum for a given length. Then the formula will become as (skipped proof part of acceleration effects, you may google for further details)
adjustedSource = source(length) + momentum + 1/2 * acceleration
here again the formula holds true when the acceleration is constant and once again it is not the case for trading, acceleration also changes with the price fluctuations
Then, how we can benefit from all of this, it has value yet requires additional approaches for better outcome
Let’s simulate behaviour with some predictive approach such as using probability (also known as psychological effect ), where probability is a measure for calculating the chances or the possibilities of the occurrence of a random event. As stated earlier above momentum and acceleration are changing with the price fluctuations, by using the probability approach we can add a predictive skill to determine the likelihood of momentum and acceleration changes (remember it is a predictive approach). With this approach, our equations can be expresses as follows
adjustedSource = source(length) + momentum * probability
adjustedSource = source(length) + ( momentum + 1/2 * acceleration ) * probability , with acceleration effect
Finally, we plot MaMA with the new predicted source adjustedSource, applying acceleration effect is made settable by the used from the dialog box, default value is true.
What to look for:
• Trend Identification
• Support and Resistance
• Price Crossovers
Recommended settings are applied as default settings, if you wish to change the length of the MaMA then you should also adjust length of Momentum (and/or Probability). For example for faster moving average such as 21 period it would be suggested to set momentum length to 13
Alternative usage , set moving average length to 1 and keep rest lengths with default values, it will produce a predictive price line based on momentum and probability. Experience acceleration factor by enabling and disabling it
Conclusion
MaMA provide an added level of confidence to a trading strategy and yet it is important to always be aware that it implements a predictive approach in a chaotic market use with caution just like with any indicator
Trading success is all about following your trading strategy and the indicators should fit within your trading strategy, and not to be traded upon solely
Disclaimer : The script is for informational and educational purposes only. Use of the script does not constitutes professional and/or financial advice. You alone the sole responsibility of evaluating the script output and risks associated with the use of the script. In exchange for using the script, you agree not to hold dgtrd TradingView user liable for any possible claim for damages arising from any decision you make based on use of the script
Bayes Probability Index by DGTWhat is Probability?
It is a measure for calculating the chances or the possibilities of the occurrence of a random event. In simple words, it calculates the chance of the favorable outcome amongst the entire possible outcomes. Mathematically, if you want to answer what is probability, it is defined as the ratio of the number of favorable events to the total number of possible outcomes of a random events.
Is this enough? May be or may be not
Let’s consider an example,
A simple probability question may ask: "What is the probability of Amazon.com's stock price falling?"
How about if we extend our question a step further by asking: "What is the probability of AMZN stock price falling given that the Dow Jones Industrial Average (DJIA) index fell earlier?"
Now we are ready to consider conditional probability and Bayes' Theorem is where we could find answer to this question
Bayes' Theorem
Bayes' theorem, named after 18th-century British mathematician Thomas Bayes, is a mathematical formula for determining conditional probability. Conditional probability is the likelihood of an outcome occurring, based on prior knowledge of conditions or another related event occurring. Bayes' theorem provides a way to revise existing predictions or theories (update probabilities) given new or additional evidence. Bayes' theorem thus gives the probability of an event based on new information that is, or may be related, to that event
Formula For Bayes' Theorem
P(A|B) = P(B∣A) * P(A) /P(B)
= P(B∣A) * P(A) / (P(B∣A)* P(A) + P(B∣A’)* P(A’) )
where
A and B are events and P is probability
P(A|B) is the posterior probability, the probability of A after taking into account B
P(A) is the prior probability, the probability of A belief
P(A’) is the prior probability, the probability of A disbelief : P(A’)=1- P(A)
P(B) is the prior probability, the probability of B belief
P(B∣A) is the conditional probability or likelihood, the degree of belief in B given that proposition of A belief (A true)
P(B∣A’) is the conditional probability or likelihood, the degree of belief in B given that proposition of A disbelief (A false)
Bitcoin was the first-ever cryptocurrency, designed by Satoshi Nakamoto. In its likeness, all other cryptocurrencies were then created. The relationship between Bitcoin and altcoins remains something crypto analyst watch closely. This study aims to display the likelihood of bullish movement for ALTS-USDT pairs taking into consideration of bullish move probability of BTC-USDT pair
What to look for:
Percentage Value of the Conditional Probability and/or Simple Probability. When value is above %50 than bullish move is more probable, conversely when the value is below %50 bearish move is more likely
Limitations : Conditional Probability Line will be shown for daily time frame only, Simply Probability Line would be available for all time frames
Conditional Probability is calculated with the condition of BTC-USDT pair so using Conditional Probability is suggested with ALTS-USDT pairs.
Indicators aim to generate a potential signal/indication of an upcoming opportunity, but, the Indicators themselves do not guarantee the future movement of a given financial instrument, and are most useful when used in combination with other techniques.
Trading success is all about following your trading strategy and the indicators should fit within your trading strategy, and not to be traded upon solely
Disclaimer : The script is for informational and educational purposes only. Use of the script does not constitutes professional and/or financial advice. You alone the sole responsibility of evaluating the script output and risks associated with the use of the script. In exchange for using the script, you agree not to hold dgtrd TradingView user liable for any possible claim for damages arising from any decision you make based on use of the script

multi pack fisher's and EMACross and Probabilty densityFisher dönüşümün farklı türlerini en çok kullanılan indikartörlerle yeniden sentezlenmesi sonucu ve farklı ema kesimlerine olasılık dağılım yoğunluğu eklenerek içinde bulunan piyasanın trend gücünü görseleştirme amaçlanmıştır.Çalışma tamamen eğitim amaçlı olup, farklı indikatörlerin bir arada kullanımını göstermek için hazırlanmıştır.Kesinlikle yatırım tavsiyesi değildir.
Saygılarımla...
LazEngineer ,Elecrical Engineer
// English explanation
It is aimed to visualize the trend of the market containing the result of re-synthesis with the most used indicator in different types of fisher trasform and by adding the density of the distribution Z transform, required for cutting different ema.
Yours truly ...
LazEngineer, Electrical Engineer

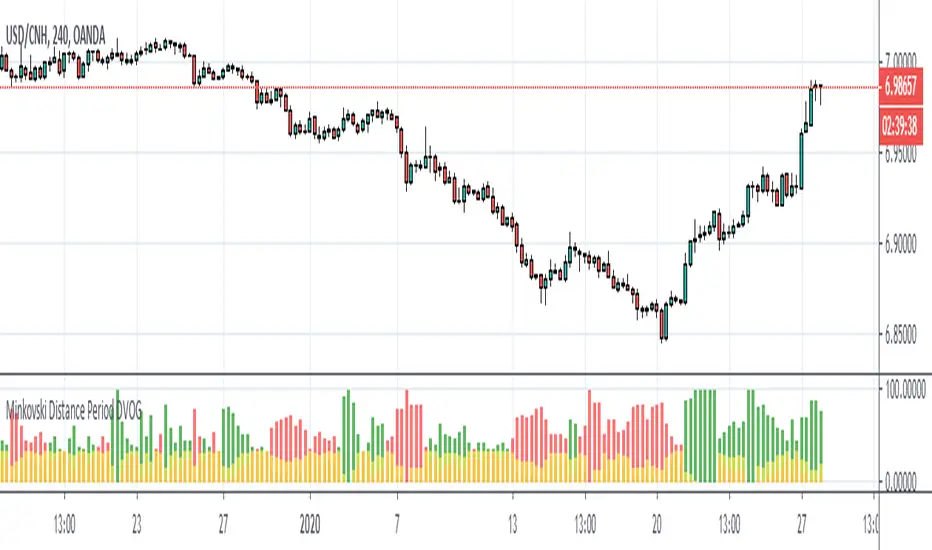
Minkovski Distance Period DVOGThis script was created by building my Dependent Variable Odd Generator script on the Minkovski Distance Adaptive Period.
I have tried this on MACD before.
Script related to MACD :
I used an older version that does not use Dow Factor to suit multi timeframe analysis.
In this way, market situations provide the opportunity to see histograms in an adaptive period as a Multi Timeframe.
Minkowski Distance Function Original Script by RicardoSantos :
Regards.
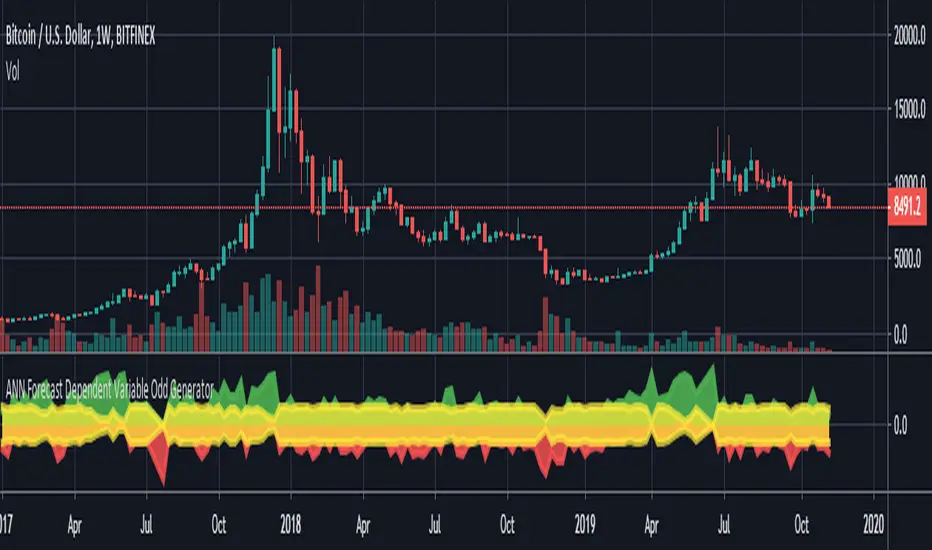
ANN Forecast Dependent Variable Odd GeneratorHello , this script is the ANN Forecast version of my "Dependent Variable Odd Generator " script.
I went to simplify a bit because the deep learning calculations are too much for this command.
The latest instruments included:
WTI : West Texas Intermediate (WTICOUSD , USOIL , CL1! ) Average error : 0.007593
BRENT : Brent Crude Oil ( BCOUSD , UKOIL , BB1! ) Average error : 0.006591
GOLD : XAUUSD , GOLD , GC1! Average error : 0.012767
SP500 : S&P 500 Index ( SPX500USD , SP1! ) Average error : 0.011650
EURUSD : Eurodollar ( EURUSD , 6E1! , FCEU1!) Average error : 0.005500
ETHUSD : Ethereum ( ETHUSD , ETHUSDT ) Average error : 0.009378
BTCUSD : Bitcoin ( BTCUSD , BTCUSDT , XBTUSD , BTC1! ) Average error : 0.01050
GBPUSD : British Pound ( GBPUSD , 6B1! , GBP1!) Average error : 0.009999
USDJPY : US Dollar / Japanese Yen ( USDJPY , FCUY1!) Average error : 0.009198
USDCHF : US Dollar / Swiss Franc ( USDCHF , FCUF1! ) Average error : 0.009999
USDCAD : Us Dollar / Canadian Dollar ( USDCAD ) Average error : 0.012162
VIX : S & P 500 Volatility Index (VX1! , VIX ) Average error : 0.009999
ES : S&P 500 E-Mini Futures ( ES1! ) Average error : 0.010709
SSE : Shangai Stock Exchange Composite (Index ) ( 000001 ) Average error : 0.011287
XRPUSD : Ripple (XRPUSD , XRPUSDT ) Average error : 0.009803
Simply select the required instrument from the tradingview analysis screen, then add this command and select the same instrument from the settings section.
The codes are not open-source because they contain forecast algorithm codes a little that I will use commercially in the future.
However, I will never remove this script, and you can use it for free unlimitedly.
For more information about my artificial neural network forecast series:
For more information about my dependent variable odd generator :
For more information about simple artificial neural networks :
(detailed information about ANN )
(25 in 1 version )
I hope it helps in your analysis. Regards , Noldo .
NOTE : In the first pass bar of the definite positive and negative zone, alerts are added for both conditions.
Dependent Variable Odd Generator Risk Detector
In fact, I wrote this script for detect Bollinger and Linear Regression Bands squeeze.
It's a side script.
Logic works like this:
Only the stagnant market probability is drawn from the Bollinger bandwidth by Dependent Variable Odd Generator and MFI index is calculated taking into account the volume.
This value ranges from 0 to 100.
To be sure, this value is averaged over a small period.
If you break the average and exceed 50, the bollinger band is too narrow and the risk is too high.
This means more commissions, more transactions, and vain work.
Or, when in position, the warning is not ignored due to unnecessary signals.
This code is open source under the MIT license. If you have any improvements or corrections to suggest, please send me a pull request via the github repository github.com
Stay tuned , best regards.

Silicone Re-calibrate ATRInspired by @bitmexstorm study Volatility-calibrated ATR
This study features two different ATR trail derivative concepts-Default one is called- "Silicone", and the alternative is called- "Mercurial. To decrease confusion during backtesting, trails plots with distinct color palette.
Options include the ability to apply a smoothening filter that affects both modes as well as an adaptive/fixed mode for the "Silicone" trail.
Parameters for trail dynamics/behavior is unlocked(!Parameters in publish version is far from optimized! Need serious testing! )
Candle Coloring reflects trail direction.
Feedback on optimal periods and multipliers is needed and appreciated

Dependent Variable Odd Generator For Machine Learning TechniquesCAUTION : Not suitable for strategy, open to development.
If can we separate the stagnant market from other markets, can we be so much more accurate?
This project was written to research it. It is just the tiny part of the begining.
And this is a very necessary but very small side function in the main function. Lets start :
Hi users, I had this idea in my mind for a long time but I had a hard time finding the parameters that would make the market stagnant. This idea is my first original command system. Although it is very difficult to make sense of the stagnant market, I think that this command system can achieve realistic proportions. With 's money flow index, I opened the track to determine the level. On the other hand, the prices were also using a money flow index, and it forced me to make the limitations between the levels in a logical way. But the good thing is that since the bollinger bandwidth uses a larger period, we are able to print normal values at extreme buy and sell values.
In terms of price, we can define excessive purchase and sale values as the period is smaller. I have repeatedly looked at the limit values that determine the bull, bear, and bollinger bandwidth (mfi), and I think this is the right one. Then I have included these values in the probability set.
The bull and bear market did not form the intersection of the cluster, and because there are connected events, the stagnant market, which is the intersection, will be added to the other markets with the same venn diagram logic and the sum of the probability set will be 1. is equal to. I hope that we can renew the number generators in the very important parameters of machine learning such as Markov Process with generators dependent on dependent variables, which bring us closer to reality. This function is open to development and can be made of various ideas on machine learning. Best wishes.
This code is open source under the MIT license. If you have any improvements or corrections to suggest, please send me a pull request via the github repository github.com

Bar RatioBar Ratio is an indicator tool that provides real-time likelihood of the current bar closing up or down (green or red).
Technical status, volatility and time are key elements in this indicator.
From the open of a bar, a ratio of 50% is assumed before changes from factors are considered.
The factors that change the likelihood of a bar closing up or down and their relative weight are listed below.
Micro-Trend observed over the last 20 bars - up to 2.5%
Macro-Trend observed over the last 70 bars - up to 2.5%
Current bar price against beginning of Micro-Trend - up to 2.5%
Combination of significant change above average volatility and move against direction of Micro-Trend - up to 2.5%
Combination of significant change above average volatility and move against direction of Macro-Trend - up to 2.5%
Previous bar direction up to 10 consecutive bars - up to 3.75%
Current status of bar (higher or lower) - up to 3.75%
Significance of change against average volatility - up to 5%
Time until bar close - up to 25%
Total: 100%
If all factors are synchronised, the likelihood of the bar closing up or down can be indicated at a probability of 100%.
While the practical ability for this to be used for trading is limited, the tool can be useful for choosing when it is safe to open a trade.
Time is a key element as the likelihood of the bar remaining at current status by the close of the bar is constantly increasing.
The accuracy of this tool is incredible and should be noted as it's primary trait.
You can find and use this indicator on any time-stamp or security such as Cryptocurrency, Forex, Stocks or Indices.
The Bar Ratio can be located by searching in your public indicator library at the top of your chart and adding it to your screen.

Function Markov ProcessEXPERIMENTAL:
this is very experimental and INCOMPLETE, use at your own discretion.
thanks glaz for the help :)

The Path by Atilla Yurtseven: A statistical approach to TradingThe Path uses a statistical method that I have developed to indicate possible Lows and Highs of the current bar for the selected time frame. You can see the range at the opening of the bar. You can narrow or widen the range by changing the "Range %".
What does The Path indicate?
The Path uses a statistical method and calculates the limits of the bar. For example when you enter 75 as "Range %", this means there is 75% probability that High of the bar will be below the top line and 75% probability that Low of the bar will be over the bottom line. You can simply change the range probability between 1-99. The Path looks at the past bars (Look back period) and uses a statistical method to forecast.
The Path does not repaint. Range is there at the opening of the bar and never changes. So when you look at the past data, you can see how it worked well in the past!
The Path works with all time-frames (1min-1month and etc.) and all asset classes (Forex, Stocks, Cryptocurrencies and etc.). It simply works.
Please kindly share your opinions and experiences and feel free to send a comment at the below of this post so i can share more statistical indicators that i have developed based on my method.
Please remember to follow me as well and keep in touch!
FYI: This is an indicator that I have developed for myself. You can use it, apply or not to apply it to your trades. Keep in mind that, you are responsible for all your loses (or wins). Risk is 100% yours. Please use / try "The Path" only if you accept this condition.
Have fun :)
Atilla Yurtseven

P-Signal v2.0Description.
-------------
P-Signal v.2.0 is a modified and improved version of an earlier published P-Signal. This version allows to observe
the signal image for a multi frame - a specific set of periods. In this version it is {T, 2T, 4T, 8T, 16T},
where T equals the “working” time i.e. period for which a chart is observed. For example, if T=5m, one can observe
P-Signal not only for 5m period (ocher curve) but also an average image of P-Signal for 5m, 10m, 20m, 40m, 80m
periods (grey curve) without switching over frames.
Moreover p-Signal v2.0 allows to catch "winning" combinations with help of alerts. When alert is active, you'll receive
a notification if combination exists after working frame was closed. There are two combinations in this version:
“High” and “Straight”. The terminology is borrowed from poker game to more easily present trading ideas.
For example: " EUR.USD Straight SHORT on 4h " and so on.
The “High” alert corresponds to absolute value of Gauss error function of working frame (T) not less the value which
is defined by Alert on “High” parameter. The “Straight” combination is registered if same sign signals (poker “flush”)
are observed simultaneously over set of periods. The rank of “Straight” combination is defined by T and Alert on “Straight”
parameter. This combination is less frequent, but stronger the previous one if parameters are chosen reasonably.
Value of parameters depend on T. The lower T the closer parameters to 1. By default “High” equals to 0.98 and
“Straight” equals to 0.85. Both for T=1m. The other parameters correspond to the first version.
Important ! For correct operation T should not exceed the values of hourly time frames!
Good luck!

PPSignal - Fibonacci ZonesThis is a high probability analysis with Fibonacci Zones.
Zones:
E1 = 1.382
E = 1.00
D1 = 0.618
D = 0.50
Daily Pivot (Balance Point)
B = 0.50
B1 = 0.618
A = 1.00
A1 = 1.382
The Fibonacci ZonesTM are based on the High + Low + Close of TODAY (after the close) and then projecting the Zones for TOMORROW .
You can choose different periods of time to perform the zone calculations according to the timefreame. By default it is set to Weekly (W).

P-Signal v1.0
P-Signal calculates the error function (Gauss-Laplace) for a series of increments in the specific price of time frame.
The absolute value of the signal is equal to the probability of changing the sign of the observed series of increments.
The sign of the observed series coincides with the sign of the signal.
P-Signal v1.0 has two parameters.
- Number of Time Frames defines the length of the series, by default 4.
The larger the value, the smaller the absolute error for the series.
- Smoothing is the anti-aliasing option, it is enabled by default.
As a specific price of time frame, ohlc4 PINE built-in variable is used.

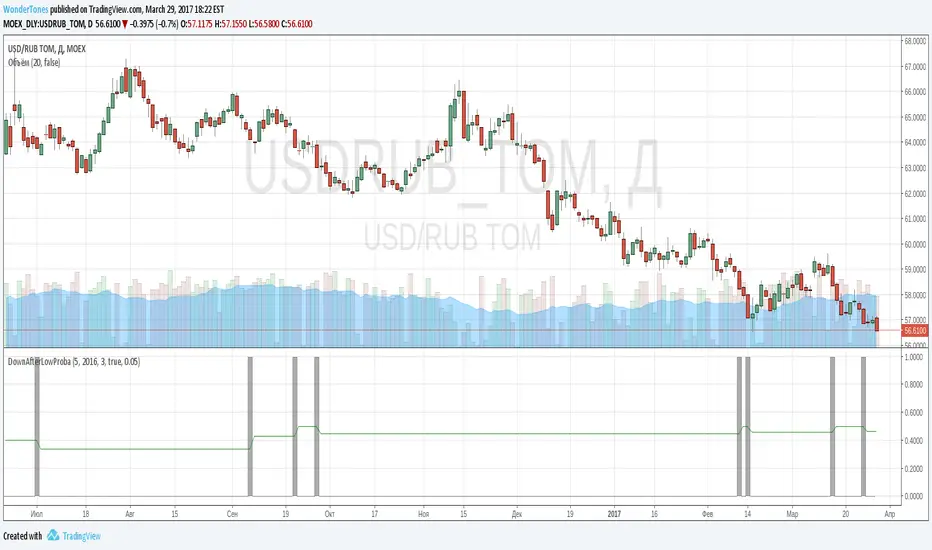
DownAfterLowProba// The script is useful to inspect probability:
// If previous day closed at lowest price for several days
// how often next day would be red bar
// As one can see gray lines indicate bars with lowest close. If next bar is green, increment diff_hi, overwise increment diff_lo
// Probability is counted as diff_lo / (diff_hi+diff_lo)
// One can copy script and change conditions to count other interesting probabilities
UCS-Probability to BounceHey All,
This is an indicator I was developing over the last year. Over some extreme testing and good test results. I am confident to add this to the pool of my indicators.
Yes, this is a protected script. Contains some intensive research.... and every value here is manipulated to fit a general context. Therefore, treat this just like any of my indicator.
If you want to know further about how i use. comment below......

[RS]Study into sequential probabilitys V0EXPERIMENTAL:
just some experimentation to check results, putting it out there. :P
odds of the next bar being up or down bar.

Moving CO-covariance (covariance on covariance)This is Covariance on Covariance. It shows you how much a given covariance period has deviated from it mean over another defined period. Because it is a time series, It can allow you to spot changes in how covariance changes. You can apply trend lines, Fibonacci retracements, etc. This is also volume weighting covariance.
This is not a directional indicator nor is moving covariance. This is used for forecasting volatility. This must be used in conjunction with moving covariance.
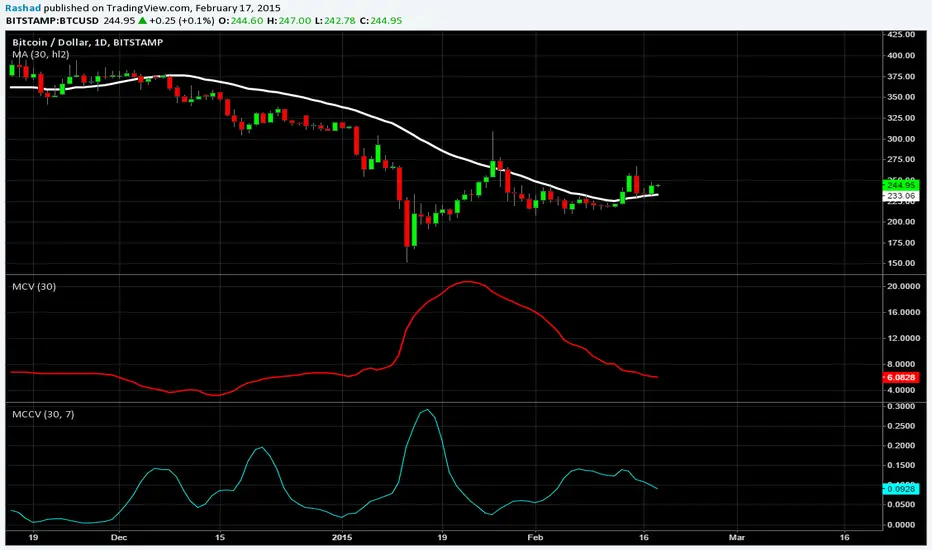
Moving CovarianceCo-variance is a representation of the average percent data points deviate from there mean. A standard calculation of Co-variance uses One standard Deviation. Using the empirical rule, we can assume that about 68.26% of Data points lie in this range.
The advantage to plotting co variance as a time series is that it will show you how volatility of a trailing period changes. Therefore trend lines and other methods of analysis such as Fibonacci retracements could be applied in order to generate volatility targets.
For the purpose of this indicator I have the mean using a vwma derived from vwap. This makes this measurement of co-variance more sensitive to changes in volume, likewise are more representative a change in volatility, thus giving this indicator a "leading aspect".
