[TTI] Price confirmation indicator📜 ––––HISTORY & CREDITS––––
The Price Confirmation Indicator is an innovative tool developed by TintinTrading to help his students learn to interpret Price + Volume moves. It is designed to provide traders with a visual cue for price movement confirmation based on both price direction and trading volume. I got the idea from watching Daivd Ryan, how he explains that he looks at volume first before looking at the price of a stock.
🦄 –––UNIQUENESS–––
What sets this indicator apart is its dual analysis approach and easy interpretation: it not only evaluates price movements but also takes trading volume into account. The indicator's color-coded bars are dynamically adjusted based on the volume difference from a 50-day Simple Moving Average (SMA) of the volume. This offers traders an intuitive way to gauge both the market's direction and its strength.
🛠️ ––––WHAT IT DOES––––
The Price Confirmation Indicator performs the following functions:
👉Price Movement: Determines whether each trading day is an 'Up Day' or a 'Down Day' based on the closing price.
👉Volume Analysis: Calculates the 50-day SMA of trading volume and identifies the volume difference in percentage terms.
👉Transparency Adjustment: Dynamically adjusts the transparency of colored bars based on the volume difference.
👉Bar Coloring: Colors the bars blue for 'Up Days' and purple for 'Down Days', with the transparency indicating the strength of the volume.
Transparency Tresholds:
Full color (no transparency 0%) - Volume is greater than 40% compared to the 50DSMA Volume
Strong color (little transparency 20%) - Volume is between 20% and 40% greater than the 50DSMA Volume
Noticable color (moderate transparency 40%) - Volume is between 0% and 20% greater than the 50DSMA Volume
Negligable color (strong transparency 60%) - Volume is light and is less than 50DSMA Volume with less than 20% lower.
Weak color (very strong transparency 80%) - Volume is below 50DSMA, with between 40% and 20% lower.
Very weak color (max transparency 90%) - Volume is below 50DSMA, with between -40% and -80% lower.
Alarming weak color (color is orange) - Volume is noticably light - this generally signals velocity contraction before a breakout.
💡 ––––HOW TO USE IT––––
Installation: Search for " Price Confirmation Indicator" in TradingView’s indicator library and add it to your chart.
Settings:
Price Up Color: Customize the color for 'Up Days'.
Price Down Color: Customize the color for 'Down Days'.
Interpretation:
Blue bars signify 'Up Days', and their transparency indicates the strength of the volume.
Purple bars represent 'Down Days', with transparency again indicating volume strength.
Orange bars signify extremely low volume days.
Volume Transparency: The less transparent the bar, the stronger the volume, aiding in confirming the price direction.
The indicator is a great tool for newer traders to get in the habit of reading Price & Volume together!
Tendência de Volume e Preço (PVT)

Daily Network Value to Transactions Signal (NVTS)
Quote of GlassNode ...
The NVT Signal (NVTS) is a modified version of the original NVT Ratio.
It uses a 90 day moving average of the daily transaction volume in the denominator instead of the raw daily transaction volume.
This moving average improves the ratio to better function as a leading indicator.
The Network Value to Transactions (NVT) Ratio is calculated by dividing the market cap by the transferred on-chain volume measured in USD.
GlassNode says the NVT Ratio was created by Willy Woo.
I have peaked into Glassnode and took their idea.
I also added a few more Moving Averages to select from, and the length can also be changed.
This script does not depend on Glassnode alone, instead I pulls data of several services...
CoinMarketCap
CoinMetrics
GlassNode
IntoTheBlock
Therefor we have more Tokens to select from.
I have also blocked some faulty data of each service.
If you get a study error of any kind then there is no data available,
or you on a wrong timeframe.
Best to use this script in a daily chart.
And keep in mind it pulls data of yesterday.
Therefor the plot is offset by 1 to the left.
The script will check each service if the data for the chart is available.
Market Cap is taken in the following order ...
CainMarketCap
GlassNode
CoinMetrics
Transaction volume as USD is taken in the following order ...
IntoTheBlock
CoinMetrics
GlassNode
Happy Trading!

Price by Volume ColumnsThis indicator allows you to identify how price changes for a given time period are sensitive to the volume. You will identify these changes as bars in the bottom of the chart. You may see the changes in bars for better understanding of price movements, identify trends. Please take trades at your own risk and discretion

ProfitAlgoOverview
ProfitAlgo is a powerful and intuitive trading tool specifically developed to cater to the requirements of both beginners and experienced traders. It is designed to function in every timeframe and on all cryptocurrencies, stocks, indices, forex, futures, currencies, ETF's, energy and commodities. This innovative tool provides real-time signals, comprehensive trend analysis, and advanced risk management features, making it an indispensable asset for traders of all levels. This cutting-edge tool generates 'BUY' and 'SELL' signals, complemented by an array of robust analytical tools. Empower your trading analysis with this all-in-one solution and add to your arsenal of indicators to make well-informed decisions.
This algorithm incorporates a sophisticated Fourier smoothing technique to effectively filter price data, reduce noise and reveal underlying patterns and trends. By utilizing multiple price series data and incorporating Price Volume Trend, it leverages volume analysis and price movement patterns. Furthermore, the algorithm employs relative and simple moving average calculations to enhance signal clarity and filter out outliers, resulting in a more refined and robust indicator.
Features
Buy/Sell signals: Visually illustrated by 'BUY' and 'SELL' labels, these signals provide indications to traders about optimal times to enter or exit positions in the market based on the particular asset they are trading. Traders may want to enter long positions when buy signals appear, and enter short positions when 'SELL' signals appear.
Stop Loss/Take Profit Levels: Stop loss and take profit levels are predefined price thresholds that allow traders to automatically exit trades to limit losses or secure profits, respectively. Stop loss and take profit levels are visually depicted through three dotted lines on the trading chart, including the entry price, take profit (TP), and stop loss (SL). Additionally, a table displays the corresponding price entries for all three levels, providing a comprehensive overview of the trade. Traders can effectively manage their risk and optimize their trading by implementing predefined threshold settings and establishing take profit levels, thus safeguarding their profits using a strategic approach.
Support and Resistance Levels: Support and resistance levels are key price levels in the market that act as barriers or turning points for the price movement of an asset. Traders utilize these levels to identify potential areas of buying and selling opportunities. These can be depicted as red (resistance) and green (support) horizontal lines. These levels can serve as valuable complements to stop/loss and take profit levels, providing confirmation for profit-taking opportunities and facilitating effective risk management. Moreover, they can synergistically work alongside the price lines to identify potential reversal zones by visualizing market highs/lows in conjunction with areas of supply & demand.
Moving Average Bands: Moving average bands, plotted alongside the price data, dynamically change color based on the prevailing trend, with red indicating a downtrend and green representing an uptrend. This visual tool provides valuable insights to users, allowing them to quickly identify and interpret market trends. Integrating Moving Average bands with our buy/sell signals offers added confidence in identifying market trends, enabling traders to seek validation and enhance their decision-making process.
Trend Table: The trend table provides real-time information on the current trend of an asset, displaying three distinct outputs: "Uptrend," "Downtrend," and "Ranging Trend." This valuable tool enables users to assess the live trend of an asset, which may differ from the buy/sell signals. The primary objective of this feature is to analyze real-time trends in both ranging and trending market conditions. While the current signal may indicate a 'BUY' signal, the table can present an alternative output, providing valuable insights for traders and investors.
Price Lines: Price lines are depicted as two parallel grey lines running alongside the price data, representing the highs and lows of the market. This visual tool is utilized to identify patterns of higher highs and lower lows, enabling traders to gain insights into the overall trend and potential reversals in the market. When used in conjunction with our signals, MA bands and trend table, it may reinforce your interpretation of the underlying trend as well as provide insights into the trend strength.
*Note: These features are customizable via the settings menu in TradingView.
Calculations
How are buy/sell signals calculated?
The buy and sell signals are generated through a comprehensive calculation process that encompasses various types of analysis techniques. With permission from the author, wbburgin's Fourier transform is utilized to filter and extract relevant information from the price data, removing noise from the signals (filter is only applied in this feature). The buy and sell conditions are calculated based on a combination of volume-based analysis, and price movement patterns, employed to assess the direction and strength of market trends. The combination aims to produce a comprehensive view of both volume-based and price-based market dynamics. By integrating these analysis techniques, traders can gain insights into the relationship between volume, price, and market trends. This combined approach, as well as Fourier smoothing, can help identify potential market reversals, confirm trend strength, produce less noisy data and provide additional confirmation signals for trading decisions. By considering the insights provided by this analysis, the algorithm determines the appropriate actions, signaling the opportunities to enter or exit positions in the market. In summary, these calculations aim to identify favorable trading opportunities by considering factors such as trend strength, volume dynamics, and price patterns, ultimately assisting traders in making well-informed decisions in the market.
How are stop/loss and take/profit levels calculated?
The stop loss and take profit levels are calculated using a combination of technical factors, including the Average True Range (ATR) and Exponential Moving Average (EMA). The rationale for this combination is to enable dynamic risk management and align profit targets with the prevailing market conditions; ATR provides a measure of volatility and risk, while EMA helps identify the underlying trend, allowing for effective stop-loss and take-profit placement. These indicators are utilized to gauge market volatility and determine suitable levels for managing risk and securing potential profits. By incorporating ATR and EMA calculations, the algorithm generates dynamic stop loss and take profit levels that adapt to market conditions.
Calculating support and resistance levels
These levels help identify areas where the price tends to find support (support levels) or encounter resistance (resistance levels). This script utilizes pivot point calculations to determine these significant price levels, which can assist traders in trading decisions regarding potential price reversals, trend continuations, and entry/exit points in their strategies.
What are the moving average bands based on?
The moving average bands, based on VWMA (Volume Weighted Moving Average) calculations using OHLC4 price data, are visualized as unique bands on the chart. VWMA bands are chosen to find trends because they effectively combine volume-weighted calculations with moving averages, providing valuable insights into the strength and direction of price movements. These bands dynamically change color to reflect the prevailing trend. In an uptrend, the bands are represented by a green color, while in a downtrend, they appear in red. The VWMA bands utilize a unique counting method to capture trend movements and potential reversals.
How is the Trend Table calculated?
The underlying trends in the trend table are calculated based on counting methods applied to the VWMA bands. It utilizes specific thresholds to determine different trends, such as "Up Trend," "Down Trend," and "Ranging Trend." These thresholds are used to assess the current trend of the asset and provide valuable insights for traders.
Price Lines Calculation
The price lines are calculated based on the price data. They represent the range of prices, with one line plotted above the closing price and another line plotted below it. The space between these lines is filled to visualize the price volatility. Traders can utilize these lines to identify significant price levels and observe the overall price movement.
Disclaimer:
The information provided in my indicators/strategies/systems is not intended as financial advice. I assume no responsibility for any losses or damages, including loss of profits, resulting from the use of or reliance on such information.
All investments carry risks, and past performance of a security, industry, sector, market, financial product, trading strategy, backtest, or individual's trading does not guarantee future results or returns. Investors bear full responsibility for their investment decisions, which should be based on their own evaluation of financial circumstances, investment objectives, risk tolerance, and liquidity requirements.
Please note that my indicators/strategies/systems are solely for educational purposes! DO NOT request access in the comment's section.

Volume Change Indicator 0.1 [PATREND]
(Volume Change Indicator)
It is an analytical tool that studies the trading volume and its changes.
This indicator uses the Simple Moving Average (SMA) to calculate the average volume for a specific period of time.
Only candles that meet the required conditions are determined when the trading volume is greater than or equal to the calculated average.
This means that the indicator identifies a volume candle only when there is a significant change in trading volume compared to the average.
This indicator is distinguished from other similar indicators in that it allows the user to determine the required percentage of change as an additional condition for determining the volume candle.
If the conditions are correct, the indicator will display a diamond below the candle that meets the requirements specified by the user.
The indicator also displays lines above and below the candle and places "A" and "B" marks next to them to determine the start and end points.
__________________________________
(Volume Change Indicator)
It is a useful analytical tool for traders who rely on volume analysis strategies in their trading decisions.
This indicator helps traders identify important volume candles and search for trading opportunities more accurately.
Traders can use this indicator to determine trends and search for potential entry and exit points.
The indicator helps determine when there is a significant change in trading volume compared to the average, indicating a possible change in direction.
In general
This indicator benefits traders who use volume analysis strategies in their trading decisions and who want additional information about trading volume and its changes.
It can also be used for all markets and on different time frames.
_________________________________
Settings:
1. The user is allowed to determine whether they want to display the indicator through the "Show Indicator" box.
2. The user is allowed to determine the required percentage of change through the "Percent Change" box.
3. The user is allowed to determine the type of candles they want to display (Bearish, Bullish, both) through the "Candle Type" box.
4. The user is allowed to calculate the average candle volume using the "Average Vol" box.
5. The user is allowed to determine the length of lines and number of lines they want to display through "Max Lines" and "Line Length" boxes.
_________________________________
We hope you find (Volume Change Indicator) useful in your analysis.
Feel free to try this indicator and customize its settings to meet your trading needs.
We look forward to seeing your opinions and comments on this indicator.
______________________________________________________________________________________________________
(Volume Change Indicator)
هو أداة تحليلية تعمل على دراسة حجم التداول وتغيراته.
يستخدم هذا المؤشر متوسط الحجم المتحرك (SMA) لحساب متوسط الحجم لفترة زمنية معينة.
يتم تحديد الشموع التي تلبي الشروط المطلوبة فقط عندما يكون حجم التداول أكبر من أو يساوي المتوسط المحسوب.
هذا يعني أن المؤشر يحدد شمعة الكميات فقط عندما يكون هناك تغير كبير في حجم التداول مقارنة بالمتوسط.
يتميز هذا المؤشر عن غيره من موشرات الممثاله بأنه يتيح للمستخدم تحديد النسبة المئوية المطلوبة للتغيير كشرط إضافي لتحديد شمعة الكميات.
إذا كانت الظروف صحيحة، فسيعرض المؤشر ماسًا أسفل الشمعة التي تلبي المتطلبات المحددة من قبل المستخدم.
كما يعرض المؤشر خطوطًا فوق وتحت الشمعة ويضع علامتي "A" و "B" بجانبهما لتحديد نقاط البداية والنهاية.
________________________________________
(Volume Change Indicator)
هو أداة تحليلية مفيدة للمتداولين الذين يعتمدون على استراتيجيات تحليل الحجم في قراراتهم التداولية.
يساعد هذا المؤشر المتداولين على تحديد شموع الكميات المهمة والبحث عن فرص تداولية بشكل أكثر دقة.
يمكن للمتداولين استخدام هذا المؤشر لتحديد الاتجاهات والبحث عن نقاط الإدخال والخروج المحتملة.
يساعد المؤشر على تحديد متى يكون هناك تغير كبير في حجم التداول مقارنة بالمتوسط، مما يشير إلى احتمالية حدوث تغير في الاتجاه.
In general
يستفيد من هذا المؤشر المتداولون الذين يستخدمون استراتيجيات تحليل الحجم في قراراتهم التداولية والذين يرغبون في الحصول على معلومات إضافية حول حجم التداول وتغيراته.
كما يمكن استخدامة لجميع الاسواق وعلى مختلف الفواصل الزمنية .
_________________________________________
Settings:
1. يُتيح للمستخدم تحديد ما إذا كان يرغب في عرض المؤشر من خلال خانة "Show Indicator".
2. يُتيح للمستخدم تحديد النسبة المئوية المطلوبة للتغير من خلال خانة "Percent Change".
3. يُتيح للمستخدم تحديد نوع الشموع التي يرغب في عرضها (Bearish, Bullish, both) من خلال خانة "Candle Type".
4. يُتيح للمستخدم حساب متوسط حجم الشموع باستخدام خانة "Average Vol".
5. يُتيح للمستخدم تحديد طول الخطوط وعدد الخطوط التي يرغب في عرضها من خلال خانات "Max Lines" و "Line Length".
_________________________________________
نأمل أن تجدواه مفيدًا في تحليلاتكم .
لا تترددوا في تجربة هذا المؤشر وتخصيص إعداداته لتلبية احتياجاتكم التداولية.
نتطلع إلى رؤية آرائكم وتعليقاتكم حول هذا المؤشر.

Ultimate Volume Custom ScreenerThis indicator will allow you to make your custom volume TradingView screener without coding. Add it to the chart, and select up to 40 symbols and up to five indicators. The screener will do the rest for you. The indicator will form a lovely table with all values and highlighted signals. It allows also to filter symbols based on the values of indicators and sends results as an alert.
The screener is highly customizable, and you can choose its position on the chart, sorting, order of the columns, colors for the tables, and all signals separately. You can easily change parameters for all supported indicators.
Supported indicators
Currently, there are 15 different custom indicators available. Current list of indicators:
Accumulation/Distribution (Acm/Dst)
Chaikin Money Flow (CMF)
Ease of Movement (EOM)
Klinger Oscillator (KO)
Money Flow Index (MFI)
Negative Volume Index (NVI)
On Balance Volume (OBV)
Positive Volume Index (PVI)
Price
Price-Volume Trend (PVT)
Volume
Volume MA (VMA)
Volume Percentile (V-Prct)
Volume RSI (V-RSI)
Volume Weighted Average Price (VWAP)
We're already working on adding a few more supported indicators. If you have any ideas about the indicators you want to see in our screener, contact us, and we'll consider them.
Filters
You can combine up to 5 filters on all selected indicators.
This will split the screen table into two parts. The top one will contain symbols that satisfy all conditions:
Alerts
You can also create an alert and receive a filtered symbol at the end of every bar.
Disclaimer
Please remember that past performance may not be indicative of future results.
Due to various factors, including changing market conditions, the strategy may no longer perform as well as in historical backtesting.
This post and the script don’t provide any financial advice.

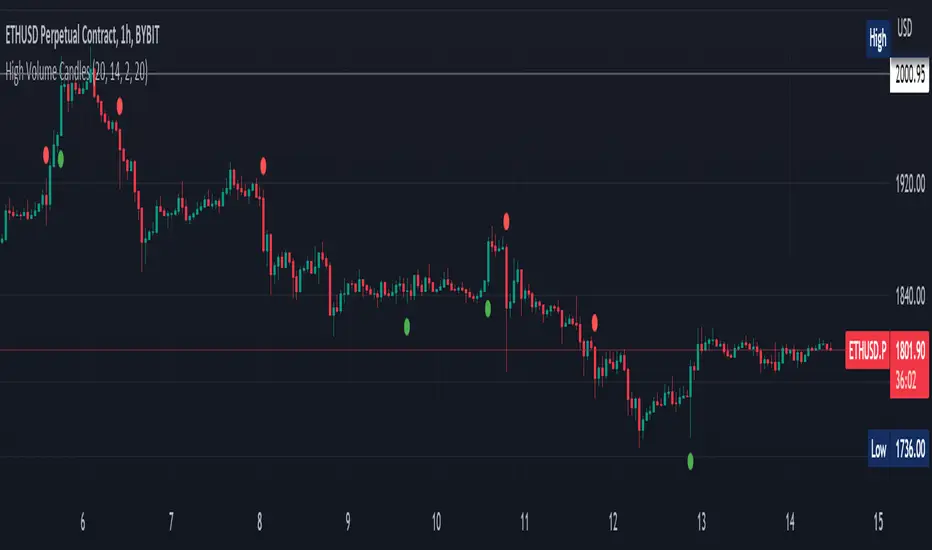
High Volume Candles Detector - Open Source CodeGreetings, fellow traders!
Throughout my trading career, I've been intrigued by the dynamic interplay between candlestick patterns and trading volume. This fascination led me to develop an open-source indicator to help illuminate these patterns for the broader trading community.
Upon researching the Public Library, I found that many indicators relating to candlestick/volume analysis are proprietary and not open-source. This discovery further fueled my commitment to contribute a free, accessible tool that traders of all levels can utilize in their technical analysis.
Thus, I am excited to present to you our High Volume Bars Indicator. A unique tool that I believe fills a gap in the Public Library. I truly hope you find it beneficial in your trading journey and that it empowers you to make more informed decisions.
Description:
The High Volume Bars Detector is designed to help traders identify bars with significantly higher volume than the average. Users can filter in the settings menu:
1) The length of the Simple Moving Average (SMA) for volume, allowing you to define the average volume over a specific number of bars.
2) The Volume Multiplier, a factor that determines how much greater the volume of a bar should be compared to the SMA to qualify as a high-volume bar.
3) The Lookback Period, a specified number of candles used as a comparative benchmark for identifying the highest volume.
4) If the Volume bar is green or red, so if the candle price is --> close > open or open > close
Examples to better understand the logic of the indicator:
1) Length of the Simple Moving Average (SMA) for Volume: This setting allows you to define the average volume over a specific number of bars. For instance, if you set the SMA length to 20, the indicator will calculate the average volume of the past 20 bars and use it as a baseline to identify high volume bars.
2) Volume Multiplier: This is a critical factor that determines the threshold for what constitutes a high-volume bar. If you set the volume multiplier to 2.0, for example, the indicator will flag any bar where the volume is twice the value of the SMA volume as a high-volume bar.
3) Lookback Period: This setting lets you specify the number of candles that the indicator should consider when determining the highest volume. For instance, if the lookback period is set to 14, the indicator will compare the volume of the current bar with the volumes of the previous 14 bars. If the current bar's volume is the highest, it will be flagged.
4) Volume Bar Color: This filter helps you identify whether a high-volume bar is bullish or bearish. If the bar is green (close > open), it suggests buyers were dominant during that period. If the bar is red (open > close), it suggests sellers had the upper hand. By setting this filter, you can choose to focus on high volume bars that are either bullish (green) or bearish (red) or both, depending on your trading strategy.
Remember, these filters offer a level of customization that allows you to tailor the High Volume Bars Detector to your unique trading style and requirements. Always remember to adapt these settings to align with your overall trading plan and risk tolerance.
Keep attention!
It is important to note that no trading indicator or strategy is foolproof, and there is always a risk of losses in trading. While this indicator may provide useful information for making conclusions, it should not be used as the sole basis for making trading decisions. Traders should always use proper risk management techniques and consider multiple factors when making trading decisions.
Support me:)
If you find this new indicator helpful in your trading analysis, I would greatly appreciate your support! Please consider giving it a like, leaving feedback, or sharing it with your trading network. Your engagement will not only help me improve this tool but will also help other traders discover it and benefit from its features. Thank you for your support!
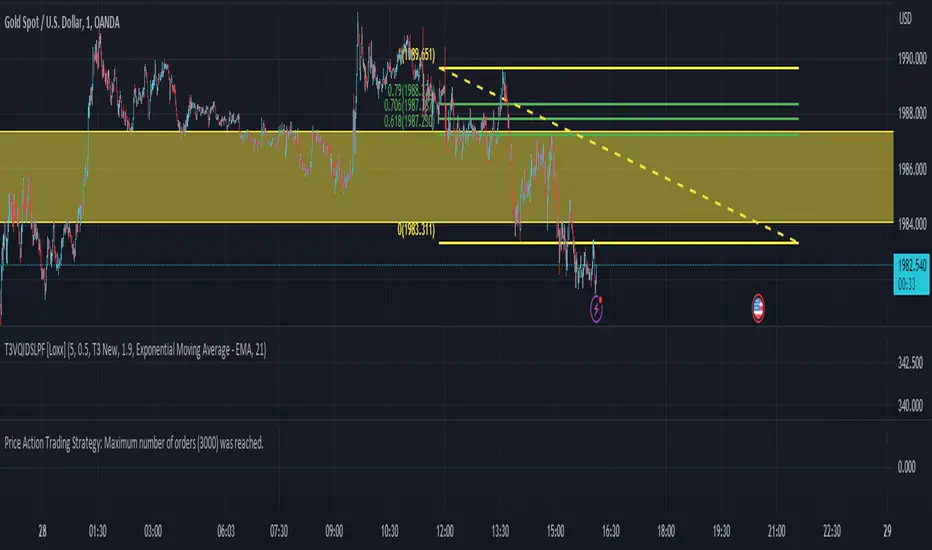
Price Action Trading StrategyIn this strategy, we define the high and low of the previous candle, and then check whether the current candle's high or low is higher or lower than the previous candle's high or low, respectively. If there's a new high, we enter a long position, and if there's a new low, we enter a short position. We also set exit conditions to close the position if the price drops below the previous low or rises above the previous high.
Please note that this is a simple example and should not be used as a standalone trading strategy. It is important to conduct thorough backtesting and consider other factors such as risk management before implementing any trading strategy.
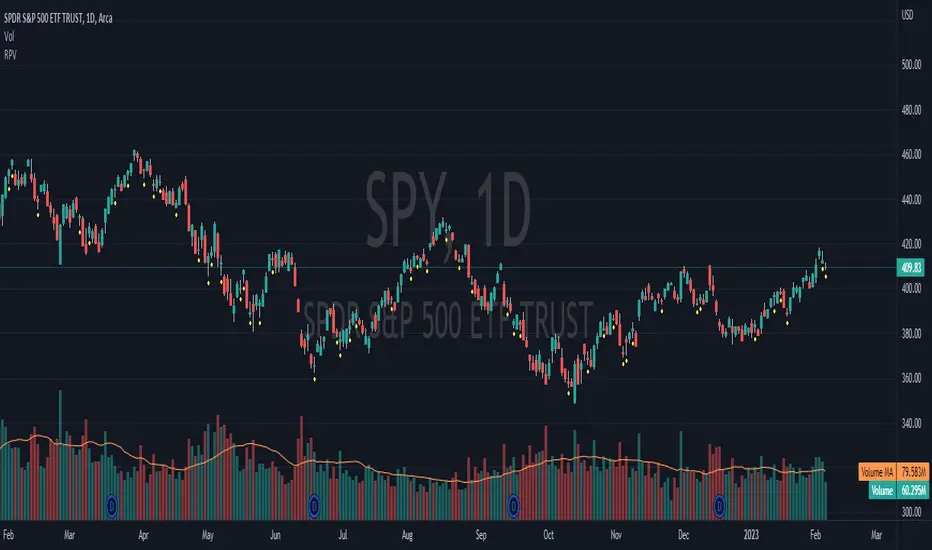
Relative Price Volume
Relative Price Volume is an indicator which shows anomalies between price and volume on a chart over a given period. The goal is to identify potential reversal and/consolidation areas for price as it relates to volume. It is a simple variation of a Volume at Price indicators. It can also be used to mark potential support and resistance lines on the chart as the areas it signals is where the price battles are waged.
Settings:
Period = length for which to calculate average candle body and average volume
Long Factor = relative size multiplier to determine if a candle is larger than average or if volume is higher than average
Short Factor = relative size multiplier to determine if a candle is smaller than average or if volume is lower than average
Anomaly Conditions
1. If a candle is larger than average and volume is lower than average, then this is an anomaly, and we should be on alert for a change in momentum.
2. if a candle is smaller than average and volume is higher than average, then this too is an anomaly and should put us on alert.
The indicator will draw a cross on the chart indicating the candle is that is flashing the warning that the run is done and a potential consolidation and/or reversal is pending. Used in conjunction with support and resistance levels this could signal a time to enter or exit a trade.
The default size factors considers a candle or volume:
1. Larger than average if it is 60% or more (.6) larger than average.
2. Smaller than average if it is 40% or less (.4) smaller than average.
Hope this helps! Happy trading!
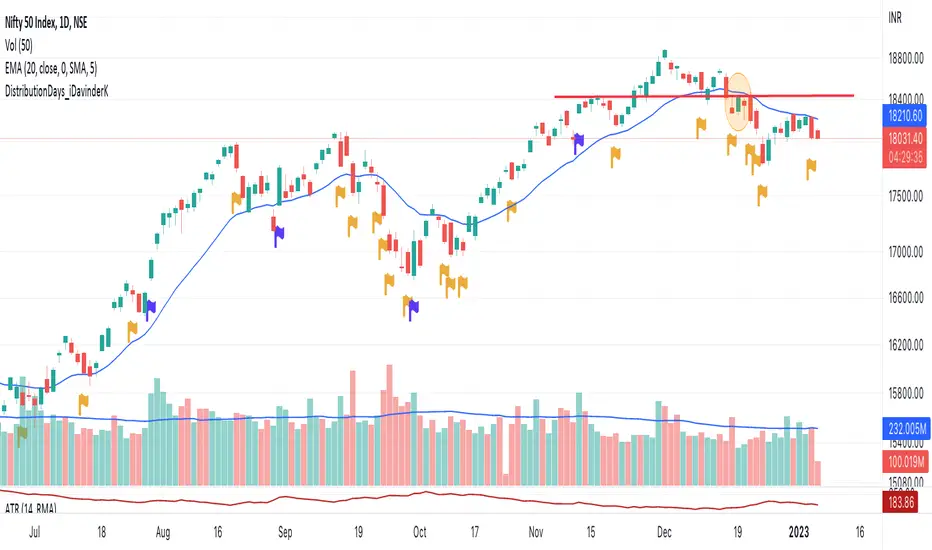
DistributionDays_FTD_iDavinderKThis script identifies the distribution days and follow through day.
DD count helps a trader identify a general trend of the market. A distribution day is flagged when index drops more than 0.2% and above average vols than previous day. 4 or more distribution days shows choppiness in the market and longs are unlikely to work.
A follow through day on the other hand shows strong buying emerges from the bottom. An FTD is flagged when index moves up 1.5% or more on higher vols than previous day.
Once an FTD is seen DD count goes back to zero.
DD are shown as Yellow flag here.
FTD are shown as Blue flag,
ICT - GAPs and Volume Imbalance
GAPs
Gaps are areas on chart where the price have moved sharply up or down, with no trading in between. Gaps often fill, but they don't have to.
Volume Imbalance
Volume imbalance - determined using 2 candles
Bullish Volume Imbalance - area between the close of 1st candle and the open of 2nd candle
Bearish Volume Imbalance - area between the close of 1st candle and the open of 2nd candle
How to use the indicator:-
When you find imbalance in volume or a GAP in the chart, you may expect price to rebalance it before continuation.
Importantly, GAPs/Imbalances do not always fill. Traders should never assume that a gap/imbalance will fill without understanding the reasons for the gap and monitoring trading activity around the gap.
Pair it with your current bias for better results.

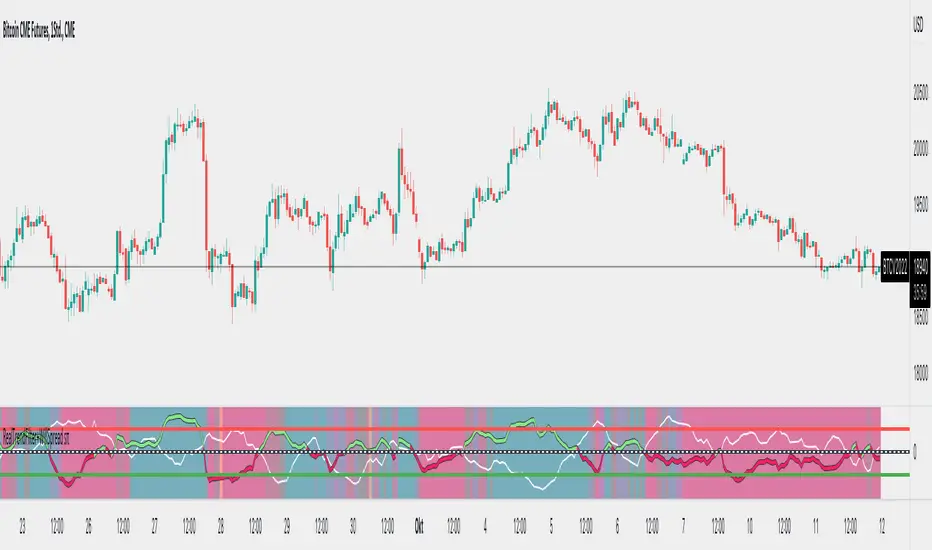
WillSpreadIntermarket + Williams Spread + POIV + ADVolumen sπThe Indicator is a combination of different types of measurements to the Price Action.
1.1 RSI Contra Input like Dollar Index (white Line)
1.2 RSI (colored line)
If you switch off 1.1. and 1.2. you can use the Willspread, POIV or AD Volume as a Indicator
2. The WillSpread is set to measure your Symbol to another chosen Market like Dollar as Contra . But you can switch also between different markets.
2. Accumulation/Distribution with True Range of High or Low including OpenInterest. This only works with Futures .
--Energies, Metals, Bonds, Softs, Currencies, Livestock, live cattle , feeder cattle, lean hogs , index--
Open Interest for:
ZW, ZC , ZS, ZM, ZL, ZO, ZR, CL , RB, HO, NG , GC , SI, HG, PA, PL, ZN, ZB, ZT, ZF, CC , CT , KC, SB , JO, LB , AUDUSD , GBPUSD , USDCAD , EURUSD , USDJPY , USDCHF , USDMXN , NZDUSD , USDRUB , DX , BTC , ETH, LE, GF , HE, NQ, NDX, ES, SPX , RTY, VIX ,
3. Accumulation/Distribution with True Range of High or Low including Volume .
4. The color shows if the Market has positive or negative (RSI, Willspread, Volume or Open Interest)
5. The Indicator also shows Divergences to Price and RSI or Willspread Movements.
If you want to have more information just give me a message.
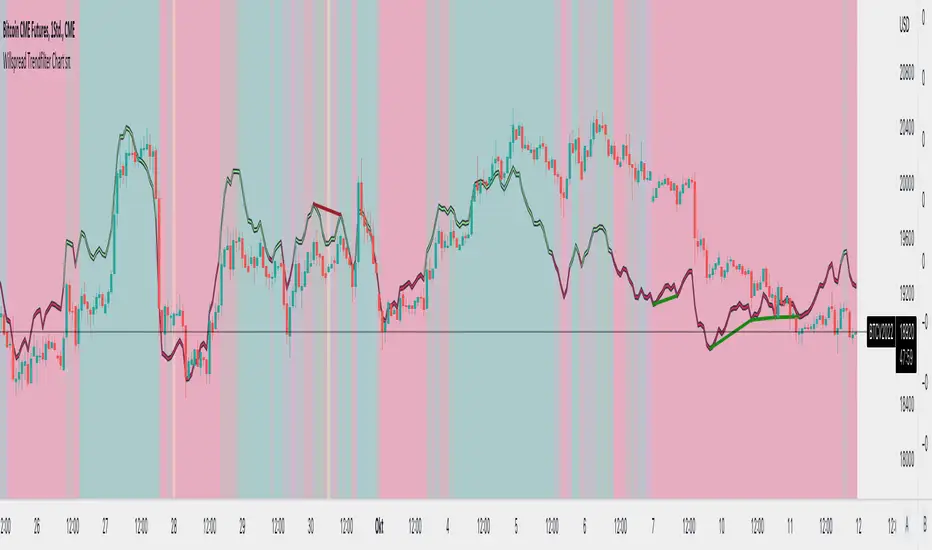
Willspread Chart + POIV & ADVolumen TrendColor sπThe Indicator is a combination of different types of measurements to the Price Action.
1. Spread: The Spread is set to measure your Symbol to another chosen Market like Dollar as Contra . But you can switch also between different markets.
2. Accumulation/Distribution with True Range of High or Low including OpenInterest. This only works with Futures .
--Energies, Metals, Bonds, Softs, Currencies, Livestock, live cattle , feeder cattle, lean hogs , index--
Open Interest for:
ZW, ZC, ZS, ZM, ZL, ZO, ZR, CL, RB, HO, NG, GC, SI, HG, PA, PL, ZN, ZB, ZT, ZF, CC, CT, KC, SB, JO, LB, AUDUSD, GBPUSD, USDCAD, EURUSD, USDJPY, USDCHF, USDMXN, NZDUSD, USDRUB, DX, BTC, ETH, LE, GF, HE, NQ, NDX, ES, SPX, RTY, VIX,
3. Accumulation/Distribution with True Range of High or Low including Volume .
4. The color shows if the Market has positive or negative (Willspread, Volume or Open Interest)
5. The Indicator also shows Divergences to Price and Willspread Movements.
If you want to have more information just give me a message.
Volume+Price Action Alert by Eciujust the update scipt with white text to the markers so it works with dark mode

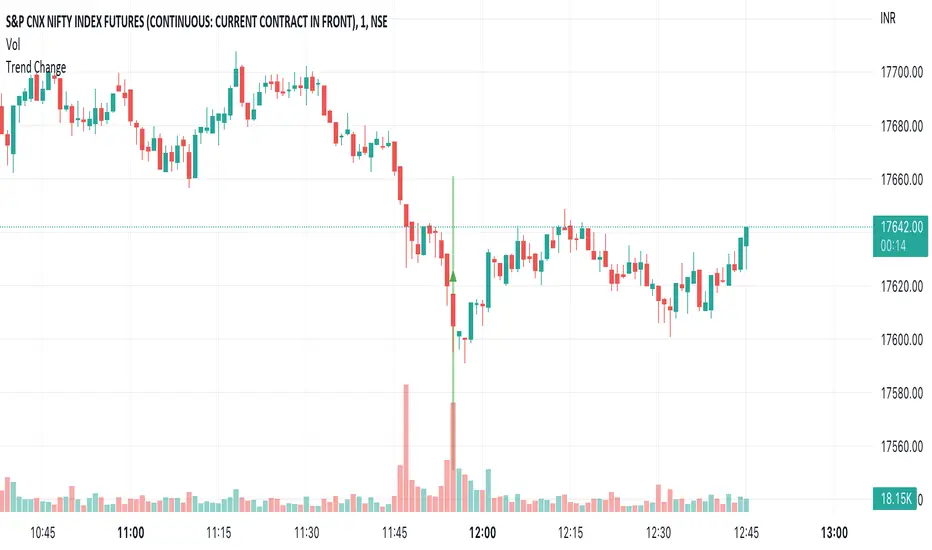
Trend ChangeThis indicator displays a general trend change. It shows an arrow on the candle from where the trend change is expected.
The trend change is calculated based on the previous candle open/close and the corresponding volume.
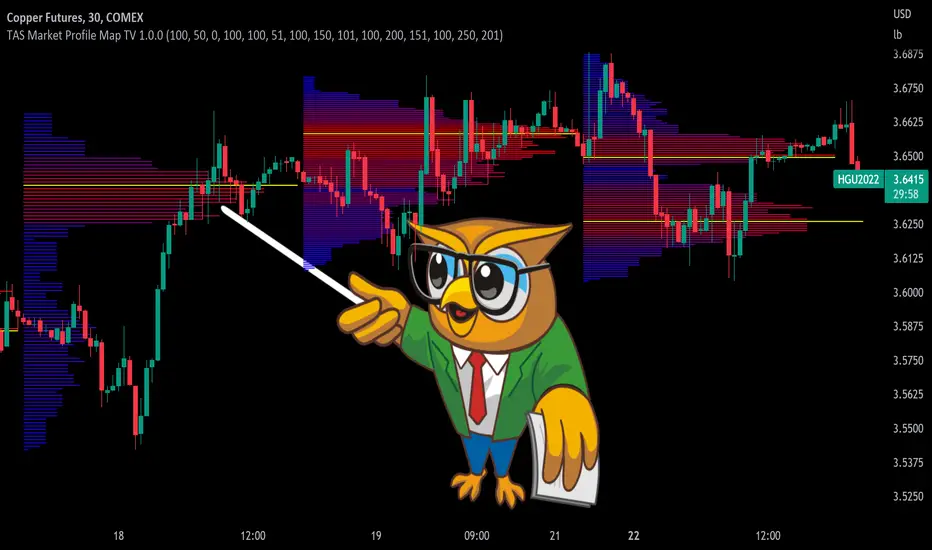
TAS Market Profile Map [TASMarketProfile]TAS Market Profile Map (aka “ TAS Market Map ”) displays volume accumulation at price using our attractive color-coded sideways histogram overlaid onto the price data pane. Hunt for high reward-to-risk opportunities with our favorite “Alligator Jaws” chart pattern setup that reveals significant volume gaps and actionable signals. TAS Market Map can paint up to 5 Maps simultaneously across time windows customized by the user.
TAS Market Map has 4 distinct colored lines:
RED ZONE – Designates an area where there are many market participants willing to transact. This zone of red lines grouped together is known as the “value area” and contains approximately 70% of the volume transacted in that particular section of the price map within the overall Market Map.
YELLOW LINE – Each TAS Market Map will contain at least one yellow horizontal line. This line is called the “Point of Control” (POC) and it represents the price where the most executions have occurred. In the case of multiple yellow POC lines, the one that extends closest to the price axis is considered the “Master Point of Control.”
PURPLE ZONE – Represents an area where there are less people willing to transact and is referred to as being “outside of value.”
BLUE ZONE – Designates areas where there is little interest on the part of commercial or institutional professionals to transact. When these areas occur on the perimeters of the TAS Market Map, they are referred to as “runaway gaps” or “rejection tails.”
∟ THE ALLIGATOR JAWS CHART PATTERN:
A popular chart pattern utilizing TAS Market Map is called the “Alligator Jaws” setup. Due to its unmistakable appearance similar to the side profile of an alligator with its mouth open, this chart pattern seeks to exploit when there are two significant Points of Control (yellow lines) with a large volume gap in between. Enter the trade as the market breaks outside of the value area (red zone) in the direction of the volume gap (inside the open jaws), place a stop loss on the other side of the Point of Control and preferably also across the value area (red zone). Seek to take profits at either 50% of the way through the volume gap or a more optimistic target just ahead of entering the opposing jawline (red zone value area). This trading technique can be applied to both long and short side entries.
Below you will find a couple examples of this chart pattern.
∟ INPUT SETTINGS:
By default, three TAS Market Maps will appear. You can activate the 4th and 5th Market Maps easily by checking the boxes in the Input settings. TAS Market Map updates automatically at the close of each bar after it has calculated all of the volume from the closed bar in addition to the completed OHLC data (Open, High, Low, Close). This happens in a matter of seconds at each bar close. The analysis is not static, but rather a rolling period of analysis at each bar close.
THERE ARE 3 SETTINGS FOR EACH MARKET MAP :
>>> # of Lines – This represents how many horizontal lines you want to comprise the Market Map so it generates a transparency customization. The default is 50 lines. If you increase the number to, for example 100, then the Market Map will appear more prominent and less transparent on the chart. Similarly, a lower input setting would remove lines and make it more transparent.
>>> BarStart – This setting dictates the starting point for that particular Market Map analysis based on the number of bars from the current bar. The default is 50 bars so this means the start of the 1st Market Map begins 50 bars from the present. At the close of each new bar, the analysis rolls to the most recent 50 bars automatically. Therefore a setting of 100 would start the analysis based on the most recent rolling 100 most recent bars.
>>> BarStop – This setting dictates the end point for the analysis of that particular Market Map. By default, the 1st Market Map will have a 0 which means it runs analysis through to the most recent bar.
OTHER NOTES ABOUT SETTINGS:
You’ll notice that by default the input settings for BarStart and BarStop for all 5 of the Market Maps are set to 50 bar increments and don’t overlap. For example the StopBar of Market Map #2 is 51, whereas the StartBar for Market Map #1 begins at 50. It is best practice to have consistency regarding the number of bars from the start and stop of the analysis.
Although not as popular, if you want to flip the orientation of the Market Map to paint from right to left instead of the default left to right, simply change the StartBar to 0 and StopBar to 50 and you’ll achieve this preference.
∟ INTERPRETATION AND RULES:
When the market is inside the red zone “value area” of the Market Map, it tends to move sideways within the range of the zone. Therefore you can look to enter trades near the top and bottom of the red zones with potential exits near the POC (yellow line) or opposing side of the red zone value area.
When price does break and close outside the value area zone, then the value area zone becomes new support or resistance and this can be leveraged for trailing stops. The most aggressive trailing stop would be after the market has penetrated into open space away from the value area, moving the stop to just back inside the value area. This would significantly reduce the trade risk.
The use of multiple Market Maps allows the trader to anticipate upcoming areas of support and resistance when the market moves beyond the scope of the current 1st Market Map. Historical Market Maps provide valuable information regarding where commercial interest existed in the past and likely to revisit in the future.
When multiple Market Maps form and the value areas align or overlap across their respective different time windows, these tend to be significant attraction zones for the market and a trader can expect sideway trading within the red value areas zones. Prudent trading is to observe the market conditions present and you the trader must adapt your trading mode to match, or not trade at all. In other words, you must trade the range during times when the market is in the value area zones and trade breakout when confirmed moves occur outside the value area zones.
In the case of a Market Map that develops “multiple distribution” areas (i.e. multiple developed value areas within Market Map), we anticipate a trending move
with price continuing in the direction the value areas are forming in relation to one another and in relation to the direction multiple Market Maps are forming.
Example of multiple Market Maps forming lower and revealing the bearish market trend:
Trade Well My Friends,
BOSS SAHAM
The script uses Volume and upgraded support and resistance as major trend identification .
Flag Icon as an indication of 52 weeks high
The indicator detects immediate change of trend and immediately opens position for the major trend.
User can enjoy in all types of financial market (One way market only)
More volatility in the market will be much better as it detects changes immediately

Crodl Pump & DumpThe reason why this indicator is called Pump and Dump is because it is based on volume.
The indicator focuses on volume levels to see if there is an increase in volume before deciding if it is worth entering a Position.
Long example = This will use ATR and price averages to trend Bullish and once the trend favours the upside it will then look at the Volume candles and if a candle is bigger then the average volume and the trend (ATR) is above a certain level it will then Give us a long entry if those conditions are true. We can have more than one long after one another since it will give us a position every-time the conditions are true and after TP(take profit) 1 or a Stop Loss was hit.
Short example = If the trend based on average price is trending downwards and we can see an increase of volume it will wait till we break a certain level breaks when we get the average price from the highs and Lows, then once the trend has met the bearish conditions it will wait for increase in volume and trigger a Sell. The sell will close once TP(take profit) 1 or a Stop Loss is hit.
In the inputs you can adjust the MA (moving average length. This helps to decide if the Trend is bearish or bullish. Higher moving averages will give you less entries and a lower moving average will give you more entries ,since price crosses lower MA's more it will change the trend more often.
Sensitivity is a divider of the MA values is so the higher the Sensitivity the lower the more trades you get since the trend is changing faster.
You will see that there is a backtesting panel on your chart when you look in the inputs there will be a statistics tab which will have 1. Simple 2. Mobile 3. Hide options
1. Simple is designed when you are using a PC or Laptop
2.Can be used when you are using your mobile it will show less data but won't be in your way
3.This will hide the backtesting panel on your screen.
Exit strategy.
there are 3 Types of exits for this indicator.
1 .CrodlExit which is ATR indicator based Exit with a divider.
2 . fIxed SL , this works in % so 1 = 1% market move.
3 .Reverse exits = Longs exit shorts and shorts exit longs.
there are 4 take profit targets and all of them are adjustable.
1= 0.5% by default
2=1% by default
3=1.5% by default
4=2% by default
on the Back tester you will find the following information :
Timeframe of your chart and then the Symbol or pair you are trading.
First trade = when the back tester starts to read data.
Total trade = Total buy and total sell signals and then total trades are buy + sell signals.
total win = total buys hit take profit 1 and total sells that hit take profit 1 and then total buy + total sells that hit take profit 1.
total loss = total buys that hit which ever exit mode you selected in the inputs by default it is crodl exit and total sells that hit which ever exit mode you selected in the inputs by default it is crodl exit and then you will get total buy losses + total sell losses to get total loss.
TP1= the % difference between total trades won and lost for the 1st take profit target and your stop loss method you chose.
TP2= the % difference between total trades won and lost for the 2nd take profit target and your stop loss method you chose.
TP3= the % difference between total trades won and lost for the 3rd take profit target and your stop loss method you chose.
TP4= the % difference between total trades won and lost for the 4th take profit target and your stop loss method you chose.
average win streak give you the average of how many winning trades you had every time before hitting a stop loss.
average loss streak is how many stop loss you hit on average before take profit one has been reached.
longest win streak give you the amount of winning trades you had without hitting a stop lossl that is selected in your inputs.
longest loss streak give you the amount of losing trades you had one after the other before hitting take profit 1.

Point of Control V2 The genesis of this project was to create a POC library that would be available to deliver volume profile information via pine to other scripts of indicators and strategies.
This is a republish of an invite only script to open access
This is the indicator version of the library function.
A few points of significance:
- Allows the choice of reset of the study period, day/week or bars. This is simple enough to expand to other conditions
- Bar count resets starting from the beginning of the data set (bar index =0) vs bars back from the end of the data set
- A 'period' in this context is the time between resets - the start of the POC (eg. start of Day or Week) until it resets (for example at the beginning of a next day or week)
- Automates the determination of the increment level rather than the user specifying ticks or price brackets
- Does not allow for setting the # of rows and then calculating the implied price increment levels
- When a period is complete it is often useful to look back at the POCs of historical periods, or extend them forward.
- This script will find the historical POCs around the current price and display them rather than extend all the historical POC lines to the right
- This script also looks across all the period POCs and identifies the master POC or what I call the Grand POC, and also the next 3 runner up POCs
This indicator is also available as a library.
BINANCE:BTCUSDT NSE:NIFTY OANDA:XAUUSD NASDAQ:AAPL TVC:USOIL

Volume Trend Meter LTFA new take to an already popular indicator of mine, now with lower time frame support for a volume called Volume Trend Meter LTF (VTML).
The VTM LTF indicator measures the volume pressure at a specific part of the candle (Start, Middle, or the end of the candle) and displays it as a histogram.
This indicator sums up all green candle volumes and red candle volumes over the selected part of the candle (Select in settings - start end or middle) and plots their values by subtracting increasing volume and decreasing volume.
Use this indicator to identify increasing volume with the green candles (close bigger than open) and increasing volume of the red candles (close is smaller than open).
Can also work on daily charts and higher.
======= Calculation ==========
For Green Column: The total Volume of green candles is higher than the total red candle volume.
For Red Column: The total Volume of red candles is higher than the total green candle volume.
======= Volume Trend Meter LTF Colors =======
Green: Increasing buying pressure.
Red: Increasing selling pressure.
My original VTM (not the lower time frame version):
Like if you like and Follow me for upcoming indicators/strategies: www.tradingview.com

Magnifying Glass (LTF Candles) by SiddWolf█ OVERVIEW
This indicator displays The Lower TimeFrame Candles in current chart, Like Zooming in on the Candle to see it's Lower TimeFrame Structure. It plots intrabar OHLC data inside a Label along with the volume structure of LTF candle in an eloquent format.
█ QUICK GUIDE
Just apply it to the chart, Hover the mouse on the Label and ta-da you have a Lower Timeframe OHLC candles on your screen. Move the indicator to the top and shrink it all the way up, because all the useful data is inside the label.
Inside the label: The OHLC ltf candles are pretty straightforward. Volume strength of ltf candles is shown at bottom and Volume Profile on the left. Read the Details below for more information.
In the settings, you will find the option to change the UI and can play around with Lower TimeFrame Settings.
█ DETAILS
First of all, I would like to thank the @TradingView team for providing the function to get access to the lower timeframe data. It is because of them that this magical indicator came into existence.
Magnifying Glass indicator displays a Candle's Lower TimeFrame data in Higher timeframe chart. It displays the LTF candles inside a label. It also shows the Volume structure of the lower timeframe candles. Range percentage shown at the bottom is the percentage change between high and low of the current timeframe candle. LTF candle's timeframe is also shown at the bottom on the label.
This indicator is gonna be most useful to the price action traders, which is like every profitable trader.
How this indicator works:
I didn't find any better way to display ltf candles other than labels. Labels are not build for such a complex behaviour, it's a workaround to display this important information.
It gets the lower timeframe information of the candle and uses emojis to display information. The area that is shown, is the range of the current timeframe candle. Range is a difference between high and low of the candle. Range percentage is also shown at the bottom in the label.
I've divided the range area into 20 parts because there are limitation to display data in the labels. Then the code checks out, in what area does the ltf candle body or wick lies, then displays the information using emojis.
The code uses matrix elements for each block and relies heavily on string manipulation. But what I've found most difficult, is managing to fit everything correctly and beautifully so that the view doesn't break.
Volume Structure:
Strength of the Lower TimeFrame Candles is shown at the bottom inside the label. The Higher Volume is shown with the dark shade color and Lower Volume is shown with the light shade. The volume of candles are also ranked, with 1 being the highest volume, so you can see which candle have the maximum to minimum volume. This is pretty important to make a price action analysis of the lower timeframe candles.
Inside the label on the left side you will see the volume profile. As the volume on the bottom shows the strength of each ltf candles, Volume profile on the left shows strength in a particular zone. The Darker the color, the higher the volume in the zone. The Highest volume on the left represents Point of Control (Volume Profile POC) of the candle.
Lower TimeFrame Settings:
There is a limitation for the lowest timeframe you can show for a chart, because there is only so much data you can fit inside a label. A label can show upto 20 blocks of emojis (candle blocks) per row. Magnifying Glass utilizes this behaviour of labels. 16 blocks are used to display ltf candles, 1 for volume profile and two for Open and Close Highlighter.
So for any chart timeframe, ltf candles can be 16th part of htf candle. So 4 hours chart can show as low as 15 minutes of ltf data. I didn't provide the open settings for changing the lower timeframe, as it would give errors in a lot of ways. You can change the timeframe for each chart time from the settings provided.
Limitations:
Like I mentioned earlier, this indicator is a workaround to display ltf candles inside a label. This indicator does not work well on smaller screens. So if you are not able to see the label, zoom out on your browser a bit. Move the indicator to either top or bottom of all indicators and shrink it's space because all details are inside the label.
█ How I use MAGNIFYING GLASS:
This indicator provides you an edge, on top of your existing trading strategy. How you use Magnifying Glass is entirely dependent on your strategy.
I use this indicator to get a broad picture, before getting into a trade. For example I see a Doji or Engulfing or any other famous candlestick pattern on important levels, I hover the mouse on Magnifying Glass, to look for the price action the ltf candles have been through, to make that pattern. I also use it with my "Wick Pressure" indicator, to check price action at wick zones. Whenever I see price touching important supply and demand zones, I check last few candles to read chart like a beautiful price action story.
Also volume is pretty important too. This is what makes Magnifying Glass even better than actual lower timeframe candles. The increasing volume along with up/down trend price shows upward/downward momentum. The sudden burst (peak) in the volume suggests volume climax.
Volume profile on the left can be interpreted as the strength/weakness zones inside a candle. The low volume in a price zone suggests weakness and High volume suggests strength. The Highest volume on the left act as POC for that candle.
Before making any trade, I read the structure of last three or four candles to get the complete price action picture.
█ Conclusion
Magnifying Glass is a well crafted indicator that can be used to track lower timeframe price action. This indicator gives you an edge with the Multi Timeframe Analysis, which I believe is the most important aspect of profitable trading.
~ @SiddWolf

Volume Risk Avoidance IndicatorPrice Pattern Analysis is the core of trading. But price patterns often fails.
VRAI (Volume Risk Avoidance Indicator) shows Volume Pressure, so that you can avoid volume-based risks.
For example, never short when you see green (buying pressure). Never long when you see red (selling pressure).
You still need to pick good price patterns, because the crossover of volume pressure is not reliable.
Enjoy!

Money Flow LineWhat is this? The Money Flow Line (MFL) indicator is at its core a more even-tempered version of the Price-Volume-Trend (PVT). The primary difference is the usage of `hlc3` ((high + low + close) / 3) rather than `close` to use the "typical price" that it critical to the calculation of the Money Flow Index (MFI). Other similar indicators include the Accumulation Distribution Line (ADL) and the On Balance Volume (OBV) indicators. The purpose of all of these indicators is to attempt to measure the strength of the money flow by combining price and volume into a rolling measurement that can be compared over time to look for confirmations and divergences.
The indicator also includes an optional averaging (smoothing) line that can be enabled in the display settings. Enabling this smoothing line with a desired period allows for simpler trend comparisons and also allows the user to view how far the line has diverged from the mean. This creates an indicator very similar to Elder's Force Index (EFI), which is also a `close * volume` style indicator.
Why is this important? After an extreme movement or volume spike the MFI will "snap back" sharply as that bar eventually exits the set period. This produces a result that is meaningless and skews the indicator away from the market structure. Because of this behavior, range clamping, and the loss of comparative history I prefer to shy away from oscillator style indicators. The Money Flow Line instead gives you all of the history so you may compare and see the broader trend without sharp snaps in history based on an arbitrary period setting.
Why is this better? This produces a no-lag indicator that isn't subject to the harsh skewing produced by they Money Flow Index's period calculation. It doesn't lose history like MFI or EFI, is clear about the trend direction, and prefers a "typical price" (averaging the entire range of each bar) rather than whatever happens to be the closing price for a given bar.
How can I use it? The indicator is attempting to measure supply and demand in the markets. No indicator is perfect, but we can use all of the information we have available to make our best predictions. There are only 3 pieces of data the market gives us:
1. Price (action)
2. Volume
3. Time
The Money Flow Line combines all of these data points into a readable rolling data set that attempts to show subtle balance of power shifts based on changes in volume and "smart money" (or "big money") stepping in and out of the picture. Much like PVT, we look for the same things:
- Trend Identification: an up or down trend appears in the MFL
- Confirmations: the MFL agrees with price action in direction and magnitude
- Divergence: the MFL disagrees with price action, indicating a reversal may be coming soon
When applying the smoothing line we can also look for similar things we would with EFI. The primary case would be to look for the MFL to jump very far away from the mean (a high magnitude movement) which indicates that price may be reverting towards the mean soon (a "mean reversion"). On the other hand, it may indicate strength in the current price direction. All of these predictions depend heavily on price action and market structure. Good luck!
