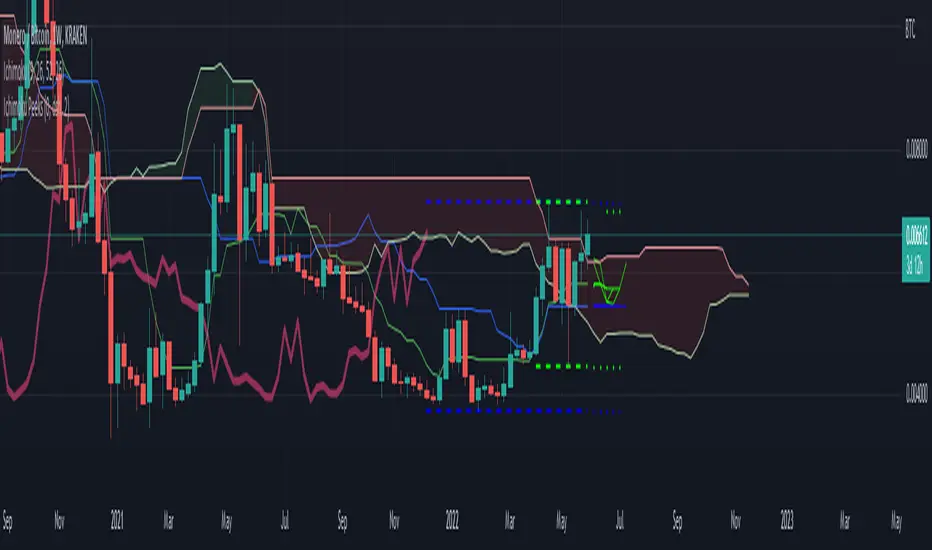
High and Low PredictorWhat can I Do:
Update at 12:01 AM everyday.
Predict the Highest and the Lowest price of each day.
Color of the lines: the red color suggests downward while the green color suggests upward.
It is able to predict the highest and the lowest price of each day by calculating the history prices,
but please notice this is only prediction! Not one hundred percent correct!
The data suggests chances to buy and to sell, and the history data is also available for review.
If the switch of resistance is turned on, the resistance will be displayed on the chart directly for reference.
How to use it?
First, choose the period of 60 minutes/1 hour,
Second, add alerts, when price hits the predicted prices, it will send you alert alarm.
Prediction

Price & Time SquaredHi Traders..
This is one of Gann's trading method, called Price & Time Squared. When price & time meets, price will reverse."
as you see, those lines (past & future) represent the forecast of 'potential' swing (swing high/low or turning up/ down)
here are some examples:
Weekly
Daily
H1
M30
M15
M5
How to trade (very simple):
- if the trend is down and tomorrow there is a 'Price & Time Squared Line', we can prepare to take long position (combine with your favorite price action)
- if the trend is up and tomorrow there is a 'Price & Time Squared Line', we can prepare to take short position (combine with your favorite price action)
- stop loss if the chart makes Lower Low (for Long Position)
- stop loss if the chart makes Higher High (for Short Position)
you can use those lines as guidance in your trading (just like Traffic Light)
PS:
-if you see 2 or 3 lines close together, or 2 or 3 lines stack in 1 line (cluster), it means the Time Factor is 'Strong'
the stronger the cluster the stronger the Time Factor
- due to time delay & time lag, the turning can be +/- 1 bar
- PM for trial access
“Time is the most important factor of all and not until sufficient time has expired does any big move start up or down. The time factor will overbalance both space and volume. When time is up, space movement will start and large volume will begin, either up or down.

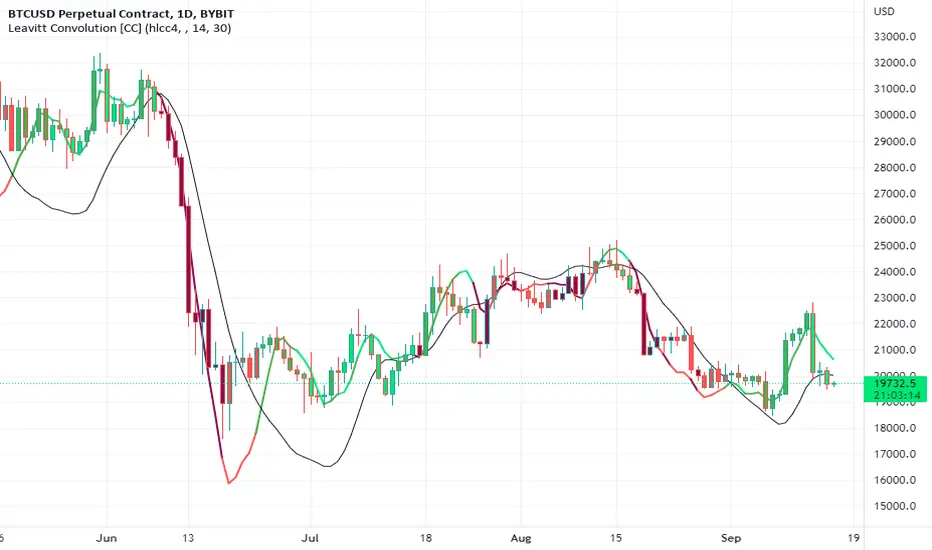
Leavitt Convolution [CC]The Leavitt Convolution indicator was created by Jay Leavitt (Stocks and Commodities Oct 2019, page 11), who is most well known for creating the Volume-Weighted Average Price indicator. This indicator is very similar to my Leavitt Projection script and I forgot to mention that both of these indicators are actually predictive moving averages. The Leavitt Convolution indicator doubles down on this idea by creating a prediction of the Leavitt Projection which is another prediction for the next bar. Obviously this means that it isn't always correct in its predictions but it does a very good job at predicting big trend changes before they happen. The recommended strategy for how to trade with these indicators is to plot a fast version and a slow version and go long when the fast version crosses over the slow version or to go short when the fast version crosses under the slow version. I have color coded the lines to turn light green for a normal buy signal or dark green for a strong buy signal and light red for a normal sell signal, and dark red for a strong sell signal.
This is another indicator in a series that I'm publishing to fulfill a special request from @ashok1961 so let me know if you ever have any special requests for me.
Blockchain Fundamentals: 200 Week MA Heatmap [CR]Blockchain Fundamentals: 200 Week MA Heatmap
This is released as a thank you to all my followers who pushed me over the 600 follower mark on twitter. Thanks to all you Kingz and Queenz out there who made it happen. <3
Indicator Overview
In each of its major market cycles, Bitcoin's price historically bottoms out around the 200 week moving average.
This indicator uses a color heatmap based on the % increases of that 200 week moving average. Depending on the rolling cumulative 4 week percent delta of the 200 week moving average, a color is assigned to the price chart. This method clearly highlights the market cycles of bitcoin and can be extremely helpful to use in your forecasts.
How It Can Be Used
The long term Bitcoin investor can monitor the monthly color changes. Historically, when we see orange and red dots assigned to the price chart, this has been a good time to sell Bitcoin as the market overheats. Periods where the price dots are purple and close to the 200 week MA have historically been good times to buy.
Bitcoin Price Prediction Using This Tool
If you are looking to predict the price of Bitcoin or forecast where it may go in the future, the 200WMA heatmap can be a useful tool as it shows on a historical basis whether the current price is overextending (red dots) and may need to cool down. It can also show when Bitcoin price may be good value on a historical basis. This can be when the dots on the chart are purple or blue.
Over more than ten years, $BTC has spent very little time below the 200 week moving average which is also worth noting when thinking about price predictions for Bitcoin or a Bitcoin price forecast.
Notes
1.) If you do not want to view the legend do the following: Indicator options > Style tab > Uncheck "Tables"
2.) I use my custom function to get around the limited historical data for bitcoin. You can check out the explanation of it here:

Nearest Neighbor Extrapolation of Price [Loxx]I wasn't going to post this because I don't like how this calculates by puling in the Open price, but I'm posting it anyway. This does work in it's current form but there is a. better way to do this. I'll revisit this in the future.
Anyway...
The k-Nearest Neighbor algorithm (k-NN) searches for k past patterns (neighbors) that are most similar to the current pattern and computes the future prices based on weighted voting of those neighbors. This indicator finds only one nearest neighbor. So, in essence, it is a 1-NN algorithm. It uses the Pearson correlation coefficient between the current pattern and all past patterns as the measure of distance between them. Also, this version of the nearest neighbor indicator gives larger weights to most recent prices while searching for the closest pattern in the past. It uses a weighted correlation coefficient, whose weight decays linearly from newer to older prices within a price pattern.
This indicator also includes an error window that shows whether the calculation is valid. If it's green and says "Passed", then the calculation is valid, otherwise it'll show a red background and and error message.
Inputs
Npast - number of past bars in a pattern;
Nfut -number of future bars in a pattern (must be < Npast).
lastbar - How many bars back to start forecast? Useful to show past prediction accuracy
barsbark - This prevents Pine from trying to calculate on all past bars
Related indicators
Hodrick-Prescott Extrapolation of Price
Itakura-Saito Autoregressive Extrapolation of Price
Helme-Nikias Weighted Burg AR-SE Extra. of Price
Weighted Burg AR Spectral Estimate Extrapolation of Price
Levinson-Durbin Autocorrelation Extrapolation of Price
Fourier Extrapolator of Price w/ Projection Forecast

Hodrick-Prescott Extrapolation of Price [Loxx]Hodrick-Prescott Extrapolation of Price is a Hodrick-Prescott filter used to extrapolate price.
The distinctive feature of the Hodrick-Prescott filter is that it does not delay. It is calculated by minimizing the objective function.
F = Sum((y(i) - x(i))^2,i=0..n-1) + lambda*Sum((y(i+1)+y(i-1)-2*y(i))^2,i=1..n-2)
where x() - prices, y() - filter values.
If the Hodrick-Prescott filter sees the future, then what future values does it suggest? To answer this question, we should find the digital low-frequency filter with the frequency parameter similar to the Hodrick-Prescott filter's one but with the values calculated directly using the past values of the "twin filter" itself, i.e.
y(i) = Sum(a(k)*x(i-k),k=0..nx-1) - FIR filter
or
y(i) = Sum(a(k)*x(i-k),k=0..nx-1) + Sum(b(k)*y(i-k),k=1..ny) - IIR filter
It is better to select the "twin filter" having the frequency-independent delay Тdel (constant group delay). IIR filters are not suitable. For FIR filters, the condition for a frequency-independent delay is as follows:
a(i) = +/-a(nx-1-i), i = 0..nx-1
The simplest FIR filter with constant delay is Simple Moving Average (SMA):
y(i) = Sum(x(i-k),k=0..nx-1)/nx
In case nx is an odd number, Тdel = (nx-1)/2. If we shift the values of SMA filter to the past by the amount of bars equal to Тdel, SMA values coincide with the Hodrick-Prescott filter ones. The exact math cannot be achieved due to the significant differences in the frequency parameters of the two filters.
To achieve the closest match between the filter values, I recommend their channel widths to be similar (for example, -6dB). The Hodrick-Prescott filter's channel width of -6dB is calculated as follows:
wc = 2*arcsin(0.5/lambda^0.25).
The channel width of -6dB for the SMA filter is calculated by numerical computing via the following equation:
|H(w)| = sin(nx*wc/2)/sin(wc/2)/nx = 0.5
Prediction algorithms:
The indicator features the two prediction methods:
Metod 1:
1. Set SMA length to 3 and shift it to the past by 1 bar. With such a length, the shifted SMA does not exist only for the last bar (Bar = 0), since it needs the value of the next future price Close(-1).
2. Calculate SMA filer's channel width. Equal it to the Hodrick-Prescott filter's one. Find lambda.
3. Calculate Hodrick-Prescott filter value at the last bar HP(0) and assume that SMA(0) with unknown Close(-1) gives the same value.
4. Find Close(-1) = 3*HP(0) - Close(0) - Close(1)
5. Increase the length of SMA to 5. Repeat all calculations and find Close(-2) = 5*HP(0) - Close(-1) - Close(0) - Close(1) - Close(2). Continue till the specified amount of future FutBars prices is calculated.
Method 2:
1. Set SMA length equal to 2*FutBars+1 and shift SMA to the past by FutBars
2. Calculate SMA filer's channel width. Equal it to the Hodrick-Prescott filter's one. Find lambda.
3. Calculate Hodrick-Prescott filter values at the last FutBars and assume that SMA behaves similarly when new prices appear.
4. Find Close(-1) = (2*FutBars+1)*HP(FutBars-1) - Sum(Close(i),i=0..2*FutBars-1), Close(-2) = (2*FutBars+1)*HP(FutBars-2) - Sum(Close(i),i=-1..2*FutBars-2), etc.
The indicator features the following inputs:
Method - prediction method
Last Bar - number of the last bar to check predictions on the existing prices (LastBar >= 0)
Past Bars - amount of previous bars the Hodrick-Prescott filter is calculated for (the more, the better, or at least PastBars>2*FutBars)
Future Bars - amount of predicted future values
The second method is more accurate but often has large spikes of the first predicted price. For our purposes here, this price has been filtered from being displayed in the chart. This is why method two starts its prediction 2 bars later than method 1. The described prediction method can be improved by searching for the FIR filter with the frequency parameter closer to the Hodrick-Prescott filter. For example, you may try Hanning, Blackman, Kaiser, and other filters with constant delay instead of SMA.
Related indicators
Itakura-Saito Autoregressive Extrapolation of Price
Helme-Nikias Weighted Burg AR-SE Extra. of Price
Weighted Burg AR Spectral Estimate Extrapolation of Price
Levinson-Durbin Autocorrelation Extrapolation of Price
Fourier Extrapolator of Price w/ Projection Forecast

Itakura-Saito Autoregressive Extrapolation of Price [Loxx]Itakura-Saito Autoregressive Extrapolation of Price is an indicator that uses an autoregressive analysis to predict future prices. This is a linear technique that was originally derived or speech analysis algorithms.
What is Itakura-Saito Autoregressive Analysis?
The technique of linear prediction has been available for speech analysis since the late 1960s (Itakura & Saito, 1973a, 1970; Atal & Hanauer, 1971), although the basic principles were established long before this by Wiener (1947). Linear predictive coding, which is also known as autoregressive analysis, is a time-series algorithm that has applications in many fields other than speech analysis (see, e.g., Chatfield, 1989).
Itakura and Saito developed a formulation for linear prediction analysis using a lattice form for the inverse filter. The Itakura–Saito distance (or Itakura–Saito divergence) is a measure of the difference between an original spectrum and an approximation of that spectrum. Although it is not a perceptual measure it is intended to reflect perceptual (dis)similarity. It was proposed by Fumitada Itakura and Shuzo Saito in the 1960s while they were with NTT. The distance is defined as: The Itakura–Saito distance is a Bregman divergence, but is not a true metric since it is not symmetric and it does not fulfil triangle inequality.
read more: Selected Methods for Improving Synthesis Speech Quality Using Linear Predictive Coding: System Description, Coefficient Smoothing and Streak
Data inputs
Source Settings: -Loxx's Expanded Source Types. You typically use "open" since open has already closed on the current active bar
LastBar - bar where to start the prediction
PastBars - how many bars back to model
LPOrder - order of linear prediction model; 0 to 1
FutBars - how many bars you want to forward predict
Things to know
Normally, a simple moving average is calculated on source data. I've expanded this to 38 different averaging methods using Loxx's Moving Avreages.
This indicator repaints
Related Indicators (linear extrapolation of price)
Levinson-Durbin Autocorrelation Extrapolation of Price
Weighted Burg AR Spectral Estimate Extrapolation of Price
Helme-Nikias Weighted Burg AR-SE Extra. of Price
Helme-Nikias Weighted Burg AR-SE Extra. of Price [Loxx]Helme-Nikias Weighted Burg AR-SE Extra. of Price is an indicator that uses an autoregressive spectral estimation called the Weighted Burg Algorithm, but unlike the usual WB algo, this one uses Helme-Nikias weighting. This method is commonly used in speech modeling and speech prediction engines. This is a linear method of forecasting data. You'll notice that this method uses a different weighting calculation vs Weighted Burg method. This new weighting is the following:
w = math.pow(array.get(x, i - 1), 2), the squared lag of the source parameter
and
w += math.pow(array.get(x, i), 2), the sum of the squared source parameter
This take place of the rectangular, hamming and parabolic weighting used in the Weighted Burg method
Also, this method includes Levinson–Durbin algorithm. as was already discussed previously in the following indicator:
Levinson-Durbin Autocorrelation Extrapolation of Price
What is Helme-Nikias Weighted Burg Autoregressive Spectral Estimate Extrapolation of price?
In this paper a new stable modification of the weighted Burg technique for autoregressive (AR) spectral estimation is introduced based on data-adaptive weights that are proportional to the common power of the forward and backward AR process realizations. It is shown that AR spectra of short length sinusoidal signals generated by the new approach do not exhibit phase dependence or line-splitting. Further, it is demonstrated that improvements in resolution may be so obtained relative to other weighted Burg algorithms. The method suggested here is shown to resolve two closely-spaced peaks of dynamic range 24 dB whereas the modified Burg schemes employing rectangular, Hamming or "optimum" parabolic windows fail.
Data inputs
Source Settings: -Loxx's Expanded Source Types. You typically use "open" since open has already closed on the current active bar
LastBar - bar where to start the prediction
PastBars - how many bars back to model
LPOrder - order of linear prediction model; 0 to 1
FutBars - how many bars you want to forward predict
Things to know
Normally, a simple moving average is calculated on source data. I've expanded this to 38 different averaging methods using Loxx's Moving Avreages.
This indicator repaints
Further reading
A high-resolution modified Burg algorithm for spectral estimation
Related Indicators
Levinson-Durbin Autocorrelation Extrapolation of Price
Weighted Burg AR Spectral Estimate Extrapolation of Price
Weighted Burg AR Spectral Estimate Extrapolation of Price [Loxx]Weighted Burg AR Spectral Estimate Extrapolation of Price is an indicator that uses an autoregressive spectral estimation called the Weighted Burg Algorithm. This method is commonly used in speech modeling and speech prediction engines. This method also includes Levinson–Durbin algorithm. As was already discussed previously in the following indicator:
Levinson-Durbin Autocorrelation Extrapolation of Price
What is Levinson recursion or Levinson–Durbin recursion?
In many applications, the duration of an uninterrupted measurement of a time series is limited. However, it is often possible to obtain several separate segments of data. The estimation of an autoregressive model from this type of data is discussed. A straightforward approach is to take the average of models estimated from each segment separately. In this way, the variance of the estimated parameters is reduced. However, averaging does not reduce the bias in the estimate. With the Burg algorithm for segments, both the variance and the bias in the estimated parameters are reduced by fitting a single model to all segments simultaneously. As a result, the model estimated with the Burg algorithm for segments is more accurate than models obtained with averaging. The new weighted Burg algorithm for segments allows combining segments of different amplitudes.
The Burg algorithm estimates the AR parameters by determining reflection coefficients that minimize the sum of for-ward and backward residuals. The extension of the algorithm to segments is that the reflection coefficients are estimated by minimizing the sum of forward and backward residuals of all segments taken together. This means a single model is fitted to all segments in one time. This concept is also used for prediction error methods in system identification, where the input to the system is known, like in ARX modeling
Data inputs
Source Settings: -Loxx's Expanded Source Types. You typically use "open" since open has already closed on the current active bar
LastBar - bar where to start the prediction
PastBars - how many bars back to model
LPOrder - order of linear prediction model; 0 to 1
FutBars - how many bars you want to forward predict
BurgWin - weighing function index, rectangular, hamming, or parabolic
Things to know
Normally, a simple moving average is calculated on source data. I've expanded this to 38 different averaging methods using Loxx's Moving Avreages.
This indicator repaints
Included
Bar color muting
Further reading
Performance of the weighted burg methods of ar spectral estimation for pitch-synchronous analysis of voiced speech
The Burg algorithm for segments
Techniques for the Enhancement of Linear Predictive Speech Coding in Adverse Conditions
Related Indicators

Levinson-Durbin Autocorrelation Extrapolation of Price [Loxx]Levinson-Durbin Autocorrelation Extrapolation of Price is an indicator that uses the Levinson recursion or Levinson–Durbin recursion algorithm to predict price moves. This method is commonly used in speech modeling and prediction engines.
What is Levinson recursion or Levinson–Durbin recursion?
Is a linear algebra prediction analysis that is performed once per bar using the autocorrelation method with a within a specified asymmetric window. The autocorrelation coefficients of the window are computed and converted to LP coefficients using the Levinson algorithm. The LP coefficients are then transformed to line spectrum pairs for quantization and interpolation. The interpolated quantized and unquantized filters are converted back to the LP filter coefficients to construct the synthesis and weighting filters for each bar.
Data inputs
Source Settings: -Loxx's Expanded Source Types. You typically use "open" since open has already closed on the current active bar
LastBar - bar where to start the prediction
PastBars - how many bars back to model
LPOrder - order of linear prediction model; 0 to 1
FutBars - how many bars you want to forward predict
Things to know
Normally, a simple moving average is caculated on source data. I've expanded this to 38 different averaging methods using Loxx's Moving Avreages.
This indicator repaints
Included
Bar color muting
Further reading
Implementing the Levinson-Durbin Algorithm on the StarCore™ SC140/SC1400 Cores
LevinsonDurbin_G729 Algorithm, Calculates LP coefficients from the autocorrelation coefficients. Intel® Integrated Performance Primitives for Intel® Architecture Reference Manual

Fourier Extrapolation of Variety Moving Averages [Loxx]Fourier Extrapolation of Variety Moving Averages is a Fourier Extrapolation (forecasting) indicator that has for inputs 38 different types of moving averages along with 33 different types of sources for those moving averages. This is a forecasting indicator of the selected moving average of the selected price of the underlying ticker. This indicator will repaint, so past signals are only as valid as the current bar. This indicator allows for up to 1500 bars between past bars and future projection bars. If the indicator won't load on your chart. check the error message for details on how to fix that, but you must ensure that past bars + futures bars is equal to or less than 1500.
Fourier Extrapolation using the Quinn-Fernandes algorithm is one of several (5-10) methods of signals forecasting that I'l be demonstrating in Pine Script.
What is Fourier Extrapolation?
This indicator uses a multi-harmonic (or multi-tone) trigonometric model of a price series xi, i=1..n, is given by:
xi = m + Sum( a*Cos(w*i) + b*Sin(w*i), h=1..H )
Where:
xi - past price at i-th bar, total n past prices;
m - bias;
a and b - scaling coefficients of harmonics;
w - frequency of a harmonic ;
h - harmonic number;
H - total number of fitted harmonics.
Fitting this model means finding m, a, b, and w that make the modeled values to be close to real values. Finding the harmonic frequencies w is the most difficult part of fitting a trigonometric model. In the case of a Fourier series, these frequencies are set at 2*pi*h/n. But, the Fourier series extrapolation means simply repeating the n past prices into the future.
This indicator uses the Quinn-Fernandes algorithm to find the harmonic frequencies. It fits harmonics of the trigonometric series one by one until the specified total number of harmonics H is reached. After fitting a new harmonic , the coded algorithm computes the residue between the updated model and the real values and fits a new harmonic to the residue.
see here: A Fast Efficient Technique for the Estimation of Frequency , B. G. Quinn and J. M. Fernandes, Biometrika, Vol. 78, No. 3 (Sep., 1991), pp . 489-497 (9 pages) Published By: Oxford University Press
The indicator has the following input parameters:
src - input source
npast - number of past bars, to which trigonometric series is fitted;
Nfut - number of predicted future bars;
nharm - total number of harmonics in model;
frqtol - tolerance of frequency calculations.
Included:
Loxx's Expanded Source Types
Loxx's Moving Averages
Other indicators using this same method
Fourier Extrapolator of Variety RSI w/ Bollinger Bands
Fourier Extrapolator of Price w/ Projection Forecast
Fourier Extrapolator of Price
Loxx's Moving Averages: Detailed explanation of moving averages inside this indicator
Loxx's Expanded Source Types: Detailed explanation of source types used in this indicator
Reverse Stoch [BApig Gift] - on PanelMssive credit to Motgench, Balipour and Wugamlo for this script. This script is all of their good work.
It is basically just the non-on chart version which I've slightly tweaked off their script. This can be useful to reduce the clutter on the chart itself. Releasing it in the hope that it can be useful for the community
Enjoy!

Price Action All In One IndicatorIf you are the one who is "Price Action" style & does not want to use many indicators or complex indicators or you are an ICT (The Inner Circle Trader)
student or ICT charter, this simple beautiful All In One Indicator is right for you.
The indicator has the following functions.
TIME ZONE SETTING
The default timezone is New York Time GMT-4, if you leave the time zone setting blank, it will use the symbol timezone. Note that the trading time changes with one hour delay in winter. so if you just trade forex, and leave the time zone setting blank, TradingView will adjust the symbol timezone automatically for you or don't forget to change the timezone setting GMT-4 or GMT-5 depending on daylight saving time.
STATISTIC PANEL
You can choose which panel to show through settings.
Session Info Panel : pips info of ADR, Asian, London, and New York sessions.
Trend Panel : showing trend (up/down) of
5m/15m/1h/4h/D/W time frames (TF)
4MA (default values: SMA with lengths: 20–50–100–200)
Money Management Panel : in trading, money management is very important. Just put the % risk, & stop loss value below, the indicator will calculate a suitable size/amount for each trade.
Size by Lots: input stop loss in pips
Size by Units: input stop loss in % (of price)
(*)Units size is calculated by % stop loss & current bar close price. You have to determine a stop-loss price to convert to % stop loss by yourself.
TIME SEPARATORS
We can choose which time separators we want to display. The indicator has 5 options: Anchor Time/Day/Week/Month/Quarter. Of course, we can choose to show just one or all 5 of them.
With Anchor Time you can choose which time you want to draw a vertical line for better timing analysis. This can show up to 2 Anchor Time lines. The default values are 00:00 (New York Midnight Opening) and 08:30 (New York Session Opening). You also have an option to show the past lines or not.
About Day Separator, cause TradingView has supported Session Breaks in Setting but if you don't like to use it or when enabling, it distracts you, you can use mine. My favorite trading dates are Tuesday & Wednesday.
PRICE LEVELS
For intraday trading, the high/low/close of the previous day, the previous week, ADR (default period is 5) are very important key levels. You can choose which one you like to show for better analysis. Of course, you can change the color & style of the lines. This is also my favorite indicator.
This indicator also has an option to show up to 2 price lines at a specific time, you can choose the price type (high/low/close/open) that you want to display. The default time values are:
Specific Time 1: 0:00. (New York Midnight Opening Price)
Specific Time 2: 8:30 am. (New York Session Opening Price)
ACCUMULATION ZONE
The market tends to reprice the higher/lower to the old high/low or imbalance/fair value price to promote buy/sell stops or to provide smart money pricing for long/short entries. Typically, it redistributes quickly and you must learn to anticipate them at key levels intraday. Weak short/long holders will be squeezed in the retracement.
Except for the open price, the price changes continuously until the closing time, so the accumulation area can also be changed in real-time, but if you combine it with other information when analyzing, you can predict/determine whether the zone has been established or not with high probability. In short, price needs time to be accumulated, I usually don't pay attention to this daily zone till London open/close or New York sessions
Not only daily zone, but the indicator also supports higher timeframes accumulation zone from
SESSION & STD
There are 3 sessions: Asian, London, New York. The default values are below (New York Time).
Asian: 19:00 ~ 00:00
London Open (London KillZone): 01:00 ~ 05:00
New York Open (New York KillZone): 07:00 ~ 10:00
If you do not want to show the label, just leave the label values blank or change them to whatever you want.
This is one of my favorite functions. I use it on 15m, 30m, 1h TF for Forex intraday trading. My favorite trading sessions are London Open & New York Open.
You also can choose to show or not Standard Deviations (STD). The default values are set for Asian Range STD and max STD levels can be shown are 5. I use the following 3 types of STD (New York Time):
CBDR (Central Bank Deviations) STD: 14:00 ~ 20:00
Flout STD: 15:00 ~00:00
Asian Range STD: 19:00 ~ 00:00
LOOKBACK HIGH/LOW/MID
Can show high/low/mid of the data ranges on the daily/4h chart. The default values are:
- 20–40–60 days back from today for daily TF.
- 30–60–90 bars back from the latest bar for 4h TF.
The default anchor bar for calculating the lookback is the latest one but with:
- 4h TF: we can change the lookback from the 1st day of the week.
- Daily TF: we can change the lookback from the 1st day of the month.
The indicator also has options showing the high/low/mid (equilibrium level) lines for better analysis. Especially, on daily TF, we have the option that can show up to 4 lines (25% for each one) of the data range.
Of course, you can change the colors or the style of the high/low/mid lines.
The lookback can be shown on the lower TFs for better detection when the market structure is shifted.
MAGIC BARS
Fractal bar : The bar's color is changed when the divergence occurs between the price & RSI. You can change the RSI period (default value is 14) & RSI source. (open/high/low/close,…)
Imbalance bar or liquidity void or fair value gap - whatever you call it. This is my favorite indicator when trading on all TFs.You can choose to extend the last n imbalance bars if you like in the settings. I make sure I covered all cases of imbalance/fair value gap.
OLD HIGH/LOW
First, this function is not used as the common Support & Resistance that retail traders usually use, so I call it Old High/Low. I usually use it in 2 ways:
Detect the next buy/sell stops that Market Makers aim to manipulate.
Detect whether market structure shifted or not (Break of structure)
In settings you can:
Set the period to detect high/low levels, the default value is 10. My other favorite values are 6 & 2.
On a lower time frame, you might want to set it to a large number to remove noise.
On a higher time frame, a small number is enough, I think.
Choose the numbers of the last lines you want to show on your chart.
Of course, the style of lines can be changed easily.
TRENDLINES
A very simple trendline with default pivot left strength is 10.
By default, trendline uses high/low price but you have the "Using close price" option.
LINEAR REGRESSION CHANNEL
The Linear Regression Channel is a three-line technical indicator used to analyze the upper and lower limits of an existing trend. It is a statistical tool used to predict the future from past data and is used to determine trend direction or when prices may be overextended.
You can choose
To fill the background or not
To show inner/outer lines or not
To change the colors/line styles of upper zone, lower zone, upper lines, lower lines, midline
DIRECTION BOX
Working on all TFs, this looks like the same with lookback function but if you would like to display them in a box for easily focusing/comparing with other symbols or for detecting divergence in a specific period. The indicator also has a setting to show or hide lines connecting between lows or highs.
Another example of how I use High/Low connecting lines to detect divergence between S&P 500 and NASDAQ 100.
ZIG ZAG
Can show up to 2 ZigZag lines.
This is suitable for traders who have difficulty in detecting key levels (recent high/low) of the prices to confirm market structure or just for drawing Fibonacci easily at those levels.
MA (Moving Average)
I believe that this is one of the most used indicators for every trader. There are 5 types of MA to choose from: EMA, SMA, WMA, VWMA, SMMA(RMA).
This can show up to 4 MAs. You can choose the source (close/high/low,…) for each one. My favorite values are 34 & 89 EMA.
This indicator also supports MA Bands. You can select which MA you want to display the bands, and the "width" of the bands can be changed via the settings.
WATERMARK
It's just a simple function but I think it's very useful for those who want to add Copyright info to the chart, to prevent others from copying it.
Others/known issues/limitations
In forex or stock (things that are traded only on weekdays), TradingView's does not include the latest bars till Monday so the Day Separator cannot fill that space. Because TradingView deals with those bars as Sunday's ones so I set the color of Sunday the same as Friday for good UI/UX. On Crypto charts, the indicator shows without problems.
If you see "Internal server study error", please try closing the current TradingView tab in your browser and reopening it in a new tab. The error will disappear.
Because TradingView does not provide any detailed error information when such "general error" occurs. It's very difficult to detect which function is causing this error or is there something that caused TradingView "overloaded" through a long time running/loading on that tab? Honestly, I don't know exactly the cause, but in my experience, this error often occurs in the following cases:
When you have the TradingView Tab open for hours. In my case, I usually leave TradingView tab open overnight & when I come back the next day, this error might appear. (I'm a Mac user & I almost never shut down my Mac)
When you change settings too many times, especially settings of drawing objects like line width in a using session, it might cause this error.
So, after changing the setting or when you come back for the next trade, please save & close that TradingView tab, and then open a new one, everything will work fine.
You can see the images below that show I have tested my indicator from 1-minute time frame, enabled all functions, change every setting to max values & everything still works fine.

Ichimoku PeeksThis indicator uses the Ichimoku Tenkan / Kijun trend line formulas to predict what those values will be in the future if current price action does not violate the period highs and lows.
Because of the way Ichimoku formulates the trend, it contains (but does not visualize) this predictive information in a way that moving averages do not.
Sharp chart readers can infer upcoming changes by counting back candles, but the process can be automated, as I've shown here.
This description does not seem to be editable so implementation details and usage will be covered in code commentary.
Current bar predicted volumeDrag this indicator in the same panel with the volume in the object tree, then right click on the scale bar and set "merge all scale into one" for a correct visualization.
This indicator multiply the current traded volume of a candle with the total time of that candle. This offer a prediction of where, in case the volumes would keep trading at a comparable magnitude, the volume bar would close when the candle will close.
The predicted volume is indicated with a blue short line above the current volume bar, and updates in real time.
I find this indicator extremely useful to offer at a glance an idea of an ascending or descending volume pattern, that can serve as confirmation for a reversal or breakout for example.
Very suitable for short time frames, where decisions have to be taken fast.
Enjoy,
Luca.

BB Order BlocksUsing the Bollinger Band to mark areas of Support and Resistance
The scrip finds the highest and lowest levels of the bands to mark up futures areas of interest.
If the High/Lows are being broken on the Bollinger band, or if the look back range has expired without finding new levels, the script will stop plotting them until new levels are found
I have found many combinations which work well
Changing the band length to to levels 20,50,100 or 200 seem to give interesting results
Aswell as this changing the standard deviation to 3 instead of 2 marks up key levels.
The look back range seems to show better levels on 50,100 and 200
Let me know any changes or updates you think you could make an impact , this was just a quick basic script I wanted to share.

MoonFlag DailyThis is a useful indicator as it shows potential long and short regions by coloring the AI wavecloud green or red.
There is an option to show a faint white background in regions where the green/red cloud parts are failing as a trade from the start position of each region.
Its a combination of 3 algos I developed, and there is an option to switch to see these individually, although this has lots of info and is a bit confusing.
It does have alerts and there are text boxes in the indicator settings where a comment can be input - this is useful for webhooks bots auto trading.
Most useful in this indicator is that at the end of each green/long or red/short region there is a label that shows the % gain or loss for a trade.
The label at the end of the chart shows the % of winning longs/shorts and the average % gain or loss for all the longs/shorts within the set test period (set in settings)
So, I generally set the chart initially on a 15min timeframe with the indicator timeframe (in settings) set to run on say 30min or 1hour. I then select a long test period (several plus months) and then optimize the wavelcloud length (in settings) to give the best %profit per trade. (Longs always seem to give better results than shorts)
I then, change the chart timeframe to much faster, say 1min or 5min, but leave the indicator timeframe at 1 hour. In this manner - the label only shows a few trades however, the algo is run at every bar close and when this is set to 1min, this means that losses will be minimised at the bot exits quickly. In comparison - if the chart is on a 15min timeframe - it can take this amount before the bot will exit a trade and by then there could be catastrophic losses.
It is quite hard to get a positive result - although with a bit of playing around - just as a background indicator - I find this useful. I generally set-up on say 4charts all with different timeframes and then look for consistency between the long/short signal positions. (Although when I run as a bot I use a fast timeframe)
Please do leave some comments and get in touch.
MoonFlag (Josef Tainsh PhD)

Better Trader Super PredictThis is a free trading assistant that combines 4 types of trading signals and useful tools.
Four types of trading signals:
1. Trending signals. KAMA and Awesome oscillator(5,34) and (3,25) are used to confirm trend.
2. Knifes. This is a SOT detector with volume and spread filtering. The algorythm takes into account the volatility.
3. Predict. The distance from VWAP and BB stdev 2 and 3 is used. Signals usually appear when RSI/MACD/AO divergence is detected.
4. High risk signals. These are SOT and high volume signals without hard filtering.
All signals use distance from SMMA and volatility.
Filters use LL and HH events.
Each signals has entry zone, recommended stop-loss and a number of take-profits.
Recommended entry points and usually located in the body of higher timeframe candles.
Recommended stop-loss zones are using ATR(10) with multiplier that depends on the timeframe.
Take-profit points and arranged within daily and week levels using pivots and VWAP.
The useful tools are:
- Autofibo
- Ichimoku clouds
- VWAP
Disclaimer:
Your trading is fully your responsibility.
Sell and Buy markers are not a financial advice.
Do not take too much risk.
Almost all signals are NOT repainted. There some rare trend signals that can be repainted.

Ichimoku (Cloud + Box + Prediction)In addition to Ichimoku, this indicator includes Ichimoku boxes and Ichimoku prediction indicators.
You can select the base candle with the mouse and drag it and drop.
Three boxes are drawn with periods 9, 26 and 52 and it is possible to change periods.
Prediction boxes can be drawn on the right side of the candle for the three mentioned periods .
Target prices can be shown in the borders and centers of boxes.
It is possible to change the thickness and color of the boxes.
Three boxes can also be seen in the last candle of the chart.
Ichimoku lines including Tenkansen, Kijunsen, Senko, Chikou, Quality and Kumo Cloud can be displayed on the chart.
The points corresponding to each Ichimoku line represent the value of different lines in the base candle
The crossing points of the Tenkansen and Kijunsen lines can be displayed in the chart
Predictions of the amount of Tenkansen and Kijunsen in future candles can be seen on the chart.

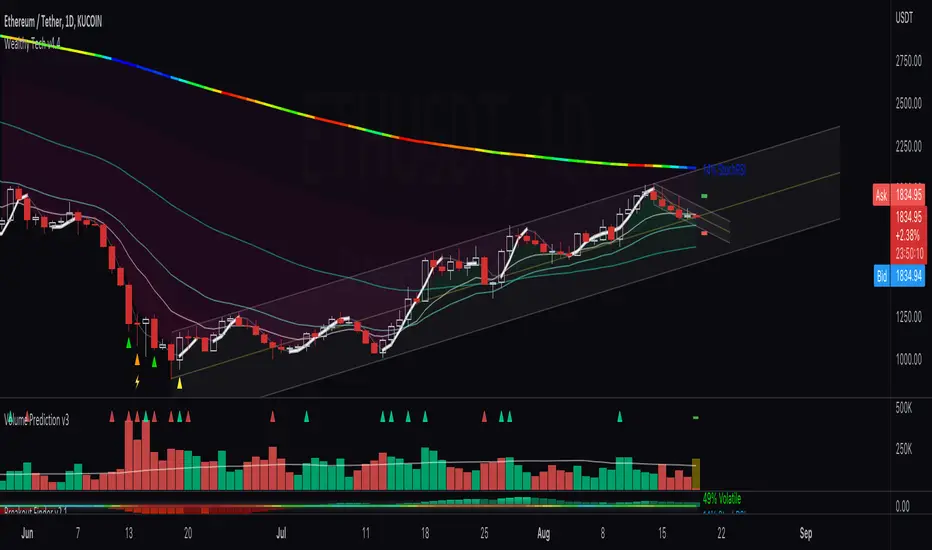
Volume PredictionVolume Prediction has as a main goal to predict what would the volume be by the end of the candle period.
It could be hard to visualize if today's volume is going to be higher by just a few minutes into the day for example.
The script helps to give an idea if the volume is higher or lower in comparison to other days.
it first start the prediction with a light tone of red/green, as the real volume keeps increasing, a more vibrant red/green will fill the prediction to the final volume of the candle. The prediction will adapt and adjust during the candle cycle according to the volume flow.
The indicator also has an elaborated color variable scheme, changing from red to green by market inclination and order flow.
You can also highlight the candles that exceeded x% to help and find breakouts.
EMA PredictionThis script predicts future EMA values assuming that the price remains as configured (-50% to +50%).
Ehlers Optimum Predictor [CC]The Optimum Predictor was created by John Ehlers (Rocket Science For Traders pgs 209-210) and this indicator does a pretty good job of predicting major market moves. When the blue line crosses over the red line then this indicator is predicting an upcoming uptrend and when the blue line crosses under the red line then it is predicting an upcoming downtrend. Ehlers recommends using this indicator with an entire trading system to filter out any bad signals but most of the signals it gives are pretty accurate. He uses advanced digital signal processing to predict the future prices and uses it in an ema formula for the calculation. There are several ways to interpret this indicator: you can look for crossovers, you can also look for when the indicator goes above 0 for a general uptrend or below 0 for a general downtrend.
Let me know if there are any other scripts you would like to see me publish!

Golden/Death Cross Predictor (by Alex L.)Golden/Death Cross indicator to picture if we're in a Bull or Bear trend, but it's much more - it indicates a potential upcoming golden/death cross, draws a potential continuation of the moving averages to indicate when it might occur, shows a 4-hourly cross which can often alert of a potential trend reversal, and is multi timeframe!
Potential Golden/Death Cross Mark - shows a potential upcoming golden/death cross (with approximate % for its occurrence as a hint).
Potential Golden/Death Cross Projection - shows a potential continuation of the MAs to visually illustrate when the potential cross might occur.
Actual Golden/Death Cross Mark - all previous golden/death crosses are marked on chart with a green/red "X" (which is when indicator's "Short Term MA" crosses "Long Term MA" up or down).
Actual 4-hourly Golden/Death Cross Mark - shows latest golden/death cross on 4-hourly timeframe (regardless of chart's timeframe), which can alert of potential higher timeframe trend reversal.
Multi Timeframe - you can set indicator's timeframe having chart in different timeframe.
Enjoy!
