Apex Edge Sentinel - Stop Loss HUDApex Edge – ATR Sentinel Stop Loss HUD
The Apex Edge – ATR Sentinel is a complete stop-loss intelligence system built as a clean, always-on HUD.
It delivers institutional-level risk guidance by calculating and displaying live ATR-based stop levels for both long and short trades at multiple risk tolerances.
Forget cluttered charts and repainting lines — Sentinel gives you a clear stop-loss reference panel that updates dynamically with every bar.
✅ Features
• Triple ATR Multipliers
User-defined (e.g. x1.5 / x2.0 / x2.5). Compare tight, medium, and wide stops instantly.
• Dual-Side SL Levels
Both Long and Short safe stop prices displayed side by side. No more guessing trend
bias.
• ATR Transparency
HUD shows ATR(length) so you always know the calculation basis. Default = 14, adjustable
to your style.
• ATR Regime Meter
Detects volatility conditions (LOW / NORMAL / HIGH) by comparing ATR to its SMA. Helps
you avoid over-tight stops in high-volatility markets.
• Tick-Aware Rounding
Stop levels auto-rounded to the instrument’s tick size (Gold = 0.10, FX = 0.0001, indices =
whole points).
Custom HUD Design
• Location: Top/Bottom, Left/Right
• Sizes: Compact / Medium / Large (desktop or mobile)
• Opacity control (25% default Apex styling)
How to Use
1. Load Sentinel on your chart.
2. Check the HUD:
• ATR(14): 2.6 → base volatility measure.
• x1.5 / x2.0 / x2.5 → instant SL levels for both long & short trades.
3. Before entering a trade → decide which multiplier matches your style (tight scalper vs wider swing).
4. Manually place your SL at the level displayed in the HUD.
Sentinel works as both:
• A pre-trade check (is ATR stop too wide for my RR?).
• A live risk compass (updated stop levels every bar).
Why Apex Sentinel?
Most ATR stop indicators clutter charts with lagging lines or repainting trails. Sentinel strips it back to what matters:
• The numbers.
• The risk levels.
• The context.
It’s a pure stop-loss HUD, designed for serious traders who want clarity, discipline, and instant reference points across any market or timeframe.
Notes
• This is a HUD-only system (no automatic SL line). Traders manually apply the SL level
shown in the panel.
• Defaults: ATR(14), multipliers 1.5 / 2.0 / 2.5. Adjust to your trading style.
• Best used on intraday pairs like XAUUSD, EURUSD, indices, but works universally.
Apex Edge Philosophy: Clean. Smart. Institutional.
No clutter. No gimmicks. Just precision tools for modern markets.
Pine utilities

Apex Edge – HTF Overlay Candles“Trade your 5m chart with the eyes of the 1H — Apex Edge brings higher-timeframe structure and liquidity sweeps directly onto your execution chart.”
Apex Edge – HTF Overlay Candles
The Apex Edge – HTF Overlay Candles indicator overlays higher-timeframe (HTF) candles directly onto your lower-timeframe chart. Instead of flipping between timeframes, you see HTF structure “breathe” live on your execution chart.
What It Does
• HTF Body Boxes → open/close zones drawn as semi-transparent rectangles.
• HTF Wick Boxes → high/low extremes projected as envelopes around each body.
• Midpoint Line → a dynamic equilibrium line that flips bias as price trades above or below.
• Sweep Arrows → one-time markers showing the first liquidity raid at HTF highs or lows.
Under the Hood
This isn’t just a visual overlay — it’s engineered for accuracy and performance in PineScript.
1. HTF Data Retrieval
• Uses request.security() to import open, high, low, close, time from any selected HTF.
• lookahead=barmerge.lookahead_off ensures OHLC values update bar by bar as the HTF
candle builds.
• When the HTF bar closes, boxes and midpoint lock to historical values — matching the
native HTF chart exactly.
2. Box Construction
• Body box: built from HTF open → close.
• Wick box: built from HTF high → low.
• Boxes extend dynamically across each HTF period, updating in real time, then freeze at
close.
3. Midpoint Logic
• (htfOpen + htfClose) / 2 calculates intrabar midpoint.
• Line drawn edge-to-edge across the active HTF body.
• Style, width, color, and opacity are user-controlled.
4. Sweep Detection
• Flags (sweepedHigh / sweepedLow) prevent clutter: only the first tap per side per HTF
candle is marked.
• Lower-timeframe price breaking the HTF high/low triggers the sweep arrow.
• Arrows are offset above/below wick envelopes for clean visuals.
5. Customisation
• Every layer (body, wick, midpoint, arrows) has independent color + opacity settings.
• Arrow size, arrow color, and transparency are adjustable.
• Default HTF = 1H (perfect for 5m/15m traders) but can be switched to 30m, 4H, Daily,
etc.
Why It’s Useful
• HTF intent + LTF execution without chart hopping.
• Liquidity mapping: see where liquidity is swept in real time.
• Bias clarity: midpoint line defines HTF equilibrium.
• Clean signals: only the first sweep prints — no spam.
What Makes It Different
Most MTF overlays just plot candles or single lines. This tool:
• Splits body vs wick zones for institutional precision.
• Updates live intrabar (no repainting).
• Highlights liquidity sweeps clearly.
• Built for readability and professional use — not another retail signal toy.
Cheat-Sheet Playbook
1️⃣ Structure Bias
• Above midpoint line = bullish intent.
• Below midpoint line = bearish intent.
• Chop around midpoint = no clear direction.
2️⃣ Liquidity Sweeps
• ▲ Green up arrow below wick box = sell-side liquidity taken → watch for longs.
• ▼ Red down arrow above wick box = buy-side liquidity taken → watch for shorts.
• First sweep is the cleanest.
3️⃣ Trade Logic
• Body box = where institutions transact.
• Wick box = liquidity traps.
• Midpoint = bias filter.
• Best setups occur when sweep + midpoint flip align.
4️⃣ Example (5m + 1H Overlay)
1. ▲ Green up arrow prints below HTF wick.
2. Price reclaims the body box.
3. Midpoint flips to support.
4. Enter long → stop below sweep → targets = midpoint first, opposite wick second.
In short:
• Boxes = structure
• Wicks = liquidity pools
• Midpoint = bias line
• Arrows = liquidity sweeps
This is your SMC edge on one chart — HTF structure and liquidity fused directly into your execution timeframe.

Alerta de toque de la 200-Week SMACuando el precio toca la MMS de 200 semanas es una posible compra.

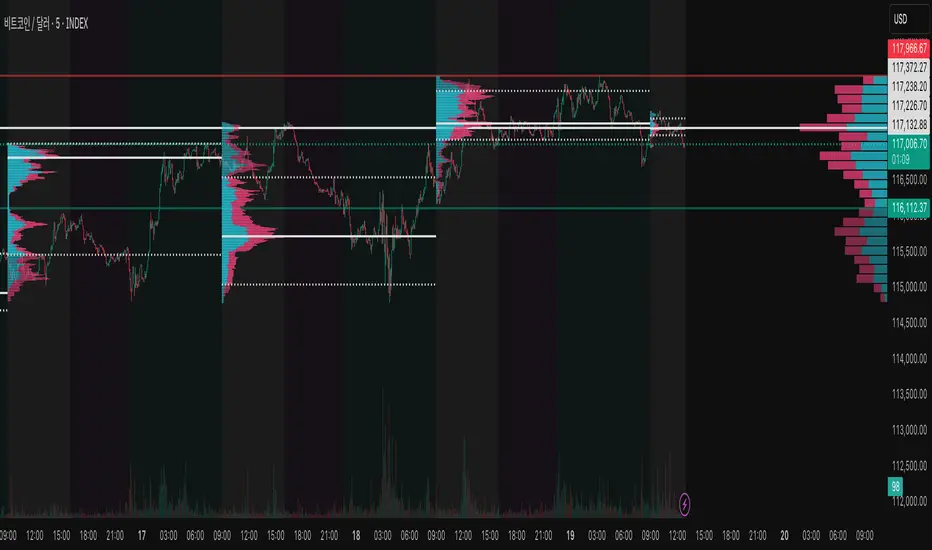
Global Session Opens + 4H Background (한글: 글로벌 세션 개장 + 4시간 배경 표시)📌 추천 설명 (Description)
English
This indicator highlights two key elements for intraday and swing traders:
Global Session Opens (Asia, Europe, US)
Small session markers at candle open times (Asia 09:00 KST, Europe 16:00 KST, US 22:00 KST). Colors: Yellow = Asia, Red = Europe, White = US. Easy to spot, non-intrusive, and customizable placement.
4H Background Blocks kr.tradingview.com
Alternating faint background (5% opacity) every 4 hours. Helps track how lower timeframes (1m, 5m) move within the higher timeframe (4H).
✅ Perfect for scalpers and intraday traders who want to keep track of global liquidity flows without cluttering the chart.
한국어
이 인디케이터는 단타 및 스윙 트레이더를 위한 두 가지 핵심 기능을 제공합니다:
글로벌 세션 개장 (아시아, 유럽, 미국)
캔들 위에 개장 시간마다 작은 점으로 표시됩니다. (한국시간 기준: 아시아 09:00, 유럽 16:00, 미국 22:00)
색상: 아시아 = 노란색, 유럽 = 빨간색, 미국 = 흰색. 차트 가독성을 해치지 않으며 위치는 자유롭게 조정 가능합니다.
4시간 배경 블록
4시간마다 교차하는 희미한 배경(투명도 95%)이 표시됩니다. 분봉(1분, 5분)의 움직임이 4시간 캔들 안에서 어떻게 전개되는지 파악하는 데 큰 도움이 됩니다.
✅ 심플하지만 강력한 보조 도구로, 차트 분석 시 심리적 흔들림을 줄이고 글로벌 유동성 흐름을 쉽게 추적할 수 있습니다.
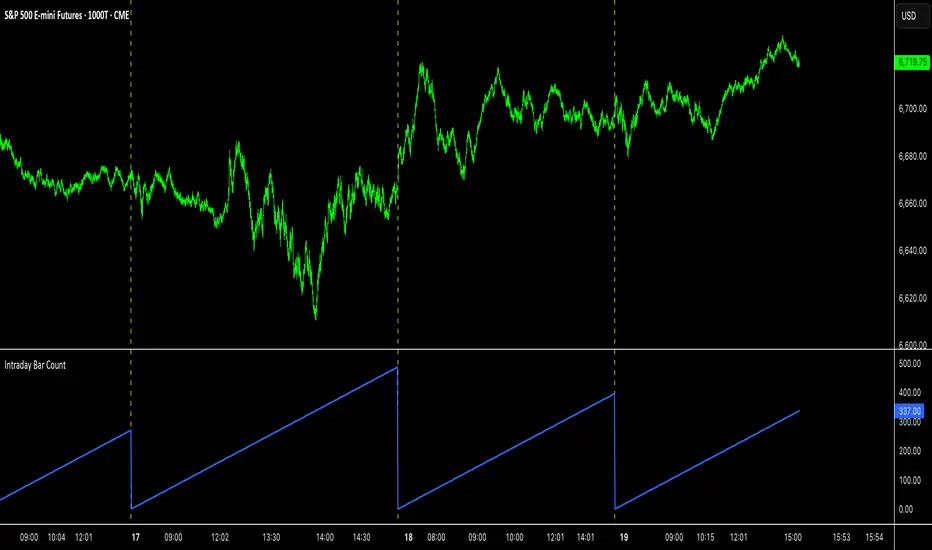
Intraday Bar CounterThis indicator plots a counter on the chart that tracks the number of bars since the beginning of the current day.
The counter resets to zero on the first bar of each new calendar day (midnight). This functionality is provided only on intraday and tick charts.
The indicator is designed to operate on a wide range of symbols without requiring manual adjustments for specific trading sessions.
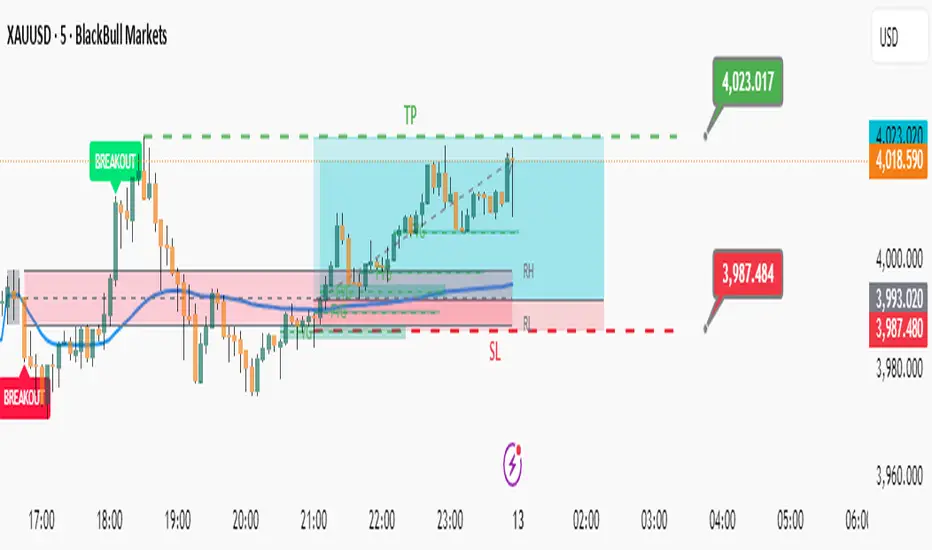
Apex Edge – Wolfe Wave HunterApex Edge – Wolfe Wave Hunter
The modern Wolfe Wave, rebuilt for the algo era
This isn’t just another Wolfe Wave indicator. Classic Wolfe detection is rigid, outdated, and rarely tradable. Apex Edge – Wolfe Wave Hunter re-engineers the pattern into a modern, SMC-driven model that adapts to today’s liquidity-dominated markets. It’s not about drawing pretty shapes – it’s about extracting precision entries with asymmetric risk-to-reward potential.
🔎 What it does
Automatic Wolfe Wave Detection
Identifies bullish and bearish Wolfe Wave structures using pivot-based logic, symmetry filters, and slope tolerances.
Channel Glow Zones
Highlights the Wolfe channel and projects it forward into the future (bars are user-defined). This allows you to see the full potential of the trade before price even begins its move.
Stop Loss (SL) & Entry Arrow
At the completion of Wave 5, the algo prints a Stop Loss line and a tiny entry arrow (green for bullish, red for bearish). but the colours can be changed in user settings. This is the “execution point” — where the Wolfe setup becomes tradable.
Target Projection Lines
TP1 (EPA): Derived from the traditional 1–4 line projection.
TP2 (1.272 Fib): Optional secondary profit target.
TP3 (1.618 Fib): Optional extended target for large runners.
All TP lines extend into the future, so you can track them as price evolves.
Volume Confirmation (optional)
A relative volume filter ensures Wave 5 is formed with meaningful market participation before a setup is confirmed.
Alerts (ready out of the box)
Custom alerts can be fired whenever a bullish or bearish Wolfe Wave is confirmed. No need to babysit the charts — let the script notify you.
⚙️ Customisation & User Control
Every trader’s market and style is different. That’s why Wolfe Wave Hunter is fully customisable:
Arrow Colours & Size
Works on both light and dark charts. Choose your own bullish/bearish entry arrow colours for maximum visibility.
Tolerance Levels
Adjust symmetry and slope tolerance to refine how strict the channel rules are.
Tighter settings = fewer but cleaner zones.
Looser settings = more frequent setups, but with slightly lower structural quality.
Channel Glow Projection
Define how many bars forward the channel is drawn. This controls how far into the future your Wolfe zones are extended.
Stop Loss Line Length
Keep the SL visible without it extending infinitely across your chart.
Take Profit Line Colors
Each TP projection can be styled to your preference, allowing you to clearly separate TP1, TP2, and TP3.
This isn’t a one-size-fits-all tool. You can shape Wolfe detection logic to match the pairs, timeframes, and market conditions you trade most.
🚀 Why it’s different
Classic Wolfe waves are rare — this script adapts the model into something practical and tradeable in modern markets.
Liquidity-aligned — many setups align with structural sweeps of Wave 3 liquidity before driving into profit.
Entry built-in — most Wolfe scripts only draw the structure. Wolfe Wave Hunter gives you a precise entry point, SL, and projected TPs.
Backtest-friendly — you’ll quickly discover which assets respect Wolfe waves and which don’t, creating your own high-probability Wolfe watchlist.
⚠️ Limitations & Disclaimer
Not all markets respect Wolfe Waves. Some FX pairs, metals, and indices respect the structure beautifully; others do not. Backtest and create your own shortlist.
No guaranteed sweeps. Many entries occur after a liquidity sweep of Wave 3, but not all. The algo is designed to detect Wolfe completion, not enforce textbook liquidity rules.
Probabilistic, not predictive. Wolfe setups don’t win every time. Always use risk management.
High-RR focus. This is not a high-frequency tool. It’s designed for precision, asymmetric setups where risk is small and reward potential is large.
✅ The Bottom Line
Apex Edge – Wolfe Wave Hunter is a modern reimagination of the Wolfe Wave. It blends structural geometry, liquidity dynamics, and algo-driven execution into a single tool that:
Detects the pattern automatically
Provides SL, entry, and TP levels
Offers alerts for hands-off trading
Allows deep customisation for different markets
When it hits, it delivers outstanding risk-to-reward. Backtest, refine your tolerances, and build your watchlist of assets where Wolfe structures consistently pay.
This isn’t just Wolfe detection — it’s Wolfe trading, rebuilt for the modern trader.
Developer Notes - As always with the Apex Edge Brand, user feedback and recommendations will always be respected. Simply drop us a message with your comments and we will endeavour to address your needs in future version updates.

Option Strike Previous Day high and LowThis script automatically plots the previous day’s High and Low levels for a selected Call (CE) and Put (PE) option contract.
It is designed to help options traders quickly identify important price zones without having to fetch or calculate them manually.
Mandatory to Input expiry like. YYMMDD
Mandatory to Input Strike like. 25350
✨ Key Features:
• Automatically requests previous day High/Low for CE and PE of the chosen strike.
• Full-width horizontal lines for clear visibility across the entire chart.
• Configurable appearance: dashed/solid lines, custom width, and label placement (left/right).
• Optional manual level input for custom support/resistance marking.
• Debug mode available to show the tickers and requested values.
⚙️ How to Use:
1. Choose the underlying root (e.g., NIFTY), expiry (YYMMDD), and strike price.
2. Select whether you want to show CE, PE, or both.
3. Adjust label offset to position tags near the chart’s right edge.
4. Use the manual level input if you want to mark an additional reference line.
💡 Why it’s useful:
Option traders often rely on previous day’s option Highs and Lows as intraday reference zones for support, resistance, and breakout levels. This script makes those levels instantly visible and consistently updated, saving time and reducing manual charting errors.
📌 Notes:
• Works on any timeframe chart of the underlying.
• For best use, apply on the underlying index/stock chart, not on the option itself.
• This script does not generate trading signals or make predictions; it provides levels for reference.

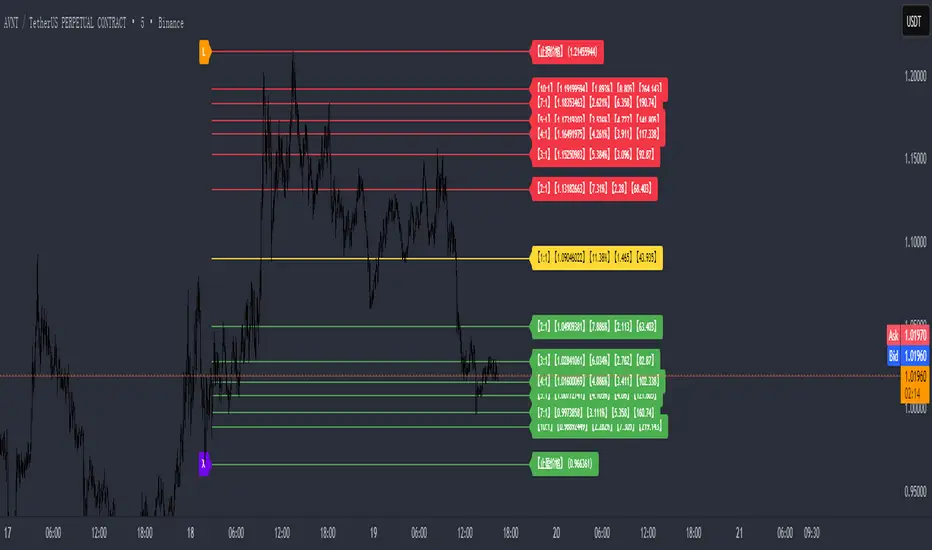
XINIU Risk-Reward Ratio Helper Pro #1.0.0CN:
专业版描述(中文)
本指标是 TradingView 平台上的一款 实用型风险收益管理工具,专为解决交易者在 风险收益评估、资金管理和进出场决策 上的痛点而设计。
交易者常见痛点:
1. 缺乏盈亏比概念 —— 盲目开单,不清楚单笔交易的最大风险与潜在收益。
2. 人工计算低效 —— 依赖计算器手工测算,费时费力,还容易出错。
3. 错失入场时机 —— 在计算过程中往往错过市场的最佳买入/卖出机会。
核心功能:
1. 自动绘制盈亏比目标价 —— 输入止损价格与目标盈亏比,自动生成止盈价格与参考线。
2. 多组盈亏比配置 —— 支持最多 10 组自定义盈亏比,快速对比不同风险收益结构。
3. 一键切换模式 —— 提供「止损为基准」「止盈为基准」「盈亏比价为基准」三种模式,灵活适配不同策略思路。
4. 资金成本与仓位测算 —— 内置保证金与手续费计算公式,直观显示进场所需资金。
5. 可视化盈亏比结构 —— 止损价、止盈价与 1:1 平衡点清晰绘制,避免盲目下单。
6. 关键分歧点提示 —— 标记多空双方可能快速插针的位置,帮助挂单埋伏。
7. 灵活图表渲染 —— 价格线延展、颜色区分与标签标注,让盈亏比一目了然。
核心好处:
1. 科学化决策 —— 清晰掌握风险与收益,避免情绪化操作。
2. 提升执行效率 —— 摆脱手工计算,用最短时间捕捉入场机会。
3. 优化风险管理 —— 自动测算仓位与资金需求,在关键分歧位“以小博大”。
4. 策略灵活性 —— 多组盈亏比与模式切换,满足不同市场环境下的需求。
风险提示:
● 本指标仅提供 参考数据和计算辅助,不能保证交易盈利。
● 市场存在不可预测波动,投资有风险,入市需谨慎。
● 用户应根据自身风险承受能力、资金状况及交易策略独立判断,不得完全依赖指标信号操作。
● 本指标开发者不对因使用本指标而导致的任何损失承担责任。
借助本指标,交易者能在复杂多变的市场中,以更专业、更高效的方式管理风险与收益,同时明确自身风险责任。
EN:
Professional Version Description (English)
This indicator is a practical Risk-Reward Management Tool on the TradingView platform, specifically designed to address traders' pain points in risk-reward evaluation, capital management, and entry/exit decision-making.
Common trader pain points:
1. Lack of risk-reward awareness – Opening trades blindly without understanding the maximum risk or potential reward of each trade.
2. Inefficient manual calculations – Relying on calculators for manual computation, which is time-consuming, error-prone, and cumbersome.
3. Missed entry opportunities – During calculations, traders often miss the optimal buy/sell opportunities in the market.
Core Features:
1. Automatic risk-reward target plotting – Enter a stop-loss price and desired risk-reward ratio, and the indicator automatically calculates take-profit levels and reference lines.
2. Multiple risk-reward configurations – Supports up to 10 custom risk-reward ratios, allowing quick comparison of different risk-reward structures.
3. One-click mode switching – Provides three flexible modes: “Stop-loss as base”, “Take-profit as base”, and “Risk-reward price as base”, adapting to various trading strategies.
4. Capital and position size calculation – Built-in formulas for margin and fee calculation, clearly displaying the required funds for entry.
5. Visualized risk-reward structure – Clearly plots stop-loss, take-profit, and 1:1 balance levels to prevent blind trading.
6. Key divergence point alerts – Marks potential rapid spikes from both bulls and bears, aiding strategic order placement.
7. Flexible chart rendering – Extendable price lines, color coding, and labeled markers make the risk-reward structure instantly clear.
Key Benefits:
1. Data-driven decision-making – Understand risk and potential reward clearly, avoiding emotional trading.
2. Improved execution efficiency – Eliminate manual calculations and quickly capture optimal entry points.
3. Optimized risk management – Automatically calculate position size and capital needs, enabling “small risk, big reward” at key divergence points.
4. Strategy flexibility – Multiple risk-reward configurations and mode switching meet the demands of varying market conditions.
Risk Disclaimer:
● This indicator provides reference data and calculation assistance only and cannot guarantee trading profits.
● Markets are subject to unpredictable fluctuations; all investments carry risk, and trading should be approached with caution.
● Users should make independent judgments based on their own risk tolerance, capital situation, and trading strategy; the indicator should not be relied upon exclusively.
● The developers of this indicator are not responsible for any losses incurred from its use.
With this tool, traders can manage risk and reward more professionally and efficiently in complex and volatile markets while clearly understanding their own risk responsibilities.
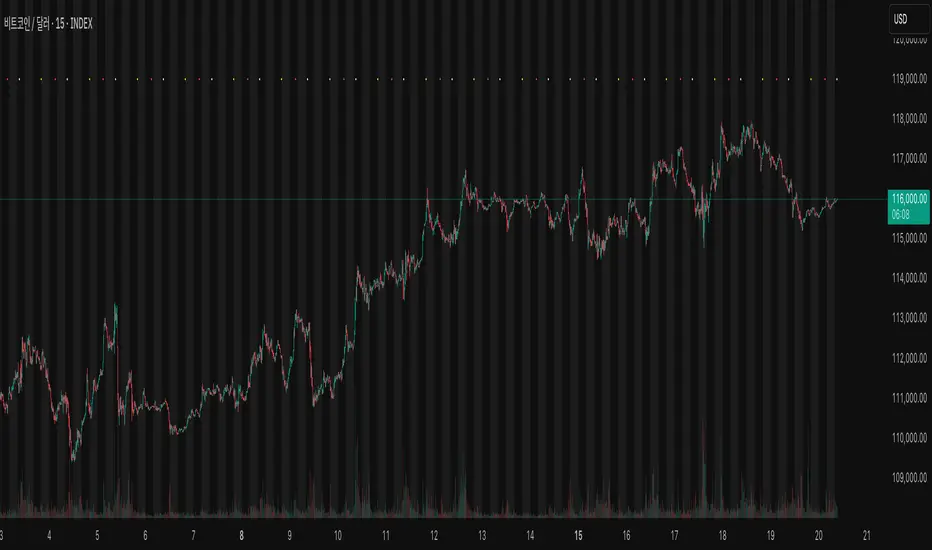
Global Session Zones (Asia / Europe / US) — KSTThis indicator highlights global market sessions (Asia, Europe, US) based on KST (Korea Standard Time).
Each session is displayed with a different background color for better visibility of price flows.
Asia Session: 09:00 – 16:00 KST
Europe Session: 16:00 – 23:00 KST
US Session: 23:00 – 09:00 KST
색상은 사용자 설정 가능하며, 각 시장 세션별 가격 흐름과 패턴을 가시적으로 분석할 수 있도록 도와줍니다.
Elite Zone Master Pro - Advanced Multi-Session Trading System🚀 Elite Zone Master Pro - Advanced Multi-Session Trading System
🎯 ORIGINALITY & UNIQUE VALUE PROPOSITION
Elite Zone Master Pro is NOT a simple mashup of existing indicators. It's a proprietary trading system that combines three distinct methodologies into a unified, synergistic approach:
Multi-Session Zone Analysis - Original algorithm for tracking global market sessions
Dynamic Opening Range Breakout (ORB) - Enhanced ORB with bias-aware signal filtering
Advanced Fair Value Gap Detection - Proprietary FVG identification with smart mitigation tracking
🔧 Why This Combination Works
The power lies in how these components work together, not separately:
Session zones provide market context and volatility windows
ORB system identifies key breakout levels during optimal timeframes
FVG detection pinpoints precise entry locations within the ORB framework
Integrated bias system filters signals based on range direction momentum
🧠 DETAILED METHODOLOGY & CALCULATIONS
🌍 1. Multi-Session Zone Framework
What it does: Tracks and visualizes three major global trading sessions simultaneously.
How it works:
Dynamic zone tracking algorithm that calculates session highs/lows in real-time
Adaptive box rendering that expands/contracts based on actual price movement
Session overlap detection for identifying high-volatility periods
Time-weighted zone positioning using custom timezone calculations
Original concepts:
Simultaneous multi-session visualization (not found in standard session indicators)
Dynamic zone expansion based on volatility, not fixed time periods
Cross-session momentum analysis for bias determination
🎯 2. Enhanced Opening Range Breakout System
What it does: Identifies breakout opportunities from predefined session ranges with intelligent bias filtering.
How it works:
Multi-session ORB calculation: Supports US (16:30-16:45), EU (10:00-10:15), Asian (03:00-03:15), and custom sessions
Dynamic range establishment: Range is built in real-time during active session periods
Bias-aware signal filtering: Two-tier breakout system based on range midpoint momentum
Range direction analysis: Compares current range midpoint to previous session's midpoint
Original methodology:
Range Bias Calculation:
- If Current_Midpoint > Previous_Midpoint = Bullish Bias (+1)
- If Current_Midpoint < Previous_Midpoint = Bearish Bias (-1)
- If Current_Midpoint = Previous_Midpoint = Neutral Bias (0)
Signal Logic:
- Bullish Bias: Standard breakout above range high
- Bearish Bias: Enhanced breakout (range_high + 0.5 * range_width) for bullish signals
- Neutral Bias: Standard breakouts both directions
⚡ 3. Advanced Fair Value Gap (FVG) Detection
What it does: Identifies and tracks fair value gaps with automatic mitigation detection.
How it works:
Three-bar gap analysis: Compares current bar relationships to identify true gaps
Dynamic threshold calculation: Auto-adjusting sensitivity based on market volatility
Smart mitigation tracking: Automatically removes filled gaps from display
Directional bias integration: Color-codes gaps based on their directional implication
Proprietary algorithms:
Bullish FVG Criteria:
- Current_Low > High (gap condition)
- Close > High (confirmation)
- (Current_Low - High ) / High > Threshold (significance filter)
Bearish FVG Criteria:
- Current_High < Low (gap condition)
- Close < Low (confirmation)
- (Low - Current_High) / Current_High > Threshold (significance filter)
Mitigation Logic:
- Bullish FVG: Mitigated when Close < FVG_Low
- Bearish FVG: Mitigated when Close > FVG_High
📈 4. Session-Based Moving Average System
What it does: Calculates moving averages that reset and adapt to session boundaries.
How it works:
Session-aware length calculation: Effective length = min(bars_since_session_start, user_length)
Multiple MA types: EMA, SMA, RMA, WMA, VWMA with session-specific calculations
Dynamic smoothing: Adapts to session length for consistent signals across different session durations
🔄 INTEGRATED SYSTEM SYNERGY
🎯 How Components Work Together
Context Layer: Session zones provide market timing context
Setup Layer: ORB system identifies breakout opportunities within optimal timeframes
Entry Layer: FVG detection pinpoints precise entry levels
Filter Layer: Bias system ensures alignment with momentum direction
Confirmation Layer: Session MA provides trend confirmation
🧭 Signal Generation Process
Step 1: Session Analysis
- Identify active trading session
- Calculate session volatility metrics
- Establish range boundaries
Step 2: Range Bias Calculation
- Compare current vs previous range midpoints
- Assign directional bias (-1, 0, +1)
- Adjust breakout thresholds accordingly
Step 3: Breakout Detection
- Monitor price interaction with range boundaries
- Apply bias-specific breakout criteria
- Generate preliminary signals
Step 4: FVG Confirmation
- Scan for fair value gaps within range
- Validate gap significance using dynamic thresholds
- Provide entry refinement opportunities
Step 5: Signal Validation
- Cross-reference with session MA direction
- Ensure alignment with overall bias
- Output final trading signals
📊 PRACTICAL IMPLEMENTATION
🎯 Trading Strategy Framework
Setup Phase:
Configure session times for your timezone
Enable preferred sessions (US/EU/Asian)
Adjust FVG sensitivity based on instrument volatility
Execution Phase:
Wait for range establishment during active session
Monitor for bias-aligned breakouts
Look for FVG retest opportunities
Enter trades with ORB-based stop losses
Risk Management:
Stop loss placement: Outside ORB range boundaries
Position sizing: Based on range width volatility
Trade direction: Must align with calculated range bias
🎨 UNIQUE VISUAL IMPLEMENTATION
📊 Advanced Visualization Features
Multi-layered zone rendering with transparency controls
Dynamic range boxes that adapt to price movement
Smart label positioning to avoid chart clutter
Color-coded bias indication through range fills
Progressive FVG display with automatic cleanup
🔧 TECHNICAL SPECIFICATIONS
⚙️ Performance Optimizations
Efficient array management for FVG tracking
Memory optimization through historical data cleanup
Smart rendering to prevent chart overload
Error handling for edge cases and invalid timeframes
📈 Compatibility
All timeframes under 1 day
All instruments (Forex, Stocks, Crypto, Futures)
All chart types with overlay capability
Mobile and desktop platform support
🏆 WHAT MAKES THIS DIFFERENT FROM OTHER INDICATORS
❌ Standard ORB indicators: Only show basic range breakouts without bias consideration
❌ Basic FVG indicators: Don't integrate with session analysis or range systems
❌ Session indicators: Simply highlight time periods without actionable trading signals
❌ Moving average indicators: Don't adapt to session dynamics
✅ Elite Zone Master Pro: Combines all elements with proprietary logic for a complete trading system
📋 USE CASES & MARKET APPLICATION
🎯 Primary Applications
Forex day trading during major session overlaps
Index futures scalping using session-specific ranges
Cryptocurrency swing trading with 24/7 session analysis
Stock market opening range breakout strategies
📊 Performance Characteristics
Best performance: During high-volatility session transitions
Optimal timeframes: 1m to 4H for intraday trading
Risk-reward ratios: Typically 1:2 to 1:4 based on range width
Win rate: Higher probability when all components align
This indicator represents months of development combining institutional trading concepts with retail accessibility. It's not just another indicator - it's a complete trading methodology in one comprehensive tool.
Weekly Session BreakThis indicator plots a vertical line at the end of the trading week (Friday) to mark the weekly session break. It is designed to be used on intraday charts (sub-1 hour timeframes).
The line's appearance is fully customizable via the Inputs tab, allowing you to change its color, style (solid, dotted, or dashed), and thickness.
Key Features:
End-of-Week Marker: Accurately draws a vertical line on the last bar of the trading week.
Timeframe Specific: Lines are only visible on intraday charts (1-minute to 59-minute timeframes) to prevent clutter on higher timeframes.
Customizable: Adjust the line's color, style, and thickness from the Inputs menu.

Custom ATR Stop Loss Calculator by riyukireiruCan automatically input the entry price, calculate ATR stop-loss, allow customizable period, adjustable table position, selectable MA ATR type, and customizable ATR value.

MTF Supply and Demand Zones [MMT]Description
The MTF Supply and Demand Zones indicator is a powerful tool designed to identify and display supply and demand zones across multiple timeframes (MTF) on your TradingView chart. These zones highlight key areas where price is likely to react, based on significant price movements in higher timeframes. The indicator is highly customizable, allowing traders to adjust zone strength, timeframes, colors, and display settings to suit their trading style.
Key Features
Multi-Timeframe Analysis : Detects supply and demand zones from up to five user-defined timeframes (e.g., 30m, 1H, 4H, 1D, 1W).
Zone Strength Filter : Filters zones based on the strength of price movements, ensuring only significant zones are displayed.
Customizable Display : Toggle supply and demand zones on/off, adjust colors, border styles, and label settings for clarity.
Dynamic Zone Extension : Extends zones to the right of the chart for better visibility, with adjustable extension length.
Zone Cleanup : Automatically removes zones when price breaks through them, keeping the chart clean and relevant.
Labels : Displays timeframe labels on zones for easy identification, with customizable size, color, and alignment.
How It Works
Supply Zones : Identified when a strong bearish candle follows a bullish or neutral candle, indicating potential selling pressure.
Demand Zones : Identified when a strong bullish candle follows a bearish or neutral candle, indicating potential buying pressure.
Zones are drawn as boxes, with the top and bottom based on key price levels (e.g., highs/lows or open prices).
The indicator uses a strength filter to ensure only significant zones (based on candle size ratios) are plotted.
Zones are updated dynamically, extending to the right by a user-defined number of bars and removed when price breaks through them.
Settings
S&D Zones Settings
Zone Strength Filter : Adjust the minimum candle size ratio (default: 1.8) to filter weaker zones.
Show Supply/Demand : Enable or disable supply and/or demand zones.
Supply/Demand Colors : Customize the fill and border colors for supply (default: red) and demand (default: green) zones.
Timeframes : Enable up to five timeframes (e.g., 30m, 1H, 4H, 1D, 1W) to analyze zones. Only zones from timeframes higher than the chart’s timeframe are displayed.
Display Settings
Zone Extension : Set how far zones extend to the right (in bars, default: 15).
Show Label: Toggle timeframe labels on zones.
Label Style : Customize label color, size (tiny, small, normal, large, huge), and alignment (horizontal/vertical).
Usage Tips
Use higher timeframes (e.g., 4H, 1D) for stronger, more reliable zones.
Combine with other indicators (e.g., support/resistance, trendlines) to confirm trade setups.
Adjust the Zone Strength Filter to reduce noise in volatile markets.
Enable labels to quickly identify the timeframe of each zone.
Notes
The indicator is overlayed on the price chart and supports up to 500 zones.
Zones are removed when price breaks above (supply) or below (demand), ensuring only active zones remain.
Works best on markets with clear price action, such as futures, forex, stocks, or cryptocurrencies.
Happy trading! 🚀

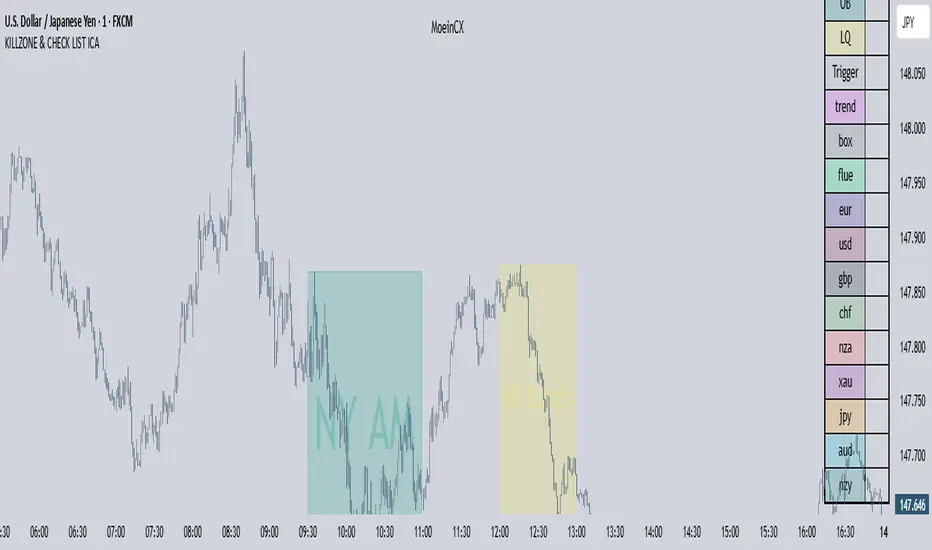
KILLZONE & CHECK LIST ICAKILLZONE & CHECK LIST ICA | The Inner Circle Alchemist
✨ Features:
Display of precise trading killzones on the chart
Marking the high, low, and mid-level of each killzone
Option to show/hide killzone names
Daily separators at custom times (e.g. 17:00 or 00:00)
Highlighting Midnight Open, 8:30 Open, and New York Stock Exchange Open
Display of previous day, week, and month highs & lows (optional)
A clean and practical trading checklist on the bottom-right of the chart
Visual customization, such as showing your name/brand on the chart
Clear indication of weekdays
⚡️ A perfect mix of professional tools & visual style to keep you one step ahead!
ID on All Platforms: TheInnerCircleAlchemist
#Forex #Trading #Indicator #Killzone #TradingChecklist #PriceAction #DayTrading #SwingTrading #SmartMoney #MarketStructure #TradingTools #ChartAnalysis #TechnicalAnalysis #ForexStrategy #TraderLife #ForexTrading

KILLZONE & CHECK LIST ICAKILLZONE & CHECK LIST | The Inner Circle Alchemist
✨ Features:
Display of precise trading killzones on the chart
Marking the high, low, and mid-level of each killzone
Option to show/hide killzone names
Daily separators at custom times (e.g. 17:00 or 00:00)
Highlighting Midnight Open, 8:30 Open, and New York Stock Exchange Open
Display of previous day, week, and month highs & lows (optional)
A clean and practical trading checklist on the bottom-right of the chart
Visual customization, such as showing your name/brand on the chart
Clear indication of weekdays
⚡️ A perfect mix of professional tools & visual style to keep you one step ahead!
ID on all platforms: TheInnerCircleAlchemist
#Forex #Trading #Indicator #Killzone #TradingChecklist #PriceAction #DayTrading #SwingTrading #SmartMoney #MarketStructure #TradingTools #ChartAnalysis #TechnicalAnalysis #ForexStrategy #TraderLife #ForexTrading
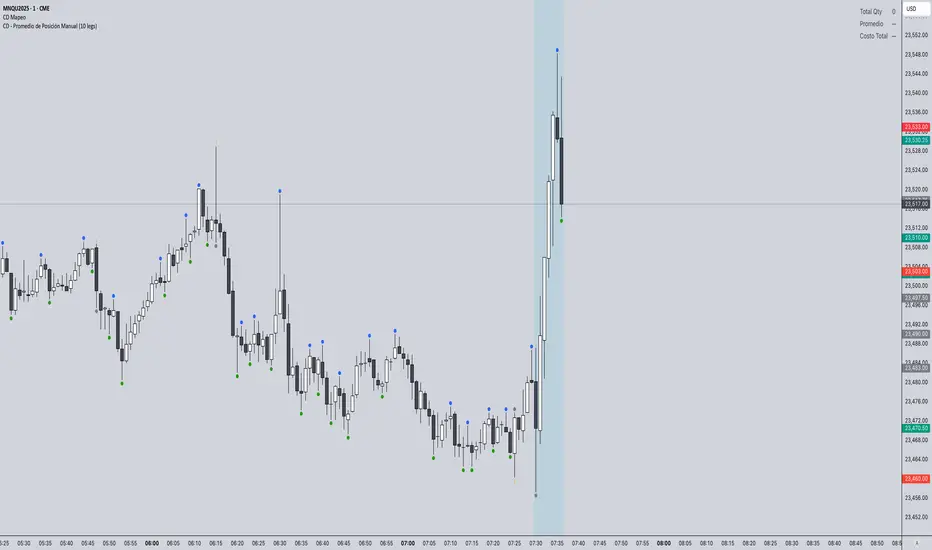
CD - Promedio de Posición ManualIndicador que muestra el precio promedio a medida que vas construyendo la posicion, util para hacer backtest.
Indicator that shows the average price as you build your position, useful for backtesting.
Market Order Risk CalculatorObviously the Long/Short Position tool does this, but when you are scalping, 10 - 15 seconds matters. What matters more than that is defined risk, you dont want your losses being scattered, 300 here 145 there, you want consistent risk to have consistent data.
What this does is when you are framing a trade, it provides a hands off tool that tells you exactly how many contracts to enter with, that way if you have bracket orders on, your stop will be exactly where you want it to be without going over your defined risk.

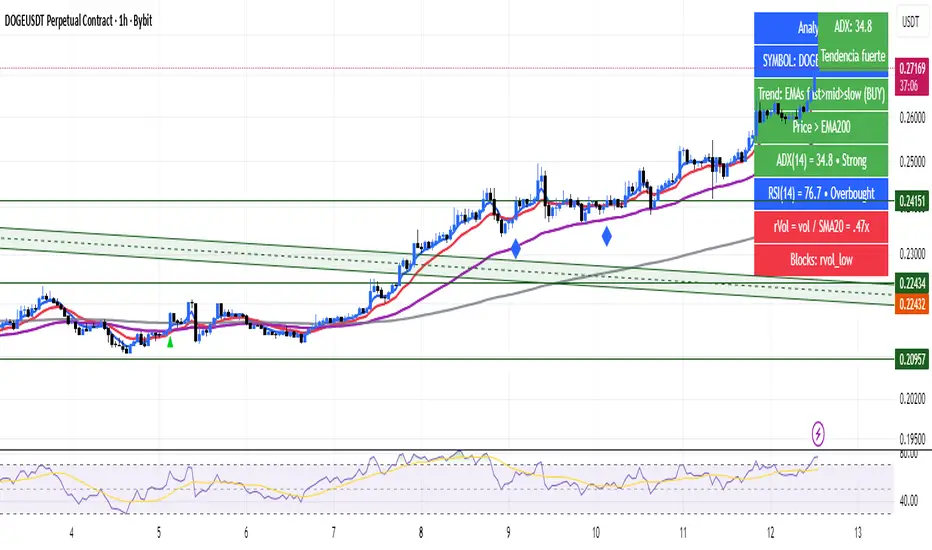
Analyst HUD — Side / ADX / RSI / rVol (bot thresholds)Analyst HUD — Side / ADX / RSI / rVol (bot thresholds)
A clean heads-up display that puts the essentials right on your chart:
✅ Side – quick trend bias (bullish/bearish)
✅ ADX – trend strength, color-coded
✅ RSI – momentum zones (overbought/oversold/neutral)
✅ rVol – relative volume vs average
Built with bot-style thresholds for instant clarity.
No signals, no clutter — just the key metrics you need to spot strong trends and momentum at a glance.
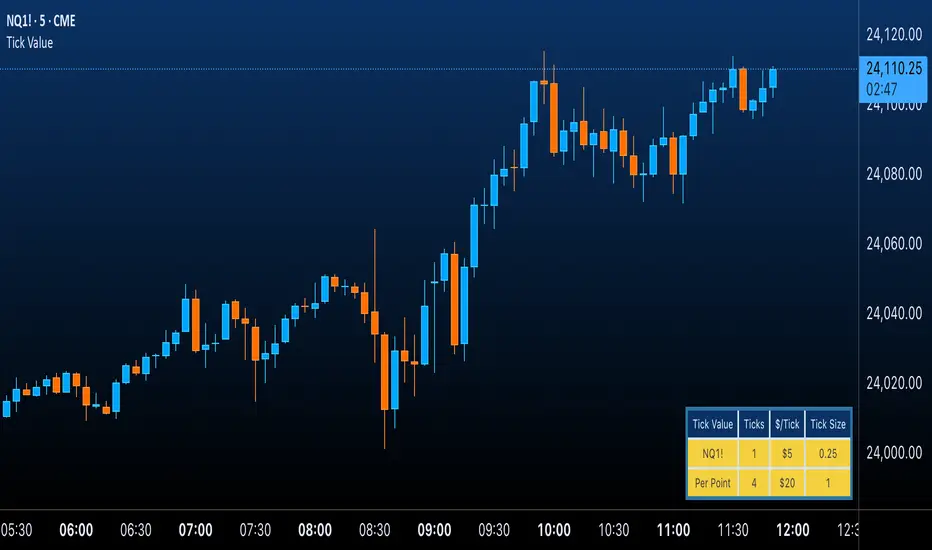
Futures Tick & Point Value [BoredYeti]Futures Tick & Point Value
This utility displays tick size, dollars per tick, and (optionally) a per-point row for the current futures contract.
Features
• Hardcoded $/tick map for common CME/NYMEX/CBOT/COMEX contracts
• Automatic fallback using pointvalue * mintick for any other symbol
• Table settings: adjustable position, text size, customizable colors
• Optional “Per Point” row showing ticks and $/point
Notes
• Contract specs can vary by broker/exchange and may change over time. Always confirm with official specifications.
• Educational tool only; not financial advice.
Intelligent Currency Breakout ChannelIndicator: Intelligent Currency Breakout Channel
This document provides a detailed explanation of the "Intelligent Currency Breakout Channel" indicator for TradingView.
1. Overview
The Intelligent Currency Breakout Channel is an advanced technical analysis tool designed to identify periods of price consolidation and signal potential breakouts. It automatically draws channels around ranging price action and utilizes sophisticated volume analysis to provide deeper insights into market sentiment. The indicator also includes a built-in logarithmic regression screener to help traders align their breakout signals with the broader market trend.
2. Key Features
Automatic Channel Detection: The indicator identifies periods of low volatility and automatically draws a containing channel (box) around the price action.
Breakout Signals: It generates clear visual alerts (▲ for bullish, ▼ for bearish) when the price closes decisively outside of a channel.
In-Depth Volume Analysis: Within each channel, the indicator plots volume as candlestick-like bars, offering three distinct modes: Total Volume, Buy/Sell Comparison, and Volume Delta. This helps traders gauge the strength and conviction behind price movements.
Real-time Sentiment Gauge: When a channel is active, a dynamic color-graded gauge appears on the right side of the chart. It visualizes the current volume delta momentum relative to its recent range, offering an at-a-glance sentiment reading.
Integrated Trend Screener: A secondary analysis tool based on logarithmic regression is included to determine the underlying trend direction (Up, Down, or Neutral), which can be used to filter breakout signals.
Fully Customizable: Users can extensively customize all parameters, from calculation lengths and breakout sensitivity to the visual appearance of every component.
3. How to Use
Channel Formation: Watch for the indicator to draw a new channel. This signifies that the market is in a consolidation or ranging phase. The formation of a channel itself can be an alertable event.
Volume Interpretation: Observe the volume bars inside the channel. An increase in volume as the price approaches the channel's upper or lower boundary can foreshadow a potential breakout. Use the Volume Display Mode to analyze if buying pressure (Comparison, Delta) or selling pressure is building.
Breakout Confirmation: A bullish breakout signal (▲) appears when the price closes above the channel's upper boundary. A bearish breakout signal (▼) appears when the price closes below the lower boundary. For higher-quality signals, enable the Strong Closes Only option.
Trend Confirmation (Screener): Use the screener's plot and background color to confirm the broader trend. For instance, you might choose to only take bullish breakout signals when the screener indicates an uptrend (green background) and bearish signals when it indicates a downtrend (red background).
Sentiment Gauge: The pointer on the gauge indicates current momentum. A pointer in the upper (green) section suggests bullish pressure, while a pointer in the lower (red) section suggests bearish pressure. This can provide additional confluence for a trade decision.
4. Settings and Inputs
Main Settings
Overlap Channels: If enabled, allows multiple channels to be drawn on the chart simultaneously, even if they overlap. When disabled, a new channel will only form if it doesn't intersect with an existing one.
Strong Closes Only: If enabled, a breakout is only triggered if the midpoint of the candle's body (average of open and close) is outside the channel. This helps filter out false signals caused by long wicks. If disabled, any close outside the channel triggers a breakout.
Normalization Length: The lookback period (in bars) used for price normalization. A higher value creates a more stable normalization but may be slower to react to recent price changes.
Box Detection Length: The lookback period used to detect the channel formation pattern. A lower value will result in more frequent channels but may be more sensitive to noise. A higher value will result in fewer, but potentially more significant, channels.
Volume Analysis
Show Volume Analysis: Toggles the visibility of the candlestick-like volume bars inside the channel.
Volume Display Mode:
Volume: Displays total volume as symmetrical bars around the channel's midline.
Comparison: Shows buying volume (green) above the midline and selling volume (red) below it.
Delta: Shows the net difference between buying and selling volume. Positive delta is shown above the midline, and negative delta is shown below.
Volume Delta Timeframe Source: The timeframe from which to source volume data for calculations. Using a lower timeframe can provide a more granular view of volume dynamics.
Volume Scaling: A multiplier that adjusts the vertical size of the volume bars relative to the channel's height.
Appearance
Volume Text Size: Sets the size of the volume data text displayed in the corners of the channel. Options: Tiny, Small, Medium, Large.
Bullish Color: The primary color for all bullish visual elements, including breakout signals and positive volume bars.
Bearish Color: The primary color for all bearish visual elements, including breakout signals and negative volume bars.
Screener Settings
Lookback Period: The number of bars used for the logarithmic regression calculation to determine the trend.
Screener Type:
Log Regression Channel: The signal is based on the slope of the entire regression channel over the lookback period. An upward sloping channel is bullish (1), and a downward sloping one is bearish (-1).
Logarithmic Regression: The signal is based on the most recent value of the regression line compared to its value 3 bars ago. This provides a more responsive measure of the immediate trend.
5. Alerts
You can set up the following alerts through the TradingView alerts panel:
New Channel Formed: Triggers when a new price consolidation channel is detected and drawn on the chart.
Bullish Breakout: Triggers when the price breaks out and closes above the upper boundary of a channel.
Bearish Breakout: Triggers when the price breaks out and closes below the lower boundary of a channel.
Is In Channel: Triggers on every bar that the price is currently trading inside an active channel.
Signal UP: Triggers when the Screener's signal turns bullish (1).
Signal DOWN: Triggers when the Screener's signal turns bearish (-1).

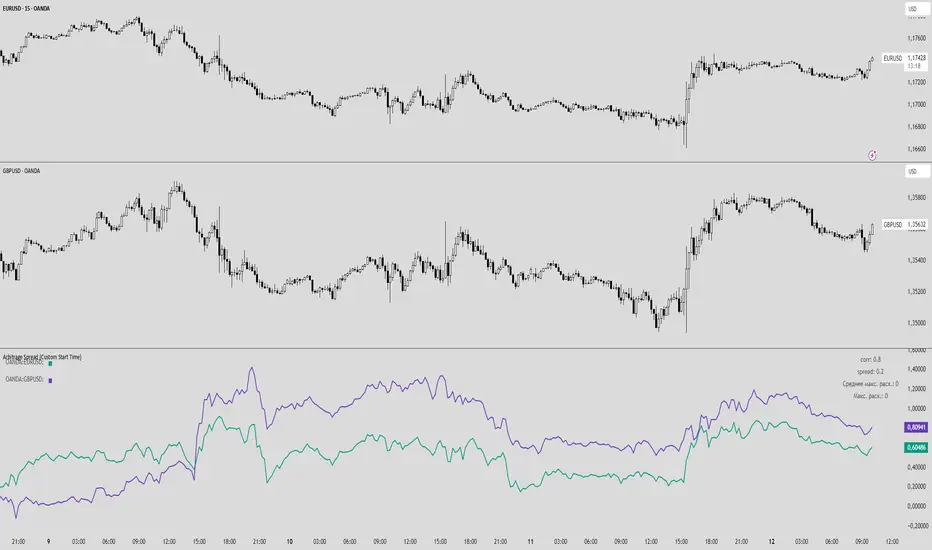
FXSArbitrage Spread (Custom Start Time)
This indicator analyzes the spread and correlation between two selected instruments or currency pairs.
Key Features:
Displays the percentage change of the two instruments in a separate chart (does not overlay the main chart).
Lines show the entire historical price movement of the selected instruments.
Calculates the current spread and correlation from a chosen date and time (default — last Monday 00:00).
Spread and corr values are rounded to two decimal places for convenience.
The top-right table displays:
corr — correlation coefficient between the instruments,
spread — current spread between the pairs,
Average max deviation for the period — manual input,
Maximum deviation for the entire period — manual input.
The top-left table shows the color of each pair for clarity.
Alerts can be set for specific corr and spread values.
Features:
Historical lines allow visual tracking of dynamics over the entire available period.
Current spread is calculated separately from the selected start time, allowing analysis of current conditions without affecting historical visualization.
Fully customizable: line colors, calculation period, start date/time for spread, manual statistical data.
AInfluence Manual Data Input Utility Indicator V101AInfluence (Manual Data Input Utility Indicator) V101
Overview
This utility indicator enables you to plot an external data series directly on your TradingView chart. It is designed for users who want to correlate custom datasets, such as sentiment analysis, economic data, or other external metrics, with price action.
Instructions
1. Add the indicator to your chart.
2. Go into the indicator's "Settings" panel.
3. Paste your pre-formatted data into the text input field.
Data Formatting Rules
The script requires a specific format for each data point, which consists of a numerical value and a timestamp
• Structure: Each data point must be on a new line.
• Limit: You can paste a maximum of 146 records.
Example Data:
93.1562,2025-09-06 00:59:11
94.9062,2025-09-06 01:59:21
93.4062,2025-09-06 02:59:18
95.2188,2025-09-06 03:59:31
93.4062,2025-09-06 04:59:21
91.4583,2025-09-06 05:58:51
93.7812,2025-09-06 06:59:17
The source code for this indicator is open and accessible.

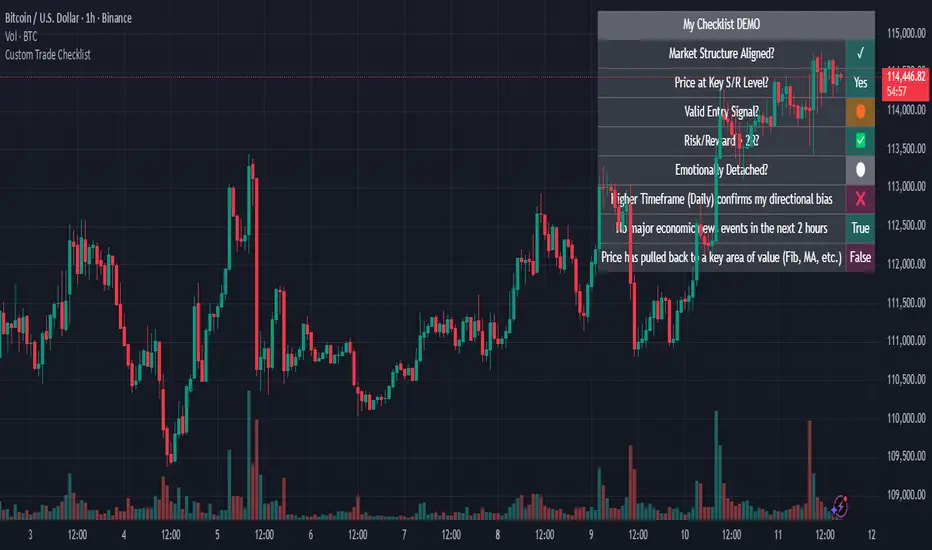
Custom Trade Checklist by [YSFX]# Custom Trade Checklist: Your On-Chart Trading Co-Pilot
## Overview
Ever taken a trade based on impulse, only to realize you forgot a key step in your analysis? The Custom Trade Checklist is a simple yet powerful on-chart utility designed to help you remain disciplined and consistent with your trading strategy.
By externalizing your trading plan into a visible, interactive checklist, you can reduce emotional decision-making and systematically verify your criteria before entering or exiting a trade. This tool acts as your personal co-pilot, ensuring you follow your rules on every single trade.
## Key Features
✅ Fully Customizable Rules: Define up to 10 unique checklist items tailored to your specific trading strategy. Examples include "Market Structure Aligned?", "RSI Oversold?", "News Events Checked?", or "Risk/Reward > 2:1?".
⚪ Dynamic Status Tracking: Use a simple dropdown menu in the settings to mark each rule with intuitive symbols like:
✅ / ✓ - Completed / True
❌ / ✕ - Failed / False
🟡 - Pending / Caution
⚪ - Neutral / Not Checked
And many more for complete flexibility.
📋 Clean & Minimalist Display: The checklist is presented in a clean, unobtrusive table that can be positioned in any corner of your chart, ensuring it provides guidance without cluttering your analysis.
⚙️ Flexible Configuration:
Choose the maximum number of entries to display.
Optionally hide disabled checklist items to keep your view focused on what's active.
Customize the table title to match your strategy (e.g., "Pre-Trade Checklist", "Swing Trade Rules").
🎨 Complete Color Control: Personalize every aspect of the table's appearance. You can independently set the colors for the title, text, background, border, and each individual status symbol to perfectly match your chart's theme.
## How to Use
Add the Indicator to your chart.
Open the Settings Panel by clicking the gear icon (⚙️) on the indicator.
Define Your Rules:
Go through Entry 1 to Entry 10.
For each rule you want to use, check the box to enable it.
In the text field, write your rule (e.g., "Price above 200 EMA").
Update Your Status: Before placing a trade, go back into the settings and update the status dropdown for each rule based on your analysis.
Customize Appearance:
Under the "General" tab, change the table title and position.
Under the "Colors" tab, adjust the colors to your liking.
## Who Is This For?
This tool is perfect for:
Discretionary Traders who need to enforce a consistent set of rules.
New Traders looking to build good habits and internalize their trading plan.
Systematic Traders who want a final pre-flight check before executing a trade.
Anyone working on improving their trading psychology and reducing impulsive actions.
This indicator does not generate signals or trading advice; it is a utility to support the trader's own process and discipline. We hope it helps you achieve greater consistency in your trading journey!