Hobbiecode - RSI + Close previous dayThis is a simple strategy that is working well on SPY but also well performing on Mini Futures SP500. The strategy is composed by the followin rules:
1. If RSI(2) is less than 15, then enter at the close.
2. Exit on close if today’s close is higher than yesterday’s high.
If you backtest it on Mini Futures SP500 you will be able to track data from 1993. It is important to select D1 as timeframe.
Please share any comment or idea below.
Have a good trading,
Ramón.
Pinescript

Hobbiecode - Five Day Low RSI StrategyThis is a simple strategy that is working well on SPY but also well performing on Mini Futures SP500. The strategy is composed by the followin rules:
1. If today’s close is below yesterday’s five-day low, go long at the close.
2. Sell at the close when the two-day RSI closes above 50.
3. There is a time stop of five days if the sell criterium is not triggered.
If you backtest it on Mini Futures SP500 you will be able to track data from 1993. It is important to select D1 as timeframe.
Please share any comment or idea below.
Have a good trading,
Ramón.

Hobbiecode - SP500 IBS + HigherThis is a simple strategy that is working well on SPY but also well performing on Mini Futures SP500. The strategy is composed by the followin rules:
1. Today is Monday.
2. The close must be lower than the close on Friday.
3. The IBS must be below 0.5.
4. If 1-3 are true, then enter at the close.
5. Sell 5 trading days later (at the close).
If you backtest it on Mini Futures SP500 you will be able to track data from 1993. It is important to select D1 as timeframe.
Please share any comment or idea below.
Have a good trading,
Ramón.

PSESS1 - Learn PineScript InputsThis is a script written exclusively for people who are trying to learn Pine Script.
PSESS stands for "Pine Script Educational Script Series" which is a series of scripts that helps Pine Script programmers in 2 ways:
1. Learn Pine Script at more depth by an interactive environment where they can immediately see the effects of any change in the pre-written code and also comparing different lines code having tiny differences so they can grasp the details.
2. Have this script open while coding in order to copy the line they find useful
Pine Script Library couldn't be used for this purpose since this script has educational aspect and needs to be executable individually.
This is Script 1 of PSESS and focuses on inputs in Pine Script.
The script is densly commented in order to make it understandable. here is the outline of the script:
1. Inputs that can be received through the indicator() function
2. 12 possible types of input
3. Input() function arguments: defval - title - tooltip - inline - group - confirm
4. The different display of tooltip when inputs are inline
5. Multiple price and time inputs (on single request or multiple requests)
6. What happens when title argument is not specified
7. References and key points from them

Number Formatting Indian/USAThis is a Pine script that helps traders format numbers in different ways to make it easier to read and display big numbers on TradingView.
this script is specifically to help other fellow pinecoder. Its not a indicator.
The above code is an example of how to format numbers in TradingView using two different formats: Indian and USA. The code defines a function called `formatNumber()` which takes two arguments: num (the number to format) and format (the format to use - either "Indian" or "USA").
If the "Indian" format is selected, the function rounds the number to the nearest crore, lakh or thousand and adds the appropriate suffix (i.e. "Cr", "Lac" or "K"). If the "USA" format is selected, the function rounds the number to the nearest billion, million or thousand and adds the appropriate suffix (i.e. "B", "M" or "K").
In both cases, the function then adds commas to the formatted number. The example usage shows how to call the `formatNumber()` function with a given number and format, and then plot the formatted number as a label on the chart.

Combined Strategy Trading Bot (RSI ADX 20SMA)Trading Bot V1, This code implements a combined trading strategy that uses several indicators and strategies to make buy and sell decisions in the market. The code is written in Pine Script™, which is a programming language used in the TradingView platform. By BraelonWhitfield.Eth
The strategy uses the Average Directional Movement Index (ADX) and the Pine SuperTrend indicator to identify trends and price movements in the market. The SuperTrend indicator is a popular technical analysis tool that helps to identify the direction of the current trend and provides entry and exit points for trades.
The strategy also uses the Relative Strength Index (RSI) to identify overbought and oversold conditions in the market. The RSI is a momentum indicator that measures the speed and change of price movements in the market.
The first part of the code defines the inputs for the ADX and DI Length, which are used to calculate the ADX and DI values. The dirmov() function is used to calculate the positive and negative directional indicators (plusDM and minusDM) based on the high and low prices. The truerange variable is then calculated using the True Range (TR) formula. Finally, the plus and minus variables are calculated using the smoothed moving average of the plusDM and minusDM values.
The adx() function is then used to calculate the ADX values based on the plus and minus variables. The Pine SuperTrend indicator is defined using the pine_supertrend() function. This function uses the high-low average (hl2) and the Average True Range (ATR) to calculate the upper and lower bands for the indicator. The direction of the current trend is then determined based on whether the current price is above or below the upper or lower bands.
The RSI values are then calculated using the ta.rsi() function, with the inputs for the close price and the RSI period. The overbought and oversold conditions are defined using the OB and OS inputs, which specify the threshold values for the RSI. The upTrend and downTrend variables are defined based on the direction of the Pine SuperTrend indicator.
The next part of the code defines the 20-period Simple Moving Average (SMA) using the ta.sma() function. The os and ob variables are then calculated based on the RSI values and the OB and OS inputs. The strategy.entry() function is used to define the buy and sell orders based on the upTrend and downTrend variables, as well as the Pine SuperTrend indicator, the 20-period SMA, and the os variable.
The final part of the code defines the Channel Breakout Strategy using the ta.highest() and ta.lowest() functions to calculate the upper and lower bounds of the channel. The strategy.entry() function is then used to define the buy and sell orders based on whether the current price is above or below the upper or lower bounds.
In summary, this code implements a combined trading strategy that uses several indicators and strategies to make buy and sell decisions in the market. The strategy is designed to identify trends and price movements in the market, as well as overbought and oversold conditions, to provide entry and exit points for trades. The strategy uses the Pine SuperTrend indicator, the ADX and DI indicators, the RSI, and the 20-period SMA, as well as the Channel Breakout Strategy to make informed trading decisions.

Dynamo
╭━━━╮
╰╮╭╮┃
╱┃┃┃┣╮╱╭┳━╮╭━━┳╮╭┳━━╮
╱┃┃┃┃┃╱┃┃╭╮┫╭╮┃╰╯┃╭╮┃
╭╯╰╯┃╰━╯┃┃┃┃╭╮┃┃┃┃╰╯┃
╰━━━┻━╮╭┻╯╰┻╯╰┻┻┻┻━━╯
╱╱╱╱╭━╯┃
╱╱╱╱╰━━╯
Overview
Dynamo is built to be the Swiss-knife for price-movement & strength detection, it aims to provide a holistic view of the current price across multiple dimensions. This is achieved by combining 3 very specific indicators(RSI, Stochastic & ADX) into a single view. Each of which serve a different purpose, and collectively provide a simple, yet powerful tool to gauge the true nature of price-action.
Background
Dynamo uses 3 technical analysis tools in conjunction to provide better insights into price movement, they are briefly explained below:
Relative Strength Index(RSI)
RSI is a popular indicator that is often used to measure the velocity of price change & the intensity of directional moves. RSI computes the relative strength of the current price by comparing the security’s bullish strength versus bearish strength for a given period, i.e. by comparing average gain to average loss.
It is a range bound(0-100) variable that generates a bullish reading if average gain is higher, and a bullish reading if average loss is higher. Values over 50 are generally considered bullish & values less than 50 indicate a bearish market. Values over 70 indicate an overbought condition, and values below 30 indicate oversold condition.
Stochastic
Stochastic is an indicator that aims to measure the momentum in the market, by comparing most recent closing price of the security to its price range for a given period. It is based on the assumption that price tends to close near the recent high in an up trend, and it closes near the recent low during a down trend.
It is also range bound(0-100), values over 80 indicate overbought condition and values below 20 indicate oversold condition.
Average Directional Index(ADX)
ADX is an indicator that can quantify trend strength, it is derived from two underlying indices, known as Directional Movement Index(DMI). +DMI represents strength of the up trend, and -DMI represents strength of the down trend, and ADX is the average of the two.
ADX is non-directional or trend-neutral, which means, it does not follow the direction of the price, instead ADX will rise only when there is a strong trend, it does not matter if it’s an up trend or a down trend. Typical ranges of ADX are 25-50 for a strong trend, anything below 25 is considered as no trend or weak trend. ADX can frequently shoot upto higher values, but it generally finds exhaustion levels around the 60-75 range.
About the script
All these indicators are very powerful tools, but just like any other indicator they have their limitations. Stochastic & ADX can generate false signals in volatile markets, meaning price wouldn’t always follow through with what’s being indicated. ADX may even fail to generate a signal in less volatile markets, simply because it is based on moving averages, it tends to react slower to price changes. RSI can also lose it’s effectiveness when markets are trending strong, as it can stay in the overbought or oversold ranges for an extended period of time.
Dynamo aims to provide the trader with a much broader perspective by bringing together these contrasting indicators into a single simplified view. When Stochastic becomes less reliable in highly volatile conditions, one can cross validate their deduction by looking at RSI patterns. When RSI gets stuck in overbought or oversold range, one can refer to ADX to get better picture about the current trend. Similarly, various combinations of rules & setups can be formulated to get a more deterministic view, when working with either of these indicators.
There many possible use cases for a tool like this, and it totally depends on how you want to use it. An obvious option is to use it to trigger signals only after it has been confirmed by two or more indicators, for example, RSI & Stochastic make a great combination for cross-over or cross-under strategies. Some of the other options include trend detection, strength detection, reversals or price rejection points, possible duration of a trend, and all of these can very easily be translated into effective entry and exit points for trades.
How to use it
Dynamo is an easy-to-use tool, just add it to your chart and you’re good to start with your market analysis. Output consists of three overlapping plots, each of which tackle price movement from a slightly different angle.
Stochastic: A momentum indicator that plots the current closing price in relation to the price-range over a given period of time.
Can be used to detect the direction of the price movement, potential reversals, or duration of an up/down move.
Plotted as grey coloured histograms in the background.
Relative Strength Index(RSI): RSI is also a momentum indicator that measures the velocity with which the price changes.
Can be used to detect the speed of the price movement, RSI divergences can be a nice way to detect directional changes.
Plotted as an aqua coloured line.
Average Directional Index(ADX): ADX is an indicator that is used to measure the strength of the current trend.
Can be used to measure how strong the price movement is, both up and down, or to establish long terms trends.
Plotted as an orange coloured line.
Features
Provides a well-rounded view of the market movement by amalgamating some of the best strength indicators, helping traders make better informed decisions with minimal effort.
Simplistic plots that aim to convey clean signals, as a result, reducing clutter on the chart, and hopefully in the trader's head too.
Combines different types of indicators into a single view, which leads to an optimised use of the precious screen real-estate.
Final Note
Dynamo is designed to be minimalistic in functionality and in appearance, as it is being built to be a general purpose tool that is not only beginner friendly, but can also be highly-configurable to meet the needs of pro traders.
Thresholds & default values for the indicators are only suggestions based on industry standards, they may not be an exact match for all markets & conditions. Hence, it is advisable for the user to test & adjust these values according their securities and trading styles.
The chart highlights one of many possible setups using this tool, and it can used to create various types of setups & strategies, but it is also worth noting that the usability & the effectiveness of this tool also depends on the user’s understanding & interpretation of the underlying indicators.
Lastly, this tool is only an indicator and should only be perceived that way. It does not guarantee anything, and the user should do their own research before committing to trades based on any indicator.

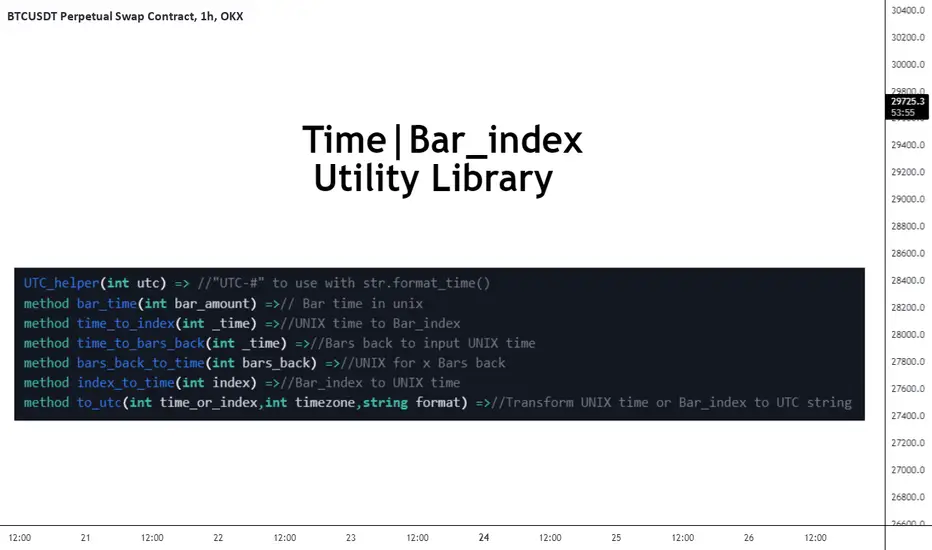
FrizLabz_Time_Utility_MethodsLibrary "FrizLabz_Time_Utility_Methods"
Some time to index and index to time helper methods made them for another library thought I would try to make
them as methods
UTC_helper(utc)
UTC helper function this adds the + to the positive utc times, add "UTC" to the string
and can be used in the timezone arg of for format_time()
Parameters:
utc : (int) | +/- utc offset
Returns: string | string to be added to the timezone paramater for utc timezone usage
bar_time(bar_amount)
from a time to index
Parameters:
bar_amount : (int) | default - 1)
Returns: int bar_time
time_to_index(_time)
from time to bar_index
Parameters:
_time : (int)
Returns: int time_to_index | bar_index that corresponds to time provided
time_to_bars_back(_time)
from a time quanity to bar quanity for use with .
Parameters:
_time : (int)
Returns: int bars_back | yeilds the amount of bars from current bar to reach _time provided
bars_back_to_time(bars_back)
from bars_back to time
Parameters:
bars_back
Returns: int | using same logic as this will return the
time of the bar = to the bar that corresponds to bars_back
index_time(index)
bar_index to UNIX time
Parameters:
index : (int)
Returns: int time | time in unix that corrresponds to the bar_index
to_utc(time_or_index, timezone, format)
method to use with a time or bar_index variable that will detect if it is an index or unix time
and convert it to a printable string
Parameters:
time_or_index : (int) required) | time in unix or bar_index
timezone : (int) required) | utc offset to be appled to output
format : (string) | default - "yyyy-MM-dd'T'HH:mm:ssZ") | the format for the time, provided string is
default one from str.format_time()
Returns: string | time formatted string
GET(line)
Gets the location paramaters of a Line
Parameters:
line : (line)
Returns: tuple
GET(box)
Gets the location paramaters of a Box
Parameters:
box : (box)
Returns: tuple
GET(label)
Gets the location paramaters and text of a Label
Parameters:
label : (label)
Returns: tuple
GET(linefill)
Gets line 1 and 2 from a Linefill
Parameters:
linefill : (linefill)
Returns: tuple
Format(line, timezone)
converts Unix time in time or index params to formatted time
and returns a tuple of the params as string with the time/index params formatted
Parameters:
line : (line) | required
timezone : (int) | default - na
Returns: tuple
Line(x1, y1, x2, y2, extend, color, style, width)
similar to line.new() with the exception
of not needing to include y2 for a flat line, y1 defaults to close,
and it doesnt require xloc.bar_time or xloc.bar_index, if no x1
Parameters:
x1 : (int) default - time
y1 : (float) default - close
x2 : (int) default - last_bar_time/last_bar_index | not required for line that ends on current bar
y2 : (float) default - y1 | not required for flat line
extend : (string) default - extend.none | extend.left, extend.right, extend.both
color : (color) default - chart.fg_color
style : (string) default - line.style_solid | line.style_dotted, line.style_dashed,
line.style_arrow_both, line.style_arrow_left, line.style_arrow_right
width
Returns: line
Box(left, top, right, bottom, extend, border_color, bgcolor, text_color, border_width, border_style, txt, text_halign, text_valign, text_size, text_wrap)
similar to box.new() but only requires top and bottom to create box,
auto detects if it is bar_index or time used in the (left) arg. xloc.bar_time and xloc.bar_index are not used
args are ordered by purpose | position -> colors -> styling -> text options
Parameters:
left : (int) default - time
top : (float) required
right : (int) default - last_bar_time/last_bar_index | will default to current bar index or time
depending on (left) arg
bottom : (float) required
extend : (string) default - extend.none | extend.left, extend.right, extend.both
border_color : (color) default - chart.fg_color
bgcolor : (color) default - color.new(chart.fg_color,75)
text_color : (color) default - chart.bg_color
border_width : (int) default - 1
border_style : (string) default - line.style_solid | line.style_dotted, line.style_dashed,
txt : (string) default - ''
text_halign : (string) default - text.align_center | text.align_left, text.align_right
text_valign : (string) default - text.align_center | text.align_top, text.align_bottom
text_size : (string) default - size.normal | size.tiny, size.small, size.large, size.huge
text_wrap : (string) default - text.wrap_auto | text.wrap_none
Returns: box
Label(x, y, txt, yloc, color, textcolor, style, size, textalign, text_font_family, tooltip)
similar to label.new() but only requires no args to create label,
auto detects if it is bar_index or time used in the (x) arg. xloc.bar_time and xloc.bar_index are not used
args are ordered by purpose | position -> colors -> styling -> text options
Parameters:
x : (int) default - time
y : (float) default - high or low | depending on bar direction
txt : (string) default - ''
yloc : (string) default - yloc.price | yloc.price, yloc.abovebar, yloc.belowbar
color : (color) default - chart.fg_color
textcolor : (color) default - chart.bg_color
style : (string) default - label.style_label_down | label.style_none
label.style_xcross,label.style_cross,label.style_triangleup,label.style_triangledown
label.style_flag, label.style_circle, label.style_arrowup, label.style_arrowdown,
label.style_label_up, label.style_label_down, label.style_label_left, label.style_label_right,
label.style_label_lower_left, label.style_label_lower_right, label.style_label_upper_left,
label.style_label_upper_right, label.style_label_center, label.style_square,
label.style_diamond
size : (string) default - size.normal | size.tiny, size.small, size.large, size.huge
textalign : (string) default - text.align_center | text.align_left, text.align_right
text_font_family : (string) default - font.family_default | font.family_monospace
tooltip : (string) default - na
Returns: label
Lines and Table for risk managementABOUT THIS INDICATOR
This is a simple indicator that can help you manage the risk when you are trading, and especially if you are leverage trading. The indicator can also be used to help visualize and to find trades within a suitable or predefined trading range.
This script calculates and draws six “profit and risk lines” (levels) that show the change in percentage from the current price. The values are also shown in a table, to help you get a quick overview of risk before you trade.
ABOUT THE LINES/VALUES
This indicator draws seven percentage-lines, where the dotted line in the middle represents the current price. The other three lines on top of and below the middle line shows the different levels of change in percentage from current price (dotted line). The values are also shown in a table.
DEFAULT VALUES AND SETTINGS
By default the indicator draw lines 0.5%, 1.0%, and 1.5% from current price (step size = 0.5).
The default setting for leverage in this indicator = 1 (i.e. no leverage).
The line closest to dotted line (current price) is calculated by step size (%) * leverage (x) = % from price.
Pay attention to the %-values in the table, they represent the distance from the current price (dotted line) to where the lines are drawn.
* Be aware! If you change the leverage, the distance from the closest lines to the dotted line showing the current price increase.
SETTINGS
1. Leverage: set the leverage for what you are planning to trade on (1 = no leverage, 2 = 2 x leverage, 5 = 5 x leverage...).
2. Stepsize is used to set the distance between the lines and price.
EXAMPLES WITH DIFFERENT SETTINGS
1) Leverage = 1 (no leverage, default setting) and step size 0.5 (%). Lines plotted at (0.5%, 1%, 1.5%, and –0.5%, –1%, –1,5%) from the current price.
2) Leverage = 3 and stepsize 0.5(%). Lines plotted at (1.5%, 3.0%, 4.5%, and –1.5%, –3.0%, –4.5%) from the current price.
3) Leverage = 3 and stepsize 1(%). Lines plotted at (3%, 6%, 9%, and –3%, –6%, –9%) from the current price.
The distance to the nearest line from the current price is always calculated by the formula: Leverage * step size (%) = % to the nearest line from the current price.

Trendly
╭━━━━╮╱╱╱╱╱╱╱╱╭┳╮
┃╭╮╭╮┃╱╱╱╱╱╱╱╱┃┃┃
╰╯┃┃┣┻┳━━┳━╮╭━╯┃┃╭╮╱╭╮
╱╱┃┃┃╭┫┃━┫╭╮┫╭╮┃┃┃┃╱┃┃
╱╱┃┃┃┃┃┃━┫┃┃┃╰╯┃╰┫╰━╯┃
╱╱╰╯╰╯╰━━┻╯╰┻━━┻━┻━╮╭╯
╱╱╱╱╱╱╱╱╱╱╱╱╱╱╱╱╱╭━╯┃
╱╱╱╱╱╱╱╱╱╱╱╱╱╱╱╱╱╰━━╯
About the script:
This script is an easy-to-use trend indicator, which is based on another popular indicator called "Supertrend" . The basic idea is very simple, i.e. to compute Average True Range(ATR) and use that as the basis for trend detection. The key difference lies in a custom trend detection method, that computes trends across different timeframes and projects them in a table view. The script also tries to improve the behaviour of the existing indicator by highlighting flat regions on the chart, indicating sideways market or potential trend reversals.
How to use it:
You can use it just like any other indicator, add it to your chart and start analysing market trends. Results can be interpreted as follows.
Indicator output is currently made up of two main components:
>> Trend Table:
Appears at the bottom right of your screen
Contains trend indicator for 9 different timeframes
Timeframes can be adjusted using indicator settings panel
Green Up Arrow --> Up Trend
Red Down Arrow --> Down Trend
>> Enhanced Supertrend:
Shows up as a line plot on the chart
Green line indicates up trend
Red line indicates down trend
White regions indicates slow moving markets or a potential trend reversal
Indicator can be used on any timeframe, it provides a view of current and historical market trend
Can be used as an indicator for entering/exiting trades
Can be used to build custom trading strategies

Selected Dates Filter by @zeusbottradingWe are presenting you feature for strategies in Pine Script.
This function/pine script is about NOT opening trades on selected days. Real usage is for bank holidays or volatile days (PPI, CPI, Interest Rates etc.) in United States and United Kingdom from 2020 to 2030 (10 years of dates of bank holidays in mentioned countries above). Strategy is simple - SMA crossover of two lengts 14 and 28 with close source.
In pine script you can see we picked US and GB bank holidays. If you add this into your strategy, your bot will not open trades on those days. You must make it a rule or a condition. We use it as a rule in opening long/short trades.
You can also add some of your prefered dates, here is just example of our idea. If you want to add your preffered days you can find them on any site like forexfactory, myfxbook and so on. But don’t forget to add function “time_tradingday ! = YourChoosedDate” as it is writen lower in the pine script.
Sometimes the date is substituted for a different day, because the day of the holiday is on Saturday or Sunday.
Made with ❤️ for this community.
If you have any questions or suggestions, let us know.
The script is for informational and educational purposes only. Use of the script does not constitutes professional and/or financial advice. You alone the sole responsibility of evaluating the script output and risks associated with the use of the script. In exchange for using the script, you agree not to hold zeusbottrading TradingView user liable for any possible claim for damages arising from any decision you make based on use of the script.

[-_-] Custom Type ExamplesDescription:
This script shows an example use of new Pinescript's feature called User Defined Types, which can be seen as analogue of from C++ or from Python. It is not an indicator for technical analysis, and serves only as an example of how to use the new feature mentioned above.
In the script I define 4 custom types and a custom initialisation function for each:
- Point (represents a coordinate with x -> bar_index, y -> price)
- Tria (creates a triangle using objects and objects as coordinates of 3 points)
- Path (creates a path-like object from an of )
- Trade (creates a visual representation of a Long/Short trade with set Take Profit and Stop Loss, and displays an info label with realized Profit/Loss)
I'd personally like to see this feature improved by adding methods (so that we could, for example, define functions inside a custom type), which could be an analogue of classes from other programming languages.

FrizBugLibrary "FrizBug"
Debug Tools | Pinescript Debugging Tool Kit
All in one Debugger - the benefit of wrapper functions to simply wrap variables or outputs and have the code still execute the same. Perfect for Debugging on Pine
str(inp)
Overloaded tostring like Function for all type+including Object Variables will also do arrays and matricies of all Types
Parameters:
inp : All types
Returns: string
print_label(str, x_offset, y, barstate, style, color, textcolor, text_align, size)
Label Helper Function - only needs the Str input to work
Parameters:
str :
x_offset : offset from last bar + or -
y : price of label
barstate : barstate built in variable
style : label style settin7
color : color setting
textcolor : textcolor
text_align : text align setting
size : text_sise
Returns: label
init()
initializes the database arrays
Returns: tuple | 2 matrix (1 matrix is varip(live) the other is reagular var (Bar))
update(log, live, live_console, log_console, live_lbl, log_lbl)
Put at the very end of your code / This updates all of the consoles
Parameters:
log : This matrix is the one used for Bar updates
live : This matrix is the one used for Real Time updates
live_console : on_offs for the consoles and lbls - call in the update function
log_console : on_offs for the consoles and lbls - call in the update function
live_lbl : on_offs for the consoles and lbls - call in the update function
log_lbl : on_offs for the consoles and lbls - call in the update function
Returns: void
log(log, inp, str_label, off, rows, index_cols, bars_back)
Function Will push to the Console offset to the right of Current bar, This is the main Console - it has 2 Feeds left and right (changeable)"
Parameters:
log : Matrix - Log or Live
inp : All types
str_label : (optional) This input will label it on the feed
off : Useful for when you don't want to remove the function"
rows : when printing or logging a matrix this will shorten the output will show last # of rows"
index_cols : When printing or logging a array or matrix this will shorten the array or the columns of a matrix by the #"
bars_back : Adjustment for Bars Back - Default is 1 (0 for barstate.islast)"
Returns: inp - all types (The log and print functions can be used as wrapper functions see usage below for examples)
Print(log, str_label, off, bars_back)
Function can be used to send information to a label style Console, Can be used as a wrapper function, Similar to str.format use with str()
Parameters:
log :
str_label : (optional) Can be used to label Data sent to the Console
off : Useful for when you don't want to remove the function
bars_back : Adjustment for Bars Back - Default is 1 (0 for barstate.islast)
Returns: string
print(inp, str_label, off, bars_back)
This Function can be used to send information to a label style Console, Can be used as a wrapper function, Overload print function
Parameters:
inp : All types
str_label : string (optional) Can be used to label Data sent to the Console
off : Useful for when you don't want to remove the function
bars_back : Adjustment for Bars Back - Default is 1 (0 for barstate.islast)
Returns: inp - all types (The log and print functions can be used as wrapper functions see usage below for examples)
Credits:
@kaigouthro - for the font library
@RicardoSantos - for the concept I used to make this
Thanks!
Use cases at the bottom
iMoku (Ichimoku Complete Tool) - The Quant Science iMoku™ is a professional all-in-one solution for the famous Ichimoku Kinko Hyo indicator.
The algorithm includes:
1. Backtesting spot
2. Visual tool
3. Auto-trading functions
With iMoku you can test four different strategies.
Strategy 1: Cross Tenkan Sen - Kijun Sen
A long position is opened with 100% of the invested capital ($1000) when "Tenkan Sen" crossover "Kijun Sen".
Closing the long position on the opposite condition.
There are 3 different strength signals for this strategy: weak, normal, strong.
Weak : the signal is weak when the condition is true and the price is above the 'Kumo'
Normal : the signal is normal when the condition is true and the price is within the 'Kumo'
Strong : the signal is strong when the condition is true and the price is below the 'Kumo'
Strategy 2: Cross Price - Kijun Sen
A long position is opened with 100% of the invested capital ($1000) when the price crossover the 'Kijun Sen'.
Closing the long position on the opposite condition.
There are 3 different strength signals for this strategy: weak, normal, strong.
Weak : the signal is weak when the condition is true and the price is above the 'Kumo'
Normal : the signal is normal when the condition is true and the price is inside the 'Kumo'
Strong : the signal is strong when the condition is true and the price is below the 'Kumo'
Strategy 3: Kumo Breakout
A long position is opened with 100% of the invested capital ($1000) when the price breakup the 'Kumo'.
Closing the long position with a percentage stop loss and take profit on the invested capital.
Strategy 4: Kumo Twist
A long position is opened with 100% of the invested capital ($1000) when the 'Kumo' goes from negative to positive (called "Twist").
Closing the long position on the opposite condition.
There are 2 different strength signals for this strategy: weak, and strong.
Weak : the signal is weak when the condition is true and the price is above the 'Kumo'
Strong : the signal is strong when the condition is true and the price is below the 'Kumo'
This script is compliant with algorithmic trading.
You can use this script with trading terminals such as 3Commas or CryptoHopper. Connecting this script is very easy.
1. Enter the user interface
2. Select and activate a strategy
3. Copy your bot's links into the dedicated fields
4. Create and activate alert
Disclaimer: algorithmic trading involves risk, the user should consider aspects such as slippage, liquidity and costs when evaluating an asset. The Quant Science is not responsible for any kind of damage resulting from use of this script. By using this script you take all the responsibilities and risks.

FUNCTION: Limited Historical Data WorkaroundFUNCTION: Limited Historical Data Workaround
If you are working with bitcoin weekly charts, or any other ticker with a low amount of price history this function may help you out. For example you want to apply indicators to some shitcoin that just launched? This can help you.
It can be frustrating to use certain built-ins since they will only give an output once the full lookback length is available. This function allows you to avoid that situation and start plotting things with almost no history whatsoever!
In this example code we do it by utilizing a replacement for the built in pine SMA function. This function allows us to pass a series instead of just a simple int to the length variable of the SMA. This can be achieved with all the pine built ins and I believe @pinecoders has a publication already detailing many of them with full coded examples.
Then we replace the length of the SMA with the custom history function. It checks to see if the current bar index is less than the length of the function. Then if it is, it changes the length to the bar index allowing us to get plots and series earlier than otherwise possible.

Symbol InfoFor those who likes clean chart:
Adjustable Symbol ticker and timeframe( AKA watermark) script is here.
1: You can place Symbol ticker and timeframe info anywhere on the chart.
Also you can hide one of them or both.
Position:
Horizontal options: Left Center Right
Vertical options: Top Middle Bottom
Size: Tiny Smal Normal Large Huge Auto
Color is adjustable. Background is optional too.
2: Even more cool part is you can add 2 different custom texts that can switch. (Idea from Pinecoders original script)
You don't have to use text function and reposition it everytime, your message will always stays at one place.
Let the chart deliver your message.
I put my favourite trading slangs there:
1. Do Your Own Research (DYOR)
2. Not a Financial Advice ( NFA)

No Active BarThis is probably the only script on TradingView that's clinically proven to lower your blood pressure!***
This script in conjunction with some chart settings changes can completely hide the active candle, only showing historic candles, thus, reducing risk of cardiac arrest and or panic attack.
What to do:
0. Make sure you are using a candlestick chart or this script won't work properly
1. Right click the chart and select "Settings..."
2. Select "Symbol" under the "Chart Settings" menu
3. Disable every item EXCEPT for the "Body"
4. Click on the boxes next to "Body" to access the color picker then change both box's transparency settings down to 0
(the script only colors closed bars, so the active bar will be present just transparent)
5. Right click on the price scale on the far left or far right side of the screen and hover the mouse over "Labels". If any selections have a check mark next to them click them to disable them (especially the "Ask & Bid" price setting since it tracks current price)
That's it! Instead of wicks the High & Low prices are plotted above and below the candles using a step line. It looks a bit strange at first but you'll get used to it. Check out the indicator settings to change the color and style of the High & Low lines.
***The statement could prove true for some but is mostly complete bullshit

Level 1 - Learn to code simply - PineScriptThe goal of this script is honestly to help everyone learn about trading with bots and algos.
At least, to get started.
Level 1:
10 lines of code.
learn to plot 2 moving averages on your chart.
learn to create a signal from a crossover.
learn the very basics of Pine Script algo.

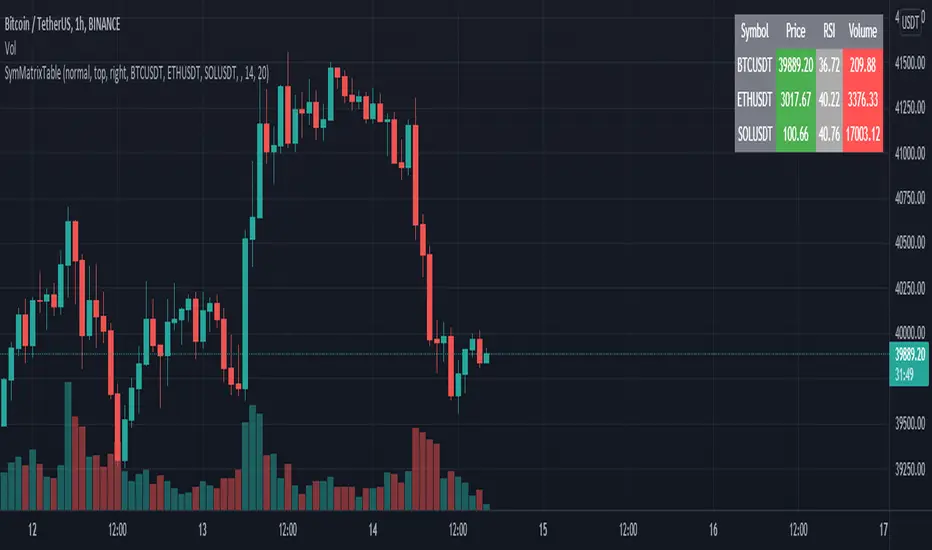
SymMatrixTableSimple Example Table for Displaying Price, RSI, Volume of multiple Tickers on selected Timeframe
Displays Price, RSI and Volume of 3 Tickers and Timeframe selected by user input
Conditional Table Cell coloring
Price color green if > than previous candle close and red if < previous candle close
RSI color green if < 30 and red if > 70 (RSI14 by default)
Volume color green if above average volume and red if less than that (SMA20 volume by default)
Can turn on/off whole table, header columns, row indices, or select individual columns or rows to show/hide
// Example Mixed Type Matrix To Table //
access the simple example script by uncommenting the code at the end
Basically I wanted to have the headers and indices as strings and the rest of the matrix for the table body as floats, then conditional coloring on the table cells
And also the functionality to turn rows and columns on/off from table through checkboxes of user input
Before I was storing each of the values separately in arrays that didn't have a centralized way of controlling table structure
so now the structure is :
- string header array, string index array
- float matrix for table body
- color matrix with bool conditions for coloring table cells
- bool checkboxes for controlling table display
Study forloop Star Triangle'Study forloop' pinescript Program to print star Triangle
The Program Logic
For example, the following Pinescript programme will need two nested for loops. The outer forloop is for rows and the inner forloop is for columns or stars. to create a triangle shape.

Invisible FriendLooking into a question from user Alex100, i realized many people do want some kind of values displayed on chart when they hover the mouse over different bars.
As pinescript does not have any feature like pop up box, the only way is to plot a line and than see indicator values at top left. So when mouse is moved around the value displayed changes. As we just need the value, we do not want to clutter the chart with another line.
Using display.none will hide the value from indicator value also
Using color.white will also color the indicator value to white, making it invisible
So the solution is very simple, and requires a bit of creativity. We create an invisible line, in any color we like :)
This indicator is a tutorial on how to display indicator values without the line showing up and also this can be implemented as displaying data for each bar on mouse hover.
-----
Check My Public Creations In The Meantime:
Buy Monday Exit Tuesday with StopLoss and TakeProfit
Close Combination Lock Style Visual Appeal Indicator
High-Low Box between Earnings with ability to Add Custom Boxes

EMA Cross + Divergence strategy (Div. signals by The Divergent)A sample strategy demonstrating the usage of The Divergent divergence indicator and The Divergent Library .
The Divergent is an advanced divergence indicator which you can easily incorporate into your own strategies.
In order to use this strategy (and to use the signals in your own strategy), you need to have the Pro version of The Divergent applied to your chart.
For more information, please see the comments inlined in the code.

The Divergent LibraryLibrary "TheDivergentLibrary"
The Divergent Library is only useful when combined with the Pro version of The Divergent - Advanced divergence indicator . This is because the Basic (free) version of The Divergent does not expose the "Divergence Signal" value.
Usage instructions:
1. Create a new chart
2. Add The Divergent (Pro) indicator to your chart
3. Create a new strategy, import this library, add a "source" input, link it to "The Divergent: Divergence Signal", and use the library to decode the divergence signals from The Divergent (You can find example strategy code published in our profile)
4. Act on the divergences signalled by The Divergent
---
isRegularBullishEnabled(context) Returns a boolean value indicating whether Regular Bullish divergence detection is enabled in The Divergent.
Parameters:
context : The context of The Divergent Library.
Returns: A boolean value indicating whether Regular Bullish divergence detection is enabled in The Divergent.
isHiddenBullishEnabled(context) Returns a boolean value indicating whether Hidden Bullish divergence detection is enabled in The Divergent.
Parameters:
context : The context of The Divergent Library.
Returns: A boolean value indicating whether Hidden Bullish divergence detection is enabled in The Divergent.
isRegularBearishEnabled(context) Returns a boolean value indicating whether Regular Bearish divergence detection is enabled in The Divergent.
Parameters:
context : The context of The Divergent Library.
Returns: A boolean value indicating whether Regular Bearish divergence detection is enabled in The Divergent.
isHiddenBearishEnabled(context) Returns a boolean value indicating whether Hidden Bearish divergence detection is enabled in The Divergent.
Parameters:
context : The context of The Divergent Library.
Returns: A boolean value indicating whether Hidden Bearish divergence detection is enabled in The Divergent.
getPivotDetectionSource(context) Returns the 'Pivot Detection Source' setting of The Divergent. The returned value can be either "Oscillator" or "Price".
Parameters:
context : The context of The Divergent Library.
Returns: One of the following string values: "Oscillator" or "Price".
getPivotDetectionMode(context) Returns the 'Pivot Detection Mode' setting of The Divergent. The returned value can be either "Bodies" or "Wicks".
Parameters:
context : The context of The Divergent Library.
Returns: One of the following string values: "Bodies" or "Wicks".
isLinked(context) Returns a boolean value indicating the link status to The Divergent indicator.
Parameters:
context : The context of The Divergent Library.
Returns: A boolean value indicating the link status to The Divergent indicator.
init(firstBarSignal, displayLinkStatus, debug) Initialises The Divergent Library's context with the signal produced by The Divergent on the first bar. The value returned from this function is called the "context of The Divergent Library". Some of the other functions of this library requires you to pass in this context.
Parameters:
firstBarSignal : The signal from The Divergent indicator on the first bar.
displayLinkStatus : A boolean value indicating whether the Link Status window should be displayed in the bottom left corner of the chart. Defaults to true.
debug : A boolean value indicating whether the Link Status window should display debug information. Defaults to false.
Returns: A bool array containing the context of The Divergent Library.
processSignal(signal) Processes a signal from The Divergent and returns a 5-tuple with the decoded signal: [ int divergenceType, int priceBarIndexStart, int priceBarIndexEnd, int oscillatorBarIndexStart, int oscillatorBarIndexEnd]. `divergenceType` can be one of the following values: na → No divergence was detected, 1 → Regular Bullish, 2 → Regular Bullish early, 3 → Hidden Bullish, 4 → Hidden Bullish early, 5 → Regular Bearish, 6 → Regular Bearish early, 7 → Hidden Bearish, 8 → Hidden Bearish early.
Parameters:
signal : The signal from The Divergent indicator.
Returns: A 5-tuple with the following values: [ int divergenceType, int priceBarIndexStart, int priceBarIndexEnd, int oscillatorBarIndexStart, int oscillatorBarIndexEnd].
