Simple SMA Strategy Backtest Part 5Simple SMA strategy
In this stream, we will create an intraday trade cap.
WARNING:
- For purpose educate only
- This script to change bars colors
Stream:
www.tradingview.com
Pine

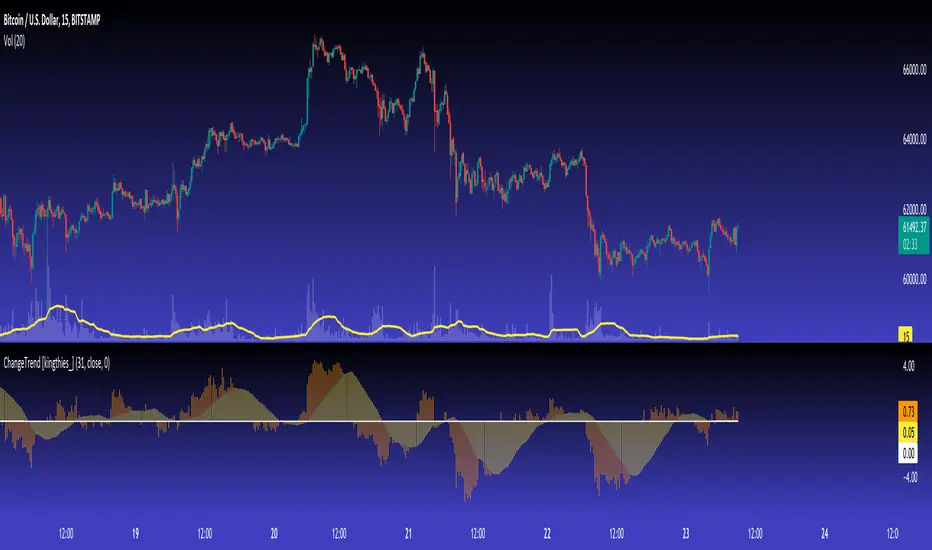
ChangeTrend [kingthies_]% X Change Over Y Amount of Time
AKA "ChangeTrend"
Published by user Eric Thies on 9/3/2020
Description
Relatively simple script that is measuring the performance of the input over the previous y # bars.
The EMA appears to make troughs and peaks easy to see coming / look at as they happen.
Interpretation:
Orange Histogram Represents the immediate % Change
Yellow Histogram represents the overall trend of such as an SMA of the same Y # of bars.
Cheers,
Barssince Context TestThis is just published for visibility as a public service until the Pine devs are able to fix or document this behavior. The barssince() function returns different values when inside a conditional context. As long as it can be documented (and relied upon), this could be a pretty cool feature, but right now this is now how I read the help documentation to describe the function's intended behavior.
Anyway, in the script you'll see that test and test2 agree on red bars, but on green bars test gets a much lower value, which was pretty shocking to me until I traced down this particular cause within my larger script.

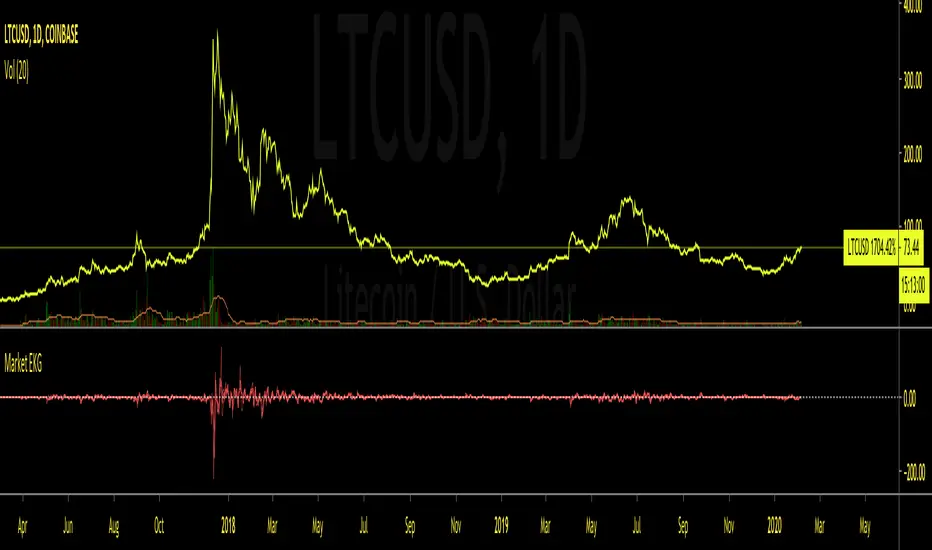
Market EKGShort Summary
This indicator takes the differences in the previous 4 period OHLC inputs, and compares them to the previously closed candle input. The difference is then placed into an oscillator that when all four inputs are scrolled back on, shows an EKG appearing oscillator / volatility measure for traders to use on indexes, tickers and markets that do not allow typical volume based indicators.
Full Summary
Named for its similar appearance to an EKG medical chart, this script takes the difference in relative averages of previous periods in a trend , and compares it to the most recent period input. This can be used as a price based volatility measure, useful in markets that may be limited by no valume measures or other indexes where volatility is useful to meeasure but will not allow volume initializations.
Steps taken
Taking Previous Period OHLC
Taking Previous 3 Periods OHLC Avgs
Difference Between #1 & #2 (Comparing most recent confirmation to relative trend
Plot Results
This RSI Script is intended for public use and can be shared / implemented as needed
Questions? I do not monitor my TradingView inbox. See email address in signature at the bottom of this page for contact information.
Use this script and its calculations as needed! No permission required.
Cheers,
RSI Divergence (Pine v4)Summary
Script highlights the divergences in RSI worth taking notice of. By comparing current envionment to relative sample we can see more than
the standard divergences that many catch through analysis. This framework aims to remove the bias or noise many see when looking for any supporting
evidence to their given emotion on a market.
Step-by-Step Walkthrough
Calculates RSI
Sets Divergence Framework
-------> a. Defining variable values, mandatory in Pine 4)
-------> b. Identify Divergences --> "If bar with lowest / highest is current bar, use it's value"
Compare high of current bar being examined with previous bar's high --> "If curr bar high is higher than the max bar high in the lookback window range"
Finds pivot point with at least 2 right candles with lower value
Finds pivot point with at least 2 right candles with lower value
Plot
Set Alerts
This RSI Script is intended for public use and can be shared / implemented as needed
Questions? I do not monitor my TradingView inbox. See email address in signature at the bottom of this page for contact information.

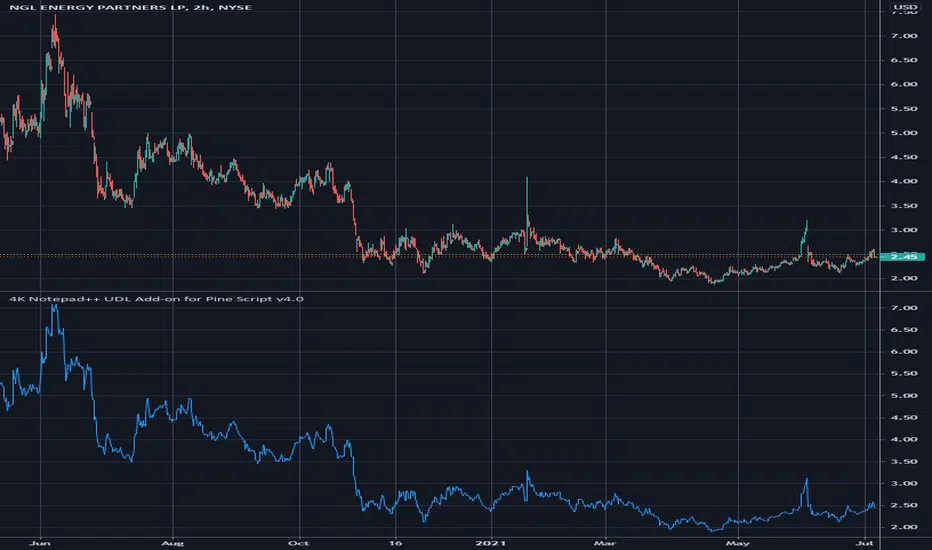
4K Notepad++ UDL Add-on for Pine Script v4.0FIRST OF ALL, THIS NOT AN INDICATOR! This is in XML format as a "utilitarian developer tool add-on" for Notepad++ editor for viewing Pine Script on 4K screens, but 4K isn't REQUIRED to use this.
For all Notepad++ enthusiasts out there utilizing Pine Script, I present a UDL(User Defined Language)... for Notepad++... for Pine Script v4.0... on 4K LCDs.
This is only for a dark background in Notepad++ editor, FYI. I would also like to mention, I used a 42" 4K LCD at this time of initial publication.
NOTICE: Please be sure to strip the "//" from this code on every line where the XML is commented with Pine Script comment operators(//) before saving to drive as an XML(*.xml) file. This may be done easily within the Pine Editor using ' CTRL + / ' after a click/drag selection of the bulk XML code. Pine Script commenting will then be stripped out of the XML following after the beginning/closing tags and .
The entire section below entitled "Notepad++ UDL INSTALLATION INSTRUCTIONS" is not required for importation into Notepad++. These are just HOW TOs concerning export/configuration in Notepad++ in the XML comments , and will be ignored if it's included during the import procedure, no worries.
I will update this as PSv4.0 evolves and time provides itself to me. Any anomalies discovered, please respectfully contact me privately via TV chat to discuss any ideas/concerns.
With all that aforementioned said, I believe this will be very useful to Pine Script developers who use Notepad++ editor in tandem with Pine Editor, further unleashing the "Power of Pine" on this planet.
NOTICE: Copy pasting bandits who may be having nefarious thoughts, DO NOT attempt this, because this may violate Tradingview's terms, conditions and/or house rules. "WE" are always watching the TV community vigilantly for mischievous behaviors and actions that exploit well intended authors for the purpose of unscrupulously increasing brownie points in reputation scores. Hiding behind a "protected" wall may not protect you from investigation and account penalization by TV staff. Be respectful, and don't just throw a meaningless feature in there branding it as "your" gizmo. Fair enough? Alrighty then... I firmly believe in "innovating" future state-of-the-art indicators, and please contact me if you wish to do so.
The comments section below is solely just for commenting and other remarks, ideas, compliments, etc... regarding only this indicator, not others. When available time provides itself, I will consider your inquiries, thoughts, and concepts presented below in the comments section if you do have any questions or comments regarding this indicator. When my indicators achieve more prevalent use by TV members, I may implement more ideas when they present themselves as worthy additions. As always, "Like" it if you simply just like it with a proper thumbs up, and also return to my scripts list occasionally for additional postings. Have a profitable future everyone!

How to avoid repainting when using security() - PineCoders FAQNOTE
The non-repainting technique in this publication that relies on bar states is now deprecated, as we have identified inconsistencies that undermine its credibility as a universal solution. The outputs that use the technique are still available for reference in this publication. However, we do not endorse its usage. See this publication for more information about the current best practices for requesting HTF data and why they work.
This indicator shows how to avoid repainting when using the security() function to retrieve information from higher timeframes.
What do we mean by repainting?
Repainting is used to describe three different things, in what we’ve seen in TV members comments on indicators:
1. An indicator showing results that change during the realtime bar, whether the script is using the security() function or not, e.g., a Buy signal that goes on and then off, or a plot that changes values.
2. An indicator that uses future data not yet available on historical bars.
3. An indicator that uses a negative offset= parameter when plotting in order to plot information on past bars.
The repainting types we will be discussing here are the first two types, as the third one is intentional—sometimes even intentionally misleading when unscrupulous script writers want their strategy to look better than it is.
Let’s be clear about one thing: repainting is not caused by a bug ; it is caused by the different context between historical bars and the realtime bar, and script coders or users not taking the necessary precautions to prevent it.
Why should repainting be avoided?
Repainting matters because it affects the behavior of Pine scripts in the realtime bar, where the action happens and counts, because that is when traders (or our systems) take decisions where odds must be in our favor.
Repainting also matters because if you test a strategy on historical bars using only OHLC values, and then run that same code on the realtime bar with more than OHLC information, scripts not properly written or misconfigured alerts will alter the strategy’s behavior. At that point, you will not be running the same strategy you tested, and this invalidates your test results , which were run while not having the additional price information that is available in the realtime bar.
The realtime bar on your charts is only one bar, but it is a very important bar. Coding proper strategies and indicators on TV requires that you understand the variations in script behavior and how information available to the script varies between when the script is running on historical and realtime bars.
How does repainting occur?
Repainting happens because of something all traders instinctively crave: more information. Contrary to trader lure, more information is not always better. In the realtime bar, all TV indicators (a.k.a. studies ) execute every time price changes (i.e. every tick ). TV strategies will also behave the same way if they use the calc_on_every_tick = true parameter in their strategy() declaration statement (the parameter’s default value is false ). Pine coders must decide if they want their code to use the realtime price information as it comes in, or wait for the realtime bar to close before using the same OHLC values for that bar that would be used on historical bars.
Strategy modelers often assume that using realtime price information as it comes in the realtime bar will always improve their results. This is incorrect. More information does not necessarily improve performance because it almost always entails more noise. The extra information may or may not improve results; one cannot know until the code is run in realtime for enough time to provide data that can be analyzed and from which somewhat reliable conclusions can be derived. In any case, as was stated before, it is critical to understand that if your strategy is taking decisions on realtime tick data, you are NOT running the same strategy you tested on historical bars with OHLC values only.
How do we avoid repainting?
It comes down to using reliable information and properly configuring alerts, if you use them. Here are the main considerations:
1. If your code is using security() calls, use the syntax we propose to obtain reliable data from higher timeframes.
2. If your script is a strategy, do not use the calc_on_every_tick = true parameter unless your strategy uses previous bar information to calculate.
3. If your script is a study and is using current timeframe information that is compared to values obtained from a higher timeframe, even if you can rely on reliable higher timeframe information because you are correctly using the security() function, you still need to ensure the realtime bar’s information you use (a cross of current close over a higher timeframe MA, for example) is consistent with your backtest methodology, i.e. that your script calculates on the close of the realtime bar. If your system is using alerts, the simplest solution is to configure alerts to trigger Once Per Bar Close . If you are not using alerts, the best solution is to use information from the preceding bar. When using previous bar information, alerts can be configured to trigger Once Per Bar safely.
What does this indicator do?
It shows results for 9 different ways of using the security() function and illustrates the simplest and most effective way to avoid repainting, i.e. using security() as in the example above. To show the indicator’s lines the most clearly, price on the chart is shown with a black line rather than candlesticks. This indicator also shows how misusing security() produces repainting. All combinations of using a 0 or 1 offset to reference the series used in the security() , as well as all combinations of values for the gaps= and lookahead= parameters are shown.
The close in the call labeled “BEST” means that once security has reached the upper timeframe (1 day in our case), it will fetch the previous day’s value.
The gaps= parameter is not specified as it is off by default and that is what we need. This ensures that the value returned by security() will not contain na values on any of our chart’s bars.
The lookahead security() to use the last available value for the higher timeframe bar we are using (the previous day, in our case). This ensures that security() will return the value at the end of the higher timeframe, even if it has not occurred yet. In our case, this has no negative impact since we are requesting the previous day’s value, with has already closed.
The indicator’s Settings/Inputs allow you to set:
- The higher timeframe security() calls will use
- The source security() calls will use
- If you want identifying labels printed on the lines that have no gaps (the lines containing gaps are plotted using very thick lines that appear as horizontal blocks of one bar in length)
For the lines to be plotted, you need to be on a smaller timeframe than the one used for the security() calls.
Comments in the code explain what’s going on.
Look first. Then leap.

Dragon-Bot - Default ScriptDragon-Script is a framework to make it as easy as possible to test your own strategies and set alerts for external execution bots. This is the alerts version of the script.
The script has many features build in, like:
1) A ping/pong mechanism between longs and shorts
2) A stop-loss
3) Trailing Stops with several ways to calculate them.
4) 2 different ways to flip from long to short.
The script is divided into several parts.
The first part of the script is used to set all the variables. You should normally never change the first part except for the comments at the top.
The second part of the script is the part where you initialise all your indicators. Several indicators can be found on Tradingview and on other sites. Please keep in mind that all the variable names used in the indicator should be unique. (all the … = … parts)
The third part of the script, is the most important part of the script. Here you can create the entry and exit points.
Let’s look at the OPENLONG function to explain this part: The first variables are all the possible entries; These are longentry1 till longentry5. You can add many more if you like.
The variables are all initialised as being false. This way the script can set a value to true if an entry happens.
The if function is the actual logic: You could say “if this is true” then (the line below the if function) longentry1 := (becomes) true.
In this case we have said: “if this is true” then (the line below the if function) longentry1 := (becomes) true when the current close is larger than the close that is 1 back.
The last part is the makelong_funct. This part says that if any of the entries are true, the whole function is true.
The last part of the script is the actual execution. Here the alerts are plotted and the back test strategies are opened and closed.
We hope you guys like it and all feedback is welcome!

Dragon Bot - Default ScriptDragon Script is a framework to make it as easy as possible to test your own strategies and set alerts for external execution bots.
The script has many features build in, like:
1) A ping/pong mechanism between longs and shorts
2) A stop-loss
3) Trailing Stops with several ways to calculate them.
4) 2 different ways to flip from long to short.
The script is divided into several parts.
The first part of the script is used to set all the variables. You should normally never change the first part except for the comments at the top.
The second part of the script is the part where you initialise all your indicators. Several indicators can be found on Tradingview and on other sites. Please keep in mind that all the variable names used in the indicator should be unique. (all the … = … parts)
The third part of the script, is the most important part of the script. Here you can create the entry and exit points.
Let’s look at the OPENLONG function to explain this part: The first variables are all the possible entries; These are longentry1 till longentry5. You can add many more if you like.
The variables are all initialised as being false. This way the script can set a value to true if an entry happens.
The if function is the actual logic: You could say “if this is true” then (the line below the if function) longentry1 := (becomes) true.
In this case we have said: “if this is true” then (the line below the if function) longentry1 := (becomes) true when the current close is larger than the close that is 1 back.
The last part is the makelong_funct. This part says that if any of the entries are true, the whole function is true.
The last part of the script is the actual execution. Here the alerts are plotted and the back test strategies are opened and closed.
We hope you guys like it and all feedback is welcome!

Security() Correction - Realtime vs. Historical BarsProblem
Pine's implementation of the security() function behaves differently in realtime vs. historical bars. Specifically, for historical bars, calling security() for a time frame (TF) larger/slower than the current chart's TF will return information about the last completed bar of the higher TF. However, for realtime bars (i.e. if you allow the chart to continue to plot in realtime), security() returns information about the presently in-progress bar of the higher TF. Clearly, this leads to discontinuity that is arbitrarily dependent upon when the user last loaded or refreshed the chart.
Solution
Fortunately, after understanding the problem, solving it is trivial: use security() normally for historical bars, but switch to explicitly requesting prior candle bars once the indicator is operating on realtime bars. I leave the source open here for any to use as they see fit. For testing, I include an input to allow switching back and forth between standard and corrected behavior.
Figure 1 displays the standard behavior we see in security() calls, and Figure 2 displays the behavior after my correction:
Figure 1: Typical security() behavior in Pine
Figure 2: Corrected security() behavior, forcing historical and realtime bars to refer to the same higher TF bar offset.
I publish this mostly as a reminder to myself, so I will not forget and then have to figure it out again next time it comes up in my scripting.
V21: Initial release.

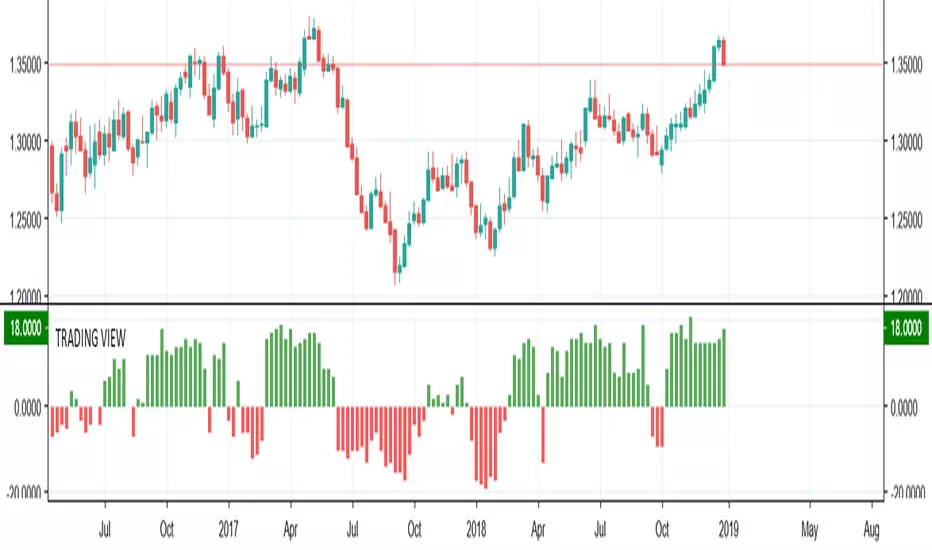
TRADING VIEW INDICATOR - PINE TUTORIAL 5After a long gap, I have written the 5th tutorial for the pine script. You can find the others below, if you read through all of these you should be good to do your own writing.
This script mimics the Trading View Indicator . For example this one below.
www.tradingview.com
It shows the net result of the 28 indicator, either as buy or sell. I have worked hard to make sure it matches the trading view results but I am not in hundred percent agreement with tradingView on SMA, EMA and Ichimoku indicator.
There are many commented plots because I needed to check separately if each indicator is working correctly.
Someone else wrote this code but they did not make it public. It took me about 3 weeks to write this and to be honest it could be cleaner and better commented.
If you find any mistake please let me know. I hope it will be useful in your learning.
Pine Script Tutorial #2In this second tutorial we build upon the previous tutorial. We add color shading for each different day and highlight Wednesday.
The idea here is to manually count if on Wednesdays close is bigger then open.
Hope it helps.
Feel free to comment.
MartinMystere


"Smoothed" CandlesHi!
This new functions plotbar and plotcandle are amazing! Just look at this smoothed candles here)))

Higher Resolution Bars on Intraday ChartHi everybody!
With new plotbar and plotcandle functions you may plot somewhat "stretched" daily bars over intraday chart. Enjoy!
