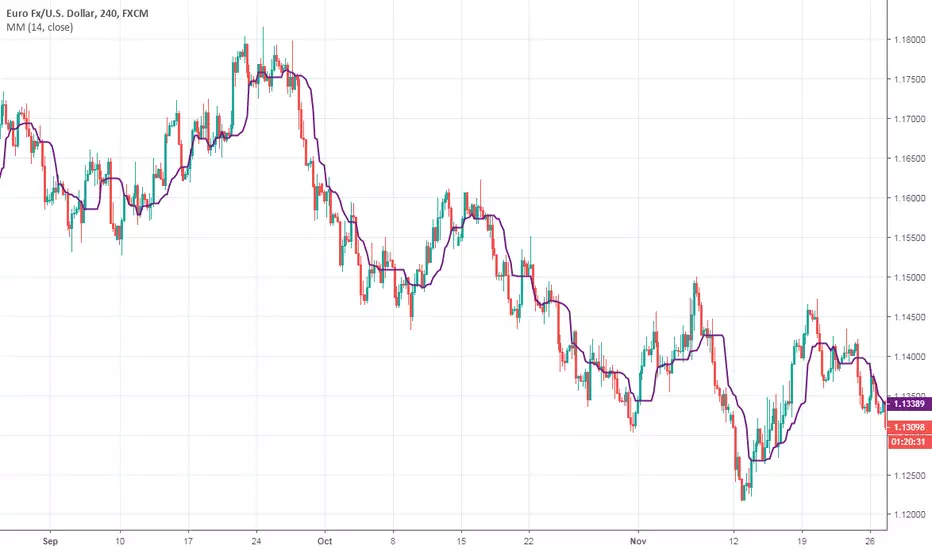
Moving Gain Loss PercentTracks the percentage gain/loss in three ranges:
single candle (can be turned on or off)
custom range of candles
custom range of candles
For example, with a range of 3 candles, and the serie:
1 - close 10
2 - close 5
3 - close 20
The moving gain would be:
1 - close 10 - gain 10, infinite%
2 - close 5 - gain 5, infinite%
3 - close 18 - gain 8, 80%
Or, for example if the range is 12 candles on a monthly chart, then the result is the Year-To-Date gain/loss plotted as a percentage.
Percentile

DWP_percentile_linear_interpolation
Hope this help to see the % of winners and losers in the market.
MoveTrap.
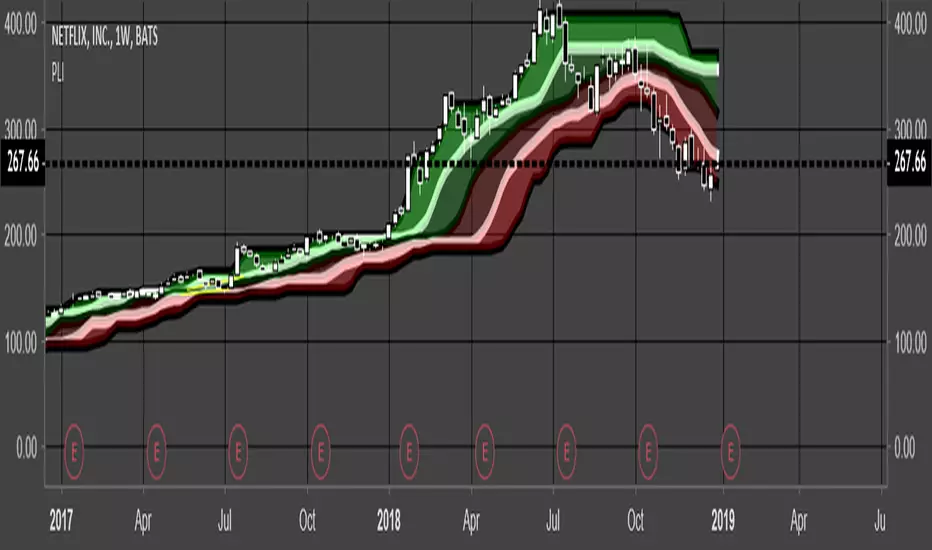
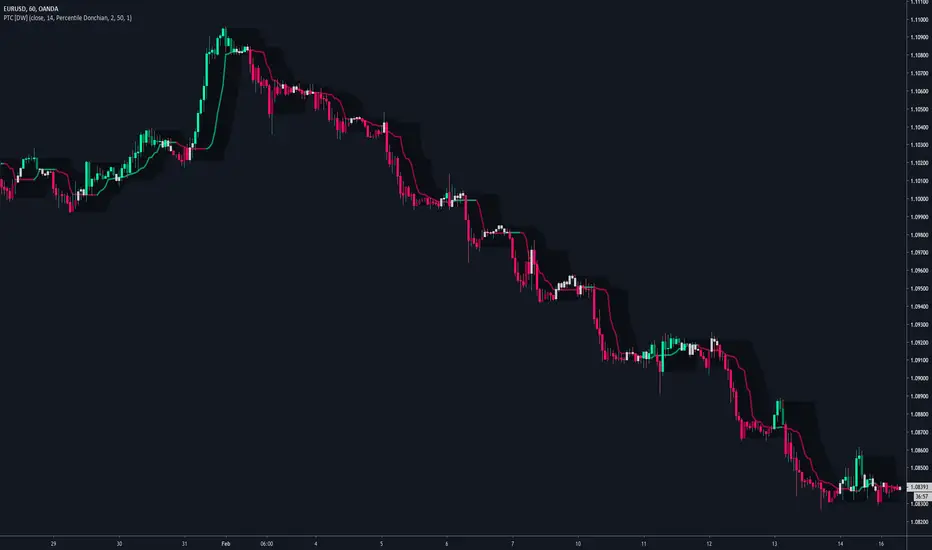
Percentile Trend Channel [DW]This is an experimental study designed to identify the trend of price action over a specified period using percentiles.
First, the 50th percentile is calculated over the sampling period using the nearest rank method. I've found that this calculation is useful as a proxy for moving averages and other filters of that class.
Next, the channel levels are calculated. In this study, there are three channel methods to choose from:
-Percentile Donchian, which calculates Donchian Channels using the 100th and 0th percentile ranks
-Percentile Keltner, which calculates the 50th percentile true range multiplied by a specified amount, then adds it to and subtracts it from the 50th percentile
-Percentile Bollinger, which calculates 50th percentile standard deviation multiplied by a specified amount, then adds it to and subtracts it from the 50th percentile
I also included a squeeze box option within this script, which is derived from my original Squeeze Box tool.
This option detects squeezes in the specified channel's range by a specific percentage, and plots the channel values where the squeeze begins.
The box also has a range multiplier, which can be used to expand or contract its range.
Custom bar colors are included. The color scheme is based on the perceived trend over the specified sampling period.
[RESEARCH] Custom Median vs Built-in MedianI compared custom median (using the sorting solution by @apozdnyakov) with built-in median (using percentile_nearest_rank function)
If you see the zero line this means the solutions give the same results.
The best results was achieved on the odd lengths.
Conclusions:
1) Do not try to reinvent the wheel.
2) Always check the Pine Script docs to find already implemented solutions.


Moving MedianThis simple script was a collaborative effort with 4X4good.
It plots a moving median for the period using the 50th percentile value.
We wanted to know the median value of VIX but surprisingly, a median indicator wasn't yet available in the indicators library.
So we did a little research & put this together.

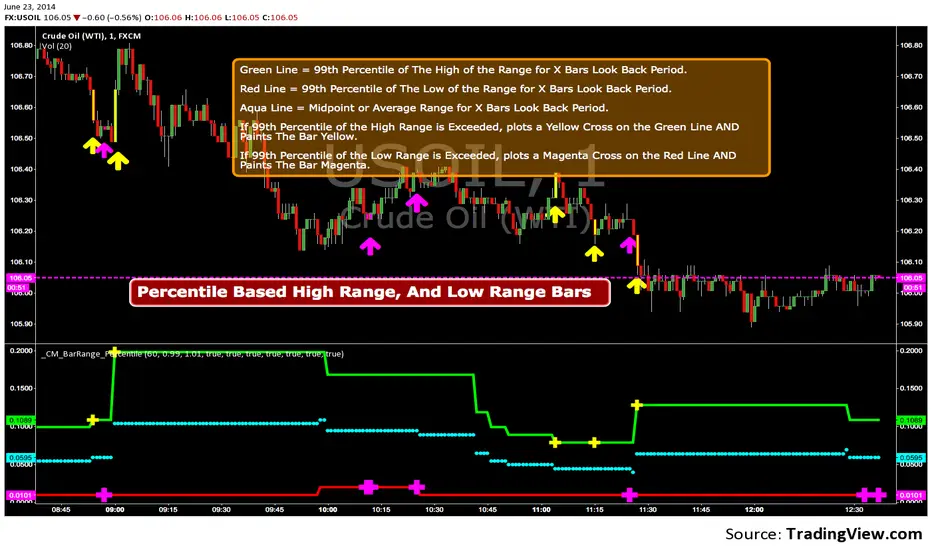
_CM_BarRange_PercentileI know a Trader that went 18 months without a losing trade. This Trader averaged trading 700-800 contracts per month in the Futures markets.
The was not his only system but here were his rules.
He looked at the 60 minute bar and calculated the ranges of the bars over the last 3 months. IF the range of the Bar was Greater Than the 99th Percentile, He would Fade that move or take the trade in the opposite direction.
Thought process is If the Price Bar is Greater Than the 99th Percentile then typically the market reverses. This happens a lot of times at news events. If you’ve studied the markets long enough you know if a Nes based event causes a Huge Move, which we define as Greater than the 99th Percentile, the Market typically moves in the opposite direction.
***This is dependent on the Instrument your trading and the time frame your trading. Some Instruments and time frames this signals a continuation move.
I also added in the Low of the Range based on the 99th Percentile. Often times Low Range Bars…especially if they appear at the top of a swing move, or the bottom of a swing move…create a high probability entry once the High or Low of the bar is taken out in the opposite direction of the previous move…The Low Range bars show indecision after a strong move and create great reversal opportunities.
Works on All Time Frames…again depending on the instrument your trading.
On instruments that MOVE or have High Volatility like Crude and Oil you can get great signals on 1 minute bars.
***Code includes ability to pick ham many bars you want your Look Back Period To Be.
***You can change the percentages to use the 99th Percentile, or 95th percentile, etc…
***The Green Line is the Value of the High Range Percentile.
***The Red Line is the Value of the Low Range Percentile.
***Plots a Magenta Cross on the Red Line if the Range is Below the Low Range Percentile.
***Plots a yellow Cross on the Green Line if the Range is Greater Than the High Range Percentile.
***The Aqua line is the Midpoint of the Range. Or the Average Price Move.
***Colors the Price Bar Yellow if the Range exceeds the High Range Percentile.
***Colors The Bar Magenta if the Range is Less Than the Low Range Percentile
***All parameters can be turned on or off via Check Boxes in the Inputs Tab