Market Internals SPY[TP]# Market Internals SPY Dashboard - TradingView Publication
## 📊 Overview
**Market Internals SPY ** is a comprehensive multi-factor market sentiment dashboard designed specifically for SPY (S&P 500 ETF) traders. This indicator combines four powerful market breadth signals into one easy-to-read interface, helping traders identify high-probability setups and avoid false breakouts.
---
## 🎯 What Makes This Indicator Unique?
Unlike single-indicator tools, this dashboard synthesizes **multiple market internals** to provide confluence-based trading signals:
- **CPR (Central Pivot Range)** - Institutional pivot levels
- **VIX (Volatility Index)** - Fear gauge
- **Put/Call Ratio** - Options sentiment with dynamic crossover alerts
- ** USI:ADD (Advance/Decline Line)** - Market breadth strength
All presented in a clean, real-time dashboard with visual alerts directly on your chart.
---
## 📈 Key Features
### 1. **Static Daily CPR Levels**
- Automatically plots Top CPR, Pivot, and Bottom CPR
- Levels remain fixed throughout the trading day (no repainting)
- **Trend Bias Indicator**: Green = Current Pivot > Previous Pivot (Bullish structure)
### 2. **Put/Call Ratio Crossover System**
- 10-period SMA smoothing for cleaner signals
- **Bullish Signal** (Green background): Put/Call crosses below SMA
- Indicates decreasing hedging activity (bullish)
- **Bearish Signal** (Red background): Put/Call crosses above SMA
- Indicates increasing hedging activity (bearish)
### 3. **Price/Breadth Divergence Detection**
- **Yellow Candles**: Highlight when price and USI:ADD diverge
- Price rising but USI:ADD falling = Potential reversal
- Price falling but USI:ADD rising = Possible bottom
### 4. **Comprehensive Real-Time Dashboard**
A top-right table displaying:
- **CPR Trend Bias**: Bullish/Bearish structure
- **VIX Level**: Current value + directional bias
- **Put/Call Ratio**: Live value + trend arrows
- **AD Line**: Breadth strength with directional indicators
### 5. **Intelligent Bar Coloring**
- **Green bars**: USI:ADD rising (breadth improving)
- **Red bars**: USI:ADD falling (breadth deteriorating)
- **Yellow bars**: Divergence warning (potential reversal)
---
## 🔧 How to Use
### Setup Instructions
1. **Add to Chart**: Apply to SPY on your preferred intraday timeframe (5m, 15m, 30m, 1H)
2. **Configure Symbols** (if needed):
- Default settings work for most platforms
- If "PCC" doesn't load, try: `PCCR`, `INDEX:PCC`, `USI:PCC`, or `CBOE:PCC`
- Ensure you have market internals data access ( USI:ADD , VIX)
### Trading Signals
#### 🟢 **Bullish Confluence** (High-Probability Long Setup)
- CPR Trend = BULLISH
- VIX falling or low (<20)
- Put/Call below SMA (or green background crossover)
- USI:ADD rising (green bars)
- **Entry**: Look for bullish price action at support levels
#### 🔴 **Bearish Confluence** (High-Probability Short Setup)
- CPR Trend = BEARISH
- VIX rising or elevated (>25)
- Put/Call above SMA (or red background crossover)
- USI:ADD falling (red bars)
- **Entry**: Look for bearish rejection at resistance
#### ⚠️ **Divergence Warning**
- Yellow candles indicate mismatch between price and breadth
- Consider profit-taking or reversals when divergence appears at extremes
### Best Practices
- **Multi-Timeframe Confirmation**: Check higher timeframes (4H, Daily) for trend alignment
- **Volume Confirmation**: Combine with volume analysis for stronger signals
- **Risk Management**: Always use stop losses; no indicator is 100% accurate
- **News Awareness**: Be cautious around major economic releases
---
## 📚 Understanding the Components
### CPR (Central Pivot Range)
Traditional floor trader pivot levels calculated from previous day's High, Low, Close:
- **Pivot (PP)** = (High + Low + Close) / 3
- **Top CPR (TC)** = (PP - BC) + PP
- **Bottom CPR (BC)** = (High + Low) / 2
### VIX (Volatility Index)
- **< 15**: Complacency, potential for sudden moves
- **15-20**: Normal conditions
- **20-30**: Elevated uncertainty
- **> 30**: High fear, potential bottoming process
### Put/Call Ratio
- **< 0.7**: Excessive optimism (contrarian bearish)
- **0.7-1.0**: Balanced sentiment
- **> 1.0**: Defensive positioning (contrarian bullish potential)
### USI:ADD (NYSE Advance/Decline)
- **> 0**: More stocks advancing than declining (bullish breadth)
- **< 0**: More stocks declining than advancing (bearish breadth)
- **Extreme readings** (±2000+): Potential exhaustion
---
## ⚙️ Customization Options
### Input Parameters
- **AD Line Symbol**: Default "ADD" (try "ADVN" or "NYSE:ADD" if needed)
- **VIX Symbol**: Default "VIX" (try "CBOE:VIX" if needed)
- **Put/Call Symbol**: Default "PCC" (alternatives listed above)
### Color Scheme
- Blue: CPR levels
- Purple: Pivot point
- Green: Bullish signals/backgrounds
- Red: Bearish signals/backgrounds
- Yellow: Divergence warnings
---
## 💡 Pro Tips
1. **Wait for Confluence**: Don't trade on a single indicator - wait for 3+ signals to align
2. **Use CPR as Dynamic S/R**: Price tends to react at TC and BC levels
3. **Watch the Crossovers**: Put/Call crossovers often precede significant moves
4. **Monitor Divergences**: Yellow candles at key levels are high-value signals
5. **Combine with Price Action**: This tool confirms direction - you still need entry triggers
---
## ⚠️ Limitations & Disclaimers
- Requires **premium data** for USI:ADD and VIX on most platforms
- Best suited for **intraday SPY trading** (may adapt to other indices)
- **Not a standalone system** - use with proper risk management
- Past performance does not guarantee future results
- Always backtest before live trading
---
## 🎓 Example Scenario
**Bullish Setup**:
- 9:45 AM EST: Price pulls back to Bottom CPR
- Dashboard shows: ✅ Bullish CPR Bias, ✅ VIX 16.5 (falling), ✅ Put/Call 0.68 ⬇️ Bull, ✅ USI:ADD +850 ⬆️
- Green background flashes (Put/Call crossunder)
- **Action**: Enter long at BC with stop below TC of previous day
---
## 📊 Ideal Timeframes
- **Primary**: 5-minute, 15-minute (day trading)
- **Secondary**: 30-minute, 1-hour (swing entries)
- **Confirmation**: Daily chart for trend context
---
## 🔄 Updates & Support
This indicator is actively maintained. If you encounter symbol loading issues:
1. Check your data provider includes market internals
2. Try alternative symbols in inputs
3. Ensure you're using a premium TradingView plan (if required)
---
## 📝 Version Information
- **Version**: 5 (Pine Script v5)
- **Type**: Overlay Indicator
- **Author**: tapaspattanaik
- **Category**: Market Internals / Breadth Analysis
---
## 🏆 Final Thoughts
This indicator is designed for **serious traders** who understand that edge comes from confluence, not single signals. By combining institutional pivot levels with real-time market internals, you gain a significant advantage in reading market sentiment and timing entries with precision.
**Remember**: The best trades happen when multiple independent factors align. Use this dashboard to find those moments.
---
## 📌 How to Add This Indicator
1. Open TradingView and navigate to Pine Editor
2. Copy the complete script code
3. Click "Add to Chart"
4. Configure symbols if needed (see Setup Instructions above)
5. Adjust position/colors to your preference
---
**Happy Trading! 📈**
*This indicator is for educational purposes. Always manage risk appropriately and never risk more than you can afford to lose.*
---
### Tags
`#SPY` `#MarketInternals` `#CPR` `#VIX` `#PutCallRatio` `#BreadthAnalysis` `#DayTrading` `#SwingTrading` `#TechnicalAnalysis` `#PivotPoints`
PCR

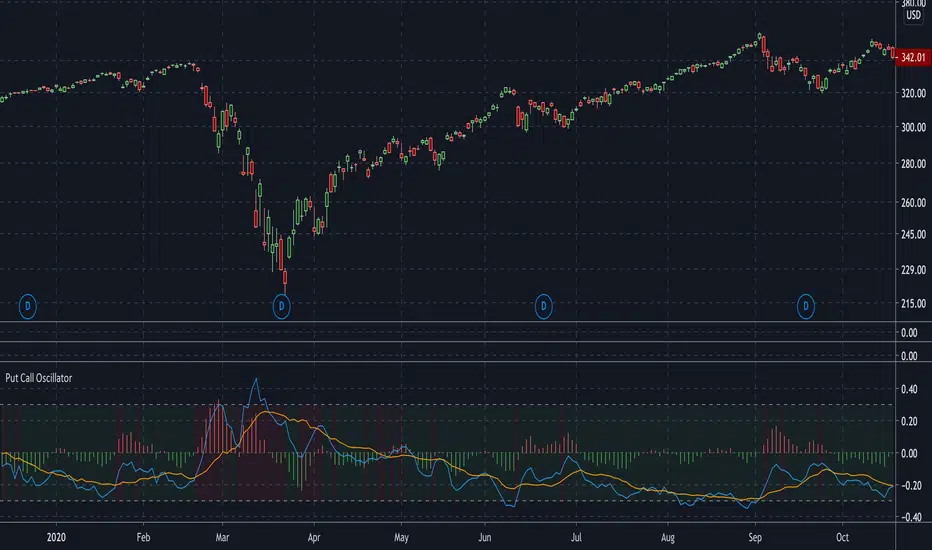
Put Call OscillatorThis is a volume-based oscillator used for detecting market sentiment.
This plots two moving averages of the CBOE S&P500 PCR (put call ratio), and a histogram to measure the distance between them. The histogram will generate signals of green (bullish) or red (bearish), depending on whether put volume is decreasing or increasing.
The moving averages are adjustable. They are set at 4 and 16 by default. Increasing the moving averages will generate less signals, while decreasing them will generate more signals.
The background will change color from red to green depending on whether the PCR is above or below 1.
I used capriole_charles script "Put/Call Ratio (PCR)" to help me build this.
Call / All Ratio ( C / A ) - NoldoFirst of all this script inspired by MagicEins' Put/Call-Ratio-Buschi script .
What is the Put-Call Ratio
The put-call ratio is an indicator ratio that provides information about relative trading volumes of an underlying security's put options to its call options. The put-call ratio has long been viewed as an indicator of investor sentiment in the markets, where a large proportion of puts to calls indicates bearish sentiment, and vice versa. Technical traders use the put-call ratio as an indicator of performance and as a barometer of overall market sentiment. Put-call ratios on broader indexes such as the S&P 500 are also used as more general gauges of market climate.
Put-Call Ratio Interpretation
One way to interpret the put-call ratio is to say that a higher ratio means it's time to sell and a lower ratio means it's time to buy, because when the ratio is high it suggests that people are either expecting or protecting more readily against a future decline in the price of the underlying. A Put-Call ratio between 0.5 and 1 is considered a sideways trend in the markets.
Some also view the Put-Call ratio as a contrarian indicator. Traders know that derivatives are used to do more than place bets; they are used as hedges and insurance. If there's a lot of insurance being placed to the sell side, it means traders are worried about prices falling.
Some traders buy when the put-call ratio is above 1, meaning the market is out of balance to the sell side, and sell when the put-call ratio is below 1, meaning the market is out of balance to the buy side. These traders are looking to make money on the correction. The interpretation of the ratio is left to the analyst's or trader's investment philosophy.
Reference : Investopedia (www.investopedia.com)
Let' s start.
In short, calls represent "bulls" and puts represent "bears".
Some analysts do the opposite,for trend reversals the choice is up to you.
I usually look at the opposite comments in commercial positions because I look at this flow angle neutral.
If you want to do the opposite, you must create Put / All Ratio.
So i created this ratio to observe easily movements under or over 0.50 area .
Or you can take the point close to 0.50 as a horizontal trend. Many more comments can be made.I have a few ideas about this, and I'm going to publish them soon . My best suggestion is that it covers a single bar and is very volatile, so you can look for averages and strong accelerations.
This code is open source under the MIT license. If you have any improvements or corrections to suggest, please send me a pull request via the github repository github.com
Stay tuned , best regards.
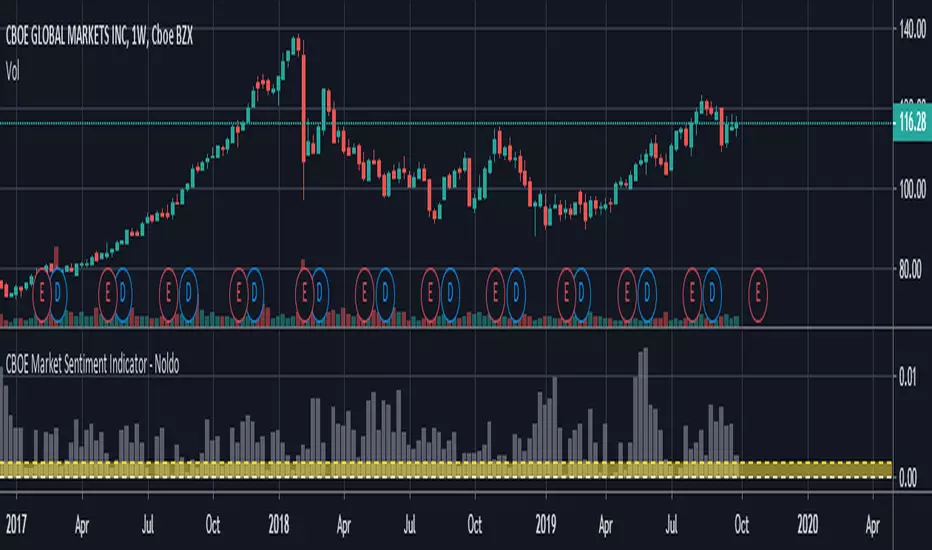
CBOE PCR Factor Dependent Variable Odd Generator This script is the my Dependent Variable Odd Generator script :
with the Put / Call Ratio ( PCR ) appended, only for CBOE and the instruments connected to it.
For CBOE this script is more accurate and faster than Dependent Variable Odd Generator. And the stagnant market odds are better and more realistic.
Do not use for timeframe periods less than 1 day.
Because PCR data may give repaint error.
My advice is to use the 1-week bars to gain insight into your analysis.
This code is open source under the MIT license. If you have any improvements or corrections to suggest, please send me a pull request via the github repository github.com
I hope it will help your work.Best regards!
