[GrandAlgo] Automatic Parallel ChannelThe Automatic Parallel Channel indicator is designed to automate the process of drawing parallel channels on the chart. By analyzing price swings and slopes, it identifies trend-aligned channels that provide insights into market structure, potential reversals, and continuation patterns. This tool saves traders time and effort by eliminating the need to manually draw channels while ensuring accuracy and consistency.
How It Works
The indicator evaluates price action and detects significant swing highs and swing lows to define the boundaries of the parallel channels.
Channels are categorized as green for potential support zones and red for potential resistance zones, ensuring easy visual identification of price trends.
Customizable parameters such as Strength, Max. Slope Steepness, and Fibonacci Line Levels allow traders to adapt the channel detection to different market conditions.
A third line can optionally be drawn at a Fibonacci level for additional confluence.
Key Features
Automatic Channel Detection:
Identifies and plots parallel channels based on swing highs and swing lows, ensuring accuracy and efficiency.
Customizable Strength Parameter:
Adjust the sensitivity of channel detection to focus on minor, intermediate, or major trends.
Fibonacci Line Integration:
Optionally draw a third line within the channel at a user-defined Fibonacci level, offering additional reference points for trend analysis.
Dual Channel Visualization:
Displays green channels to represent potential support and red channels for potential resistance, simplifying visual analysis.
Slope Control:
Set the Max. Slope Steepness to filter out channels that do not meet your trend steepness criteria.
Real-Time Updates:
Channels are dynamically updated as price action evolves, ensuring relevance to current market conditions.
Use Cases
Identify trend channels to determine the overall market direction.
Spot potential reversal or continuation zones using channel boundaries.
Use the third Fibonacci line as a key level for potential price reactions.
Suitable for trend-following strategies and breakout trading setups.
Adaptable across Forex, crypto, stocks, and other markets.
Disclaimer:
This indicator is a technical analysis tool designed to assist traders by providing insights into market conditions. It does not guarantee future price movements or trading outcomes and should not be relied upon as a sole decision-making tool. The effectiveness of this indicator depends on its application, which requires your trading knowledge, experience, and judgment.
Trading involves significant financial risk, including the potential loss of capital. Past performance of any tool or indicator does not guarantee future results. This script is intended for educational and informational purposes only and does not constitute financial or investment advice. Users are strongly encouraged to perform their own analysis and consult with a qualified financial professional before making trading decisions.
Parallelchannels

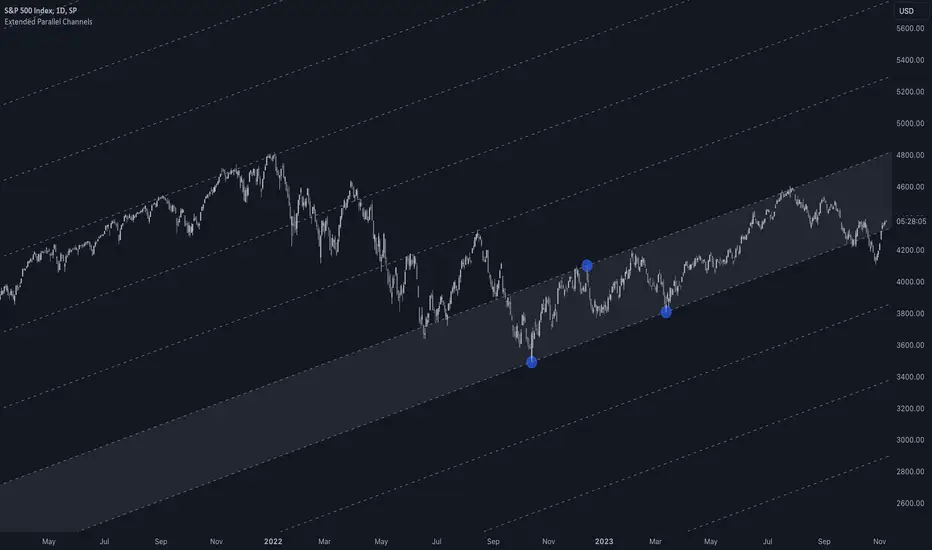
Extended Parallel ChannelsThis indicator provides an enhanced version of the popular Parallel Channel tool by allowing channel boundaries to be extended above and below the primary channel. It can also serve as a general tool for drawing parallel lines and grid lines to aid technical analysis.
🟠 Application
There are two primary ways extended channels can provide valuable insights:
🔵 Support and Resistance Levels
When prices break out of a channel, they often encounter strong resistance at approximately the 100% extension point. Breakout traders can utilize the extended channel boundary to place take-profit orders. Meanwhile, reversal traders can look for entry opportunities at this level.
🔵 Grid / Martingale Trading
Grid Trading and Martingale Trading strategies rely heavily on grid lines. This indicator streamlines that process by enabling traders to effortlessly plot grid lines across the chart.
🟠 Instructions
Upon adding the indicator, the user will be prompted to set the channel boundaries by placing three anchor points on the chart. The first two anchors determine one boundary line, while the third anchor determine the other boundary line.
Once the three anchors are positioned, the indicator automatically plots the resulting channel as well as the extended lines. The anchor points are highlighted as movable blue circles, allowing the user to dynamically adjust the channel formation by dragging the anchors to new locations as needed.
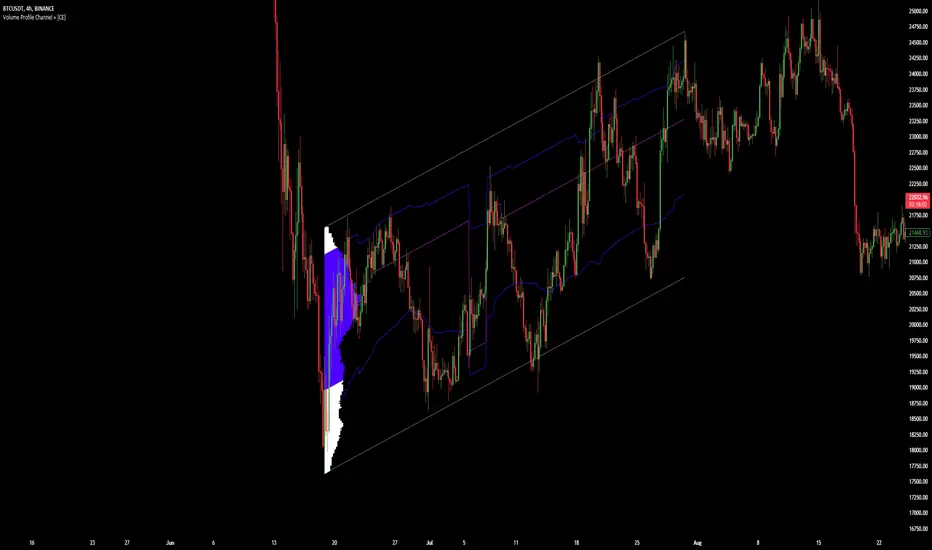
Volume Profile Channel [CE]Volume Profile Channel
Volume Profile Channel, Is the first of its kind tool that will plot a volume profile in any directional channel, the tool will calculate a profile and display the following, POC/VAH/VAL.
The typical profile works by on a horizontal access such that ticksize can be calculated along the y axis and data can then be used to generate a profile, the angle of a parallel channel would make this unavailable.
By cleverly using the angle at which the profile is created, a diagonal ticksize is generated and applied to the profile to create a first of its kind parallel channel volume profile tool!
User Controllable Width:
As compared to the above or below images, users have the ability to control the width this will allow them to show how much of the space the profile will draw on the chart with, using the value "0"
can be done to completely remove the profile whilst still tracking the POC,VAH,VAL
0 Width:
Users can the total number of rows,
Number Of Rows 50:
Ability to "anti-alias" the profile as well below will show a comparison of this occurring:
Unsmoothed
Smoothed
The advantage of using this is that as opposed to relying datasets of mid points or custom equal values along a parallel channel , users can now use the profile to see where the channel has the most interaction, (POC).
This allows for an objective look into the data as opposed to identifying by "eye" where traders are exchanging hands or vs using values such as the midpoint which may not necessarily always be a point of interest as the POC will be.
The VAH/VAL levels give good opportunity to see reactions at levels we may not previously be able to see in the channel with fixed values, allowing us to take positions in a more dynamic sense which may not be identifiable with fixed positions, 0.25,0.5,0.75 etc...

Volume Profile Channel + [CE]Volume Profile Channel +
Volume Profile Channel +, Is the first of its kind tool that will plot a volume profile in any directional channel, the tool will calculate a profile and display the following, POC/VAH/VAL.
The typical profile works by on a horizontal access such that ticksize can be calculated along the y axis and data can then be used to generate a profile, the angle of a parallel channel would make this unavailable.
By cleverly using the angle at which the profile is created, a diagonal ticksize is generated and applied to the profile to create a first of its kind parallel channel volume profile tool!
Features include the ability to "anti-alias" the profile as well below will show a comparison of this occurring:
Unsmoothed
Smoothed
Additionally this mode comes with the ability to track the development of the POC AND VAH/VAL overtime:
The advantage of using this is that as opposed to relying datasets of mid points or custom equal values along a parallel channel, users can now use the profile to see where the channel has the most interaction, (POC).
This allows for an objective look into the data as opposed to identifying by "eye" where traders are exchanging hands or vs using values such as the midpoint which may not necessarily always be a point of interest as the POC will be.
The VAH/VAL levels give good opportunity to see reactions at levels we may not previously be able to see in the channel with fixed values, allowing us to take positions in a more dynamic sense.
As you can see in the chart below with the track enabled, you can see clear reaction points when price interacted with these dynamic levels, which may not be identifiable with fixed positions, 0.25,0.5,0.75 etc...
TO DO
Dynamic Extension Points
Custom Alerts
Real Time Extension
Pivot Parallel Channel by [livetrend]This script draws parallel channels using pivot points for trend analysis.
Script draws maximum 4 parallel channels if suitable up or down trend already exists on the chart according to chosen Pivot Length and Multiplier.
You can change Multiplier to draw Higher Time Frame Channels.
Good luck!
Responsive Linear Regression ChannelsThis is a linear trend indicator that can:
- automagically adjust to different chart resolutions
- snap to day/session boundaries on intraday
- totally not do the above and use ye olde good fixed lookback window
- show the regression trend and its RMSE channels
- disregard the trend and just show the period average and standard deviation lines (often acting as support and resistance)
The main idea was to allow you to quickly view linear trends for different time periods without having to calculate the required amount of bars.
By default, you will be able to quickly switch between 1-3 months, 6 months, 1 year, 2 years and 5 years of data, as well as various daily lookback periods.
Please adjust resolution settings to your liking.
Caveats:
- More data means more noise and slower calculations.
- HLC3 source is recommended, especially at resolutions above hourly.
- Trend will be slightly different if you use extended hours.
- If you use extended hours and don't have a data subscription, trend will be SUBSTANTIALLY different, especially at smaller resolutions like 1m.
- You might want to use 3.5 days per week for crypto (it's 7 days by default).
Known problems:
- If you can't see the trendlines, scroll to the left or zoom out - the origin could be outside of your viewport.
- Futures' sessions start on the previous day. We currently snap only to day boundaries, not session breaks.
- UVXY and the like that have extremely high price datapoints. The calculations will be wrong on some resolutions.
- Replay can freeze circa bar_index 244 — disable smart lookback and keep your window under 240 bars if you encounter this.
ACKNOWLEDGEMENTS:
Many thanks to alexgrover for his extremely efficient functions (used with permission)

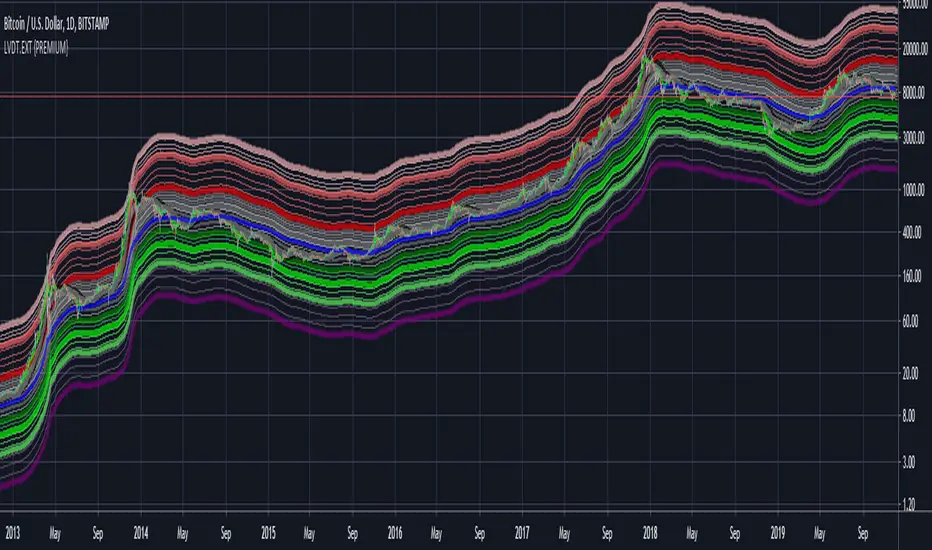
LIVIDITIUM EXTENDED BANDS {PREMIUM}This is the extended band/levels version of LIVIDITIUM Channel {PREMIUM}.
The LIVIDITIUM is a set of indicators centered around a series of parallel dynamic bands call the LVDT guide bands, defined by lines call the LVDT levels. Major LVDT levels have thicker line-widths.
LVDT levels are constructed from a mathematical conjugation of the complex golden ratio solutions.
>> Useful to determine critical levels, indicates possible support levels, as well as major and minor tops/bottoms.
Look at historical interactions to work out key levels for any particular chart, and adjust the displacement offset value to get the LVDT levels to conform better to a particular chart at a particular time-frame.
Note:
In no way is this intended as a financial/investment/trading advice. You are responsible for your own investment/trade decisions.
Please exercise your own judgement for your own trades base on your own risk-aversion level and goals as an investor or a trader. The use of OTHER indicators and analysis in conjunction (tailored to your own style of investing/trading) will help improve confidence of your analysis, for you to determine your own trade decisions.
Please PM me for access information.
( Bundled with LIVIDITIUM {PREMIUM})
LIVIDITIUM Channel {PREMIUM}This is the LITE version of LIVIDITIUM {PREMIUM} -- with colored streaks highlighting oversold or overbought conditions along the LVDT-bands .
The LIVIDITIUM is a set of indicators centered around a series of parallel dynamic bands call the LVDT guide bands, defined by lines call the LVDT levels. Major LVDT levels have thicker line-widths.
LVDT levels are constructed from a mathematical conjugation of the complex golden ratio solutions.
>> Useful to determine critical levels, indicates possible support levels, as well as major and minor tops/bottoms.
Look at historical interactions to work out key levels for any particular chart, and adjust the displacement offset value to get the LVDT levels to conform better to a particular chart at a particular time-frame.
Note:
In no way is this intended as a financial/investment/trading advice. You are responsible for your own investment/trade decisions.
Please exercise your own judgement for your own trades base on your own risk-aversion level and goals as an investor or a trader. The use of OTHER indicators and analysis in conjunction (tailored to your own style of investing/trading) will help improve confidence of your analysis, for you to determine your own trade decisions.
Please PM me for access information.
( Bundled with LIVIDITIUM {PREMIUM})
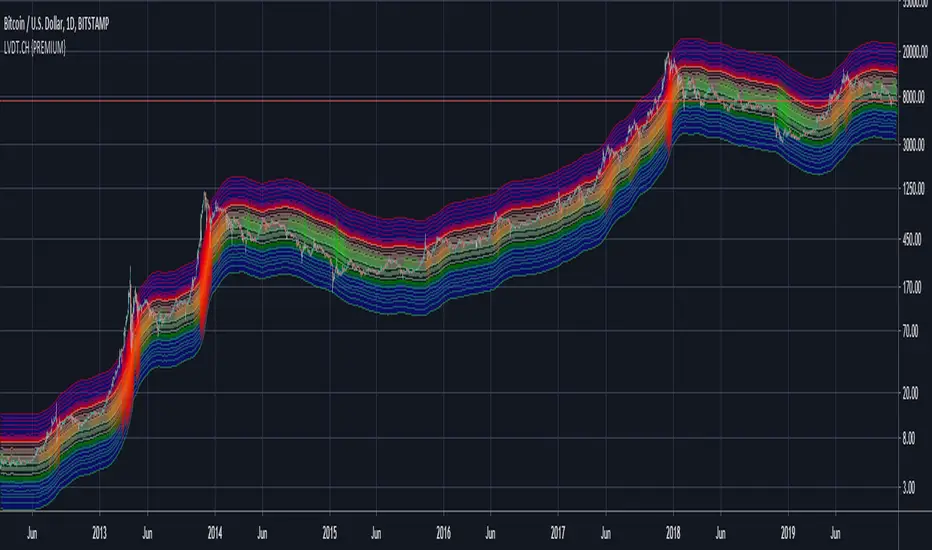
LIVIDITIUM [BTC] {PREMIUM}The LIVIDITIUM is a set of indicators centered around a series of parallel bands call the LVDT guide bands, defined by lines call the LVDT levels. Major LVDT levels have thicker line-widths.
LVDT levels are constructed from a mathematical conjugation of the complex golden ratio solutions.
>> Useful to determine critical levels, indicates possible support levels, as well as major and minor tops/bottoms.
Look at historical interactions to work out key levels for any particular chart, and adjust the displacement offset value to get the LVDT levels to conform better to a particular chart at a particular time-frame.
Major BUY/SELL indicators for top/bottom levels were added specifically for BTCUSD and optimised for the 1D chart (disabled at lower time-frames). These are based on the interaction of the candlestick with various emas and smas as well as with the LVDT levels.
A scoring algorithm also analyses the significance of major and minor death crosses, base on the presence of other indicators in its vicinity to suggest potential local buy/sell prices, and should still work relatively well at lower time-frames.
Various triggers are also implemented, including golden/death cross indicators, as well as pivot and potential reversal points -- labelled with either text-markers, or colored vertical bands.
Signal markers that are only valid for the BTCUSD chart are automatically disabled when LIVIDITIUM is being used on other charts.
~ * ~ * ~ * ~ * ~ * ~ * ~ * ~ * ~ * ~ * ~ * ~ * ~ * ~ * ~ * ~ * ~ * ~ * ~ * ~ * ~
Note:
In no way is this intended as a financial/investment/trading advice. You are responsible for your own investment/trade decisions.
Please exercise your own judgement for your own trades base on your own risk-aversion level and goals as an investor or a trader. The use of OTHER indicators and analysis in conjunction (tailored to your own style of investing/trading) will help improve confidence of your analysis, for you to determine your own trade decisions.
Please PM me for access information.
