Backtest any Indicator [Target Mode] StrategyUniversal Backtester Strategy with Sequential Logic
This strategy serves as a highly versatile, universal backtesting engine designed to test virtually any indicator-based trading system without requiring custom code for every new idea. It transforms standard indicator comparisons into a robust trading strategy with advanced features like sequential entry steps, dynamic target modes, and automated webhook alerts.
The core philosophy of this script is flexibility. Whether you are testing simple crossovers (e.g., MA Cross) or complex multi-stage setups (e.g., RSI overbought followed by a MACD flip), this tool allows you to configure logic via the settings panel and immediately see backtested results with professional-grade risk management.
Core Logic: Source vs. Target Mode
The fundamental building block of this strategy is the "Comparator" engine. Instead of hard-coding specific indicators, the script allows users to define logic slots (L1-L5 for Longs, S1-S5 for Shorts).
Each slot operates on a flexible comparison logic:
Source: The primary indicator you are testing (e.g., Close Price, RSI, Volume).
Operator: The condition to check (Equal/Cross, Greater Than, Less Than).
Target Mode:
Value Mode: Compares the Source against a fixed number (e.g., RSI > 70).
Source Mode: Compares the Source against another dynamic indicator (e.g., Close > SMA 200).
This "Target Mode" switch allows the strategy to adapt to almost any technical analysis concept, from oscillator levels to moving average trends.
Advanced Entry System: Sequential Steps (1-5)
Unlike standard backtesters that usually require all conditions to happen simultaneously (AND logic), this strategy implements a State Machine for sequential execution. Each of the 5 entry slots (L1-L5 / S1-S5) is assigned a "Step" number.
The logic flows as follows:
Stage 1: The strategy waits for all conditions assigned to "Step 1" to be true.
Latch & Wait: Once Step 1 is met, the strategy "remembers" this and advances to Stage 2. It waits for a subsequent bar to satisfy Step 2 conditions.
Trigger: The actual trade entry is only executed once the highest assigned step is completed.
Example Use Case:
Step 1: Price closes below the Lower Bollinger Band (Dip).
Step 2: RSI crosses back above 30 (Confirmation).
Execution: Buy Signal triggers on the Step 2 confirmation candle.
This creates a realistic "Setup -> Trigger" workflow common in professional trading, preventing premature entries.
Exit Logic & Risk Management
The strategy employs a dual-layer exit system to maximize profit retention and protect capital.
1. Signal-Based Exits (OR Logic) There are 5 configurable exit slots (LX1-LX5 / SX1-SX5). Unlike entries, these operate on "OR" logic. If any enabled exit condition is met (e.g., RSI becomes overbought OR Price crosses below EMA), the position is closed immediately.
2. Hard Stop & Take Profit
Fixed %: Users can set a hard percentage-based Stop Loss and Take Profit.
Trailing Stop: A toggleable "Trailing?" feature allows the Stop Loss to dynamically trail the price.
Longs: The SL moves up as the price makes new highs.
Shorts: The SL moves down as the price makes new lows.
Automated Alerts & Webhooks
This script is built with automation in mind. It includes a dedicated makeJson() function that constructs a JSON payload compatible with most trading bots (e.g., 3Commas, TradersPost, Tealstreet).
Alert Modes Supported: | Alert Type | Description | | :--- | :--- | | Order Fills Only | Triggers standard TradingView strategy alerts when the broker emulator fills an order. | | Alert() Function | Triggers specific JSON payloads defined in the code ("action": "buy", "ticker": "MNQ", etc.). |
The script automatically calculates the alert quantity based on your equity percentage settings, ensuring the payload matches your backtest sizing.
Dashboard & Visuals
To aid in rapid analysis, the strategy includes visual tools directly on the chart:
Performance Table: A dashboard (top-right) displays real-time stats including Net Profit, Win Rate, Profit Factor, and Max Drawdown.
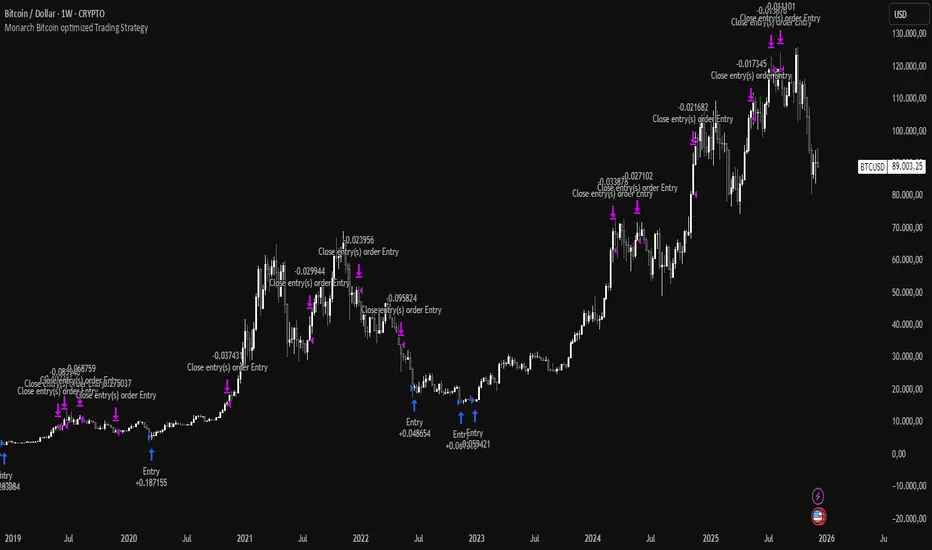
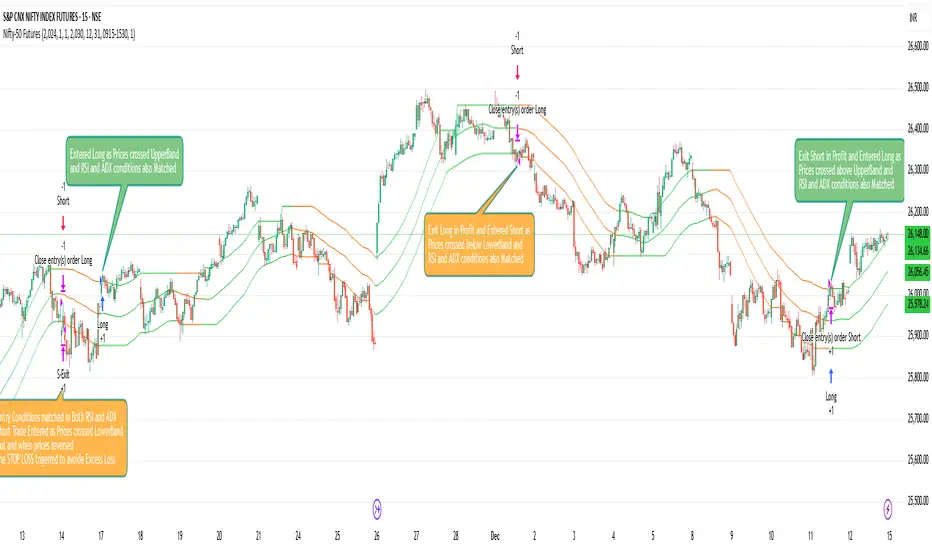
Trade Markers: Custom labels (goLong, exLong) show exactly where trades opened and closed, including the trade number and profit percentage.
SL/TP Visualization: Dynamic step-lines (Orange for SL, Lime for TP) show exactly where your protection levels are sitting, helping you visually verify if your stops are too tight or too loose.
Estratégia Pine Script®