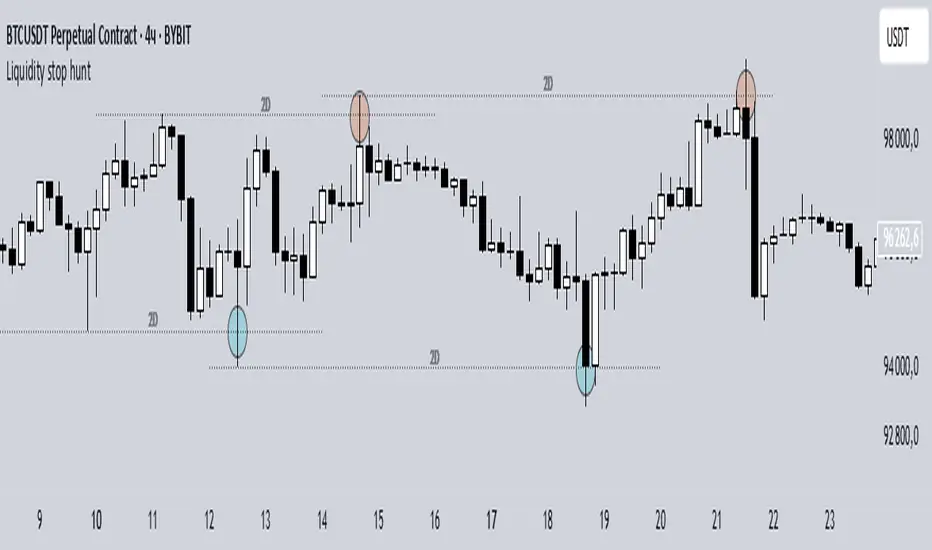
Liquidity stop huntThis tool identifies key liquidity zones where stop hunts are likely to occur.
**How it works:**
- Detects swing highs/lows on your selected timeframe.
- Marks levels where "liquidity sweeps" (fakeouts) often happen.
- Plots these zones as dotted lines for visual reference.
**How to use:**
1. Look for price rejections near marked levels.
2. Avoid placing stops too close to obvious liquidity zones.
3. Combine with price action for confirmation.
**Settings:**
- Timeframe: Choose the historical period for analysis (e.g., 1D, 1W).
- Sweep Type: "Wick Only" for precise tails, "Regular" for all breaks.
- Colors/Style: Customize appearance.
Note: Works best in trending markets. Not a standalone strategy — always confirm with additional analysis.
Indicadores e estratégias
Liqudation HeatMap [BigBeluga]🔵 OVERVIEW
An advanced liquidity visualization tool that plots horizontal heat zones to highlight where potential liquidations and volume clusters are most likely hiding beneath price action.
Liqudation HeatMap scans historical price movements for local highs and lows with elevated volume or candle range. It then draws dynamic heatmap boxes—shaded from lime (low interest) to yellow (high interest)—revealing potential zones of trapped positions or stop clusters. A vertical scale on the right shows you the relative strength of volume behind each level, from 0 to the highest detected.
🔵 CONCEPTS
Maps areas of potential liquidity using volume or candle range (if volume is unavailable).
Identifies swing highs/lows (pivots) and extends heatmap boxes outward from these levels. Colors each zone based on the relative strength of volume concentration.
Fades or removes zones once price crosses their midpoints, simulating the idea of liquidity being “consumed.”
Displays a live vertical scale that shows the volume range for quick reference.
🔵 FEATURES
Dynamic Heatmap Zones:
Draws few boxes above and after pivot highs and below pivot lows, each shaded based on volume concentration.
Smart Coloring System:
Uses a gradient from lime (low) to yellow (high) to visually distinguish between weak and strong liquidity zones.
Adaptive ATR Widths:
Automatically adjusts zone thickness based on volatility (ATR), scaling intelligently across timeframes.
Liquidity Consumption Logic:
Zones are stope extending once price interacts with them—mimicking the behavior of real liquidation sweeps.
Volume Scale Legend:
A real-time scale is plotted on the right side, showing the min-max range of volume used for heat calculations.
🔵 HOW TO USE
Look for thick yellow zones to identify areas of concentrated stop losses or liquidation triggers.
Use these levels to anticipate mean reversion points or high-volatility zones.
Combine with your trend or structure tools to trade into or fade these liquidity pools.
On lower timeframes, use this tool to confirm entries around sweeps or deviations.
Use the right-side scale to compare relative zone strength instantly.
🔵 CONCLUSION
Liqudation HeatMap is a powerful visualization tool that uncovers where liquidity likely resides on the chart. By highlighting hidden traps and reactive levels in real-time, it gives traders a significant edge when it comes to spotting stop hunts, mean reversions, and areas of institutional interest. Whether you’re scalping or swing trading, this heatmap provides unmatched context on the market’s hidden intent.

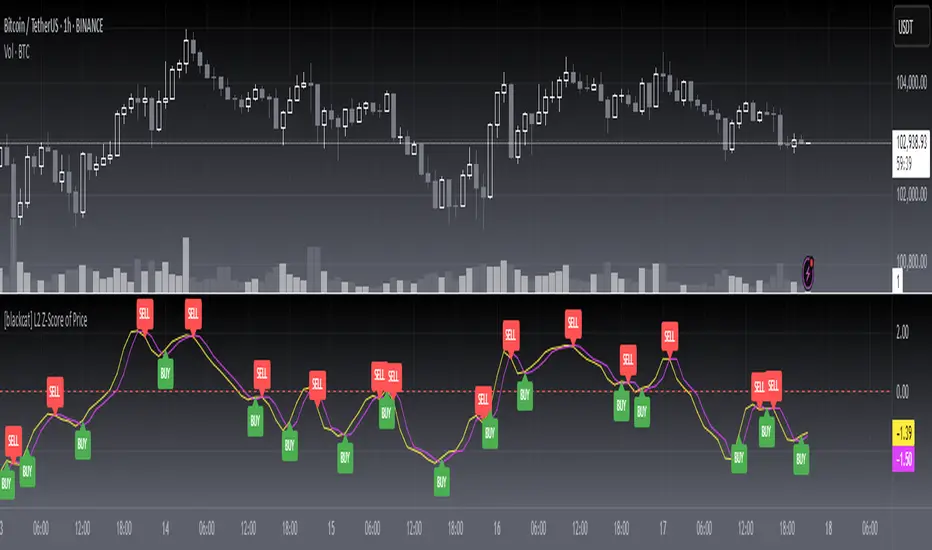
[blackcat] L2 Z-Score of PriceOVERVIEW
The L2 Z-Score of Price indicator offers traders an insightful perspective into how current prices diverge from their historical norms through advanced statistical measures. By leveraging Z-scores, it provides a robust framework for identifying potential reversals in financial markets. The Z-score quantifies the number of standard deviations that a data point lies away from the mean, thus serving as a critical metric for recognizing overbought or oversold conditions. 🎯
Key benefits encompass:
• Precise calculation of Z-scores reflecting true price deviations.
• Interactive plotting features enhancing visual clarity.
• Real-time generation of buy/sell signals based on crossover events.
STATISTICAL ANALYSIS COMPONENTS
📉 Mean Calculation:
Utilizes Simple Moving Averages (SMAs) to establish baseline price references.
Provides smooth representations filtering short-term noise preserving long-term trends.
Fundamental for deriving subsequent deviation metrics accurately.
📈 Standard Deviation Measurement:
Quantifies dispersion around established means revealing underlying variability.
Crucial for assessing potential volatility levels dynamically adapting strategies accordingly.
Facilitates precise Z-score derivations ensuring statistical rigor.
🕵️♂️ Z-SCORE DETECTION:
Measures standardized distances indicating relative positions within distributions.
Helps pinpoint extreme conditions signaling impending reversals proactively.
Enables early identification of trend exhaustion phases prompting timely actions.
INDICATOR FUNCTIONALITY
🔢 Core Algorithms:
Integrates SMAs along with standardized deviation formulas generating precise Z-scores.
Employs Arithmetic Mean Line Algorithm (AMLA) smoothing techniques improving interpretability.
Ensures consistent adherence to predefined statistical protocols maintaining accuracy.
🖱️ User Interface Elements:
Dedicated plots displaying real-time Z-score markers facilitating swift decision-making.
Context-sensitive color coding distinguishing positive/negative deviations intuitively.
Background shading highlighting proximity to key threshold activations enhancing visibility.
STRATEGY IMPLEMENTATION
✅ Entry Conditions:
Confirm bullish/bearish setups validated through multiple confirmatory signals.
Validate entry decisions considering concurrent market sentiment factors.
Assess alignment between Z-score readings and broader trend directions ensuring coherence.
🚫 Exit Mechanisms:
Trigger exits upon hitting predetermined thresholds derived from historical analyses.
Monitor continuous breaches signifying potential trend reversals promptly executing closures.
Execute partial/total closes contingent upon cumulative loss limits preserving capital efficiently.
PARAMETER CONFIGURATIONS
🎯 Optimization Guidelines:
Length: Governs responsiveness versus smoothing trade-offs balancing sensitivity/stability.
Price Source: Dictates primary data series driving Z-score computations selecting relevant inputs accurately.
💬 Customization Recommendations:
Commence with baseline defaults; iteratively refine parameters isolating individual impacts.
Evaluate adjustments independently prior to combined modifications minimizing disruptions.
Prioritize minimizing erroneous trigger occurrences first optimizing signal fidelity.
Sustain balanced risk-reward profiles irrespective of chosen settings upholding disciplined approaches.
ADVANCED RISK MANAGEMENT
🛡️ Proactive Risk Mitigation Techniques:
Enforce strict compliance with pre-defined maximum leverage constraints adhering strictly to guidelines.
Mandatorily apply trailing stop-loss orders conforming to script outputs reinforcing discipline.
Allocate positions proportionately relative to available capital reserves managing exposures prudently.
Conduct periodic reviews gauging strategy effectiveness rigorously identifying areas needing refinement.
⚠️ Potential Pitfalls & Solutions:
Address frequent violations arising during heightened volatility phases necessitating manual interventions judiciously.
Manage false alerts warranting immediate attention avoiding adverse consequences systematically.
Prepare contingency plans mitigating margin call possibilities preparing proactive responses effectively.
Continuously assess automated system reliability amidst fluctuating conditions ensuring seamless functionality.
PERFORMANCE AUDITS & REFINEMENTS
🔍 Critical Evaluation Metrics:
Assess win percentages consistently across diverse trading instruments gauging reliability.
Calculate average profit ratios per successful execution measuring profitability efficiency accurately.
Measure peak drawdown durations alongside associated magnitudes evaluating downside risks comprehensively.
Analyze signal generation frequencies revealing hidden patterns potentially skewing outcomes uncovering systematic biases.
📈 Historical Data Analysis Tools:
Maintain comprehensive records capturing every triggered event meticulously documenting results.
Compare realized profits/losses against backtested simulations benchmarking actual vs expected performances accurately.
Identify recurrent systematic errors demanding corrective actions implementing iterative refinements steadily.
Document evolving performance metrics tracking progress dynamically addressing identified shortcomings proactively.
PROBLEM SOLVING ADVICE
🔧 Frequent Encountered Challenges:
Unpredictable behaviors emerging within thinly traded markets requiring filtration processes.
Latency issues manifesting during abrupt price fluctuations causing missed opportunities.
Overfitted models yielding suboptimal results post-extensive tuning demanding recalibrations.
Inaccuracies stemming from incomplete/inaccurate data feeds necessitating verification procedures.
💡 Effective Resolution Pathways:
Exclude low-liquidity assets prone to erratic movements enhancing signal integrity.
Introduce buffer intervals safeguarding major news/event impacts mitigating distortions effectively.
Limit ongoing optimization attempts preventing model degradation maintaining optimal performance levels consistently.
Verify reliable connections ensuring uninterrupted data flows guaranteeing accurate interpretations reliably.
USER ENGAGEMENT SEGMENT
🤝 Community Contributions Welcome
Highly encourage active participation sharing experiences & recommendations!
Impulse Zones | Flux Charts💎 GENERAL OVERVIEW
Introducing our new Impulse Zones indicator, a powerful tool designed to identify significant price movements accompanied by strong volume, highlighting potential areas of support and resistance. These Impulse Zones can offer valuable insights into market momentum and potential reversal or continuation points. For more information about the process, please check the "HOW DOES IT WORK ?" section.
Impulse Zones Features :
Dynamic Zone Creation : Automatically identifies and plots potential supply and demand zones based on significant price impulses and volume spikes.
Customizable Settings : Allows you to adjust the sensitivity of zone detection based on your trading style and market conditions.
Retests and Breakouts : Clearly marks instances where price retests or breaks through established Impulse Zones, providing potential entry or exit signals.
Alerts : You can set alerts for Bullish & Bearish Impulse Zone detection and their retests.
🚩 UNIQUENESS
Our Impulse Zones indicator stands out by combining both price action (impulsive moves) and volume confirmation to define significant zones. Unlike simple support and resistance indicators, it emphasizes the strength behind price movements, potentially filtering out less significant levels. The inclusion of retest and breakout visuals directly on the chart provides immediate context for potential trading opportunities. The user can also set up alerts for freshly detected Impulse Zones & the retests of them.
📌 HOW DOES IT WORK ?
The indicator identifies bars where the price range (high - low) is significantly larger than the average true range (ATR), indicating a strong price movement. The Size Sensitivity input allows you to control how large this impulse needs to be relative to the ATR.
Simultaneously, it checks if the volume on the impulse bar is significantly higher than the average volume. The Volume Sensitivity input governs this threshold.
When both the price impulse and volume confirmation criteria are met, an Impulse Zone is created in the corresponding direction. The high and low of the impulse bar define the initial boundaries of the zone. Zones are extended forward in time to remain relevant. The indicator manages the number of active zones to maintain chart clarity and can remove zones that haven't been touched for a specified period. The indicator monitors price action within and around established zones.
A retest is identified when the price touches a zone and then moves away. A break occurs when the price closes beyond the invalidation point of a zone. Keep in mind that if "Show Historic Zones" setting is disabled, you will not see break labels as their zones will be removed from the chart.
The detection of Impulse Zones are immediate signs of significant buying or selling pressure entering the market. These zones represent areas where a strong imbalance between buyers and sellers has led to a rapid price movement accompanied by high volume. Bullish Impulse Zones act as a possible future support zone, and Bearish Impulse Zones act as a possible future resistance zone. Retests of the zones suggest a strong potential movement in the corresponding direction.
⚙️ SETTINGS
1. General Configuration
Show Historic Zones: If enabled, invalidated or expired Impulse Zones will remain visible on the chart.
2. Impulse Zones
Invalidation Method: Determines which part of the candle (Wick or Close) is used to invalidate a zone break.
Size Sensitivity: Controls the required size of the impulse bar relative to the ATR for a zone to be detected. Higher values may identify fewer, larger zones. Lower values may detect more, smaller zones.
Volume Sensitivity: Controls the required volume of the impulse bar relative to the average volume for a zone to be detected. Higher values require more significant volume.
Labels: Toggles the display of "IZ" labels on the identified zones.
Retests: Enables the visual highlighting of retests on the zones.
Breaks: Enables the visual highlighting of zone breaks.

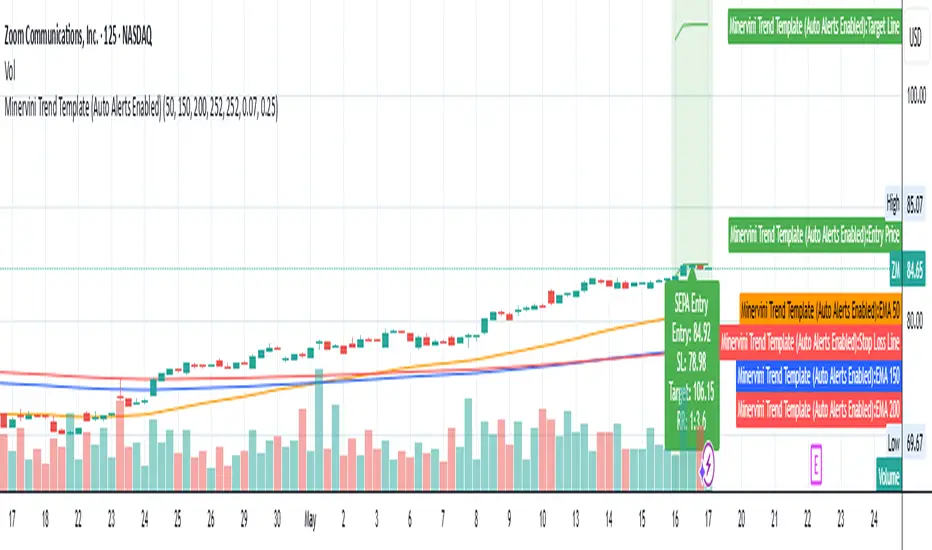
Minervini Trend Template (EMA)📄 Description:
This script is inspired by Mark Minervini’s SEPA (Specific Entry Point Analysis) strategy and adapts his famous Trend Template using Exponential Moving Averages (EMAs). It helps traders visually identify technically strong stocks that are in ideal buy conditions based on Minervini's rules.
📈 Strategy Logic:
This script scans for momentum breakouts by filtering stocks with the following characteristics:
✅ Buy Criteria (All Conditions Must Be Met):
Price above 50-day EMA
Price above 150-day EMA
Price above 200-day EMA
50-day EMA above 150-day EMA
150-day EMA above 200-day EMA
200-day EMA trending upward (greater than it was 20 days ago)
Price within 25% of its 52-week high
Price at least 30% above its 52-week low
If all 8 conditions are satisfied, the script triggers a SEPA Setup Signal. This is visually indicated by:
✅ A green background on the chart
✅ A label saying “SEPA Setup” under the bar
🛒 When to Buy:
Wait for the stock to break out above a recent base or consolidation pattern (like a cup-with-handle or flat base) on strong volume.
The ideal entry is within 5% of the breakout point.
Confirm that the SEPA conditions are met on the breakout day.
📉 When to Sell:
Place a stop-loss 5–8% below your entry price.
Exit if the breakout fails and price falls back below the pivot or the 50-day EMA.
Take partial profits after a 20–25% gain, and move your stop-loss up to breakeven or trail it using moving averages like the 21 or 50 EMA.
Exit fully if price closes below the 50-day or 150-day EMA on volume.
🧠 Why EMAs?
EMAs react faster to recent price action than SMAs, helping you catch earlier signals in fast-moving markets. This makes it especially useful for growth and momentum traders following Minervini’s high-performance approach.
📊 How to Use:
Apply the script to any stock chart (daily timeframe recommended).
Look for a green background + SEPA Setup label.
Combine with price/volume analysis, base patterns, and market context to time your entries.
🚨 Optional Alerts:
You can set an alert on the condition minerviniPass == true to notify you when a SEPA-compliant setup appears.
📚 This tool is meant for educational and research purposes. Always validate with your own due diligence and consult your risk plan before making any trades.
Logarithmischer Trendkanal (sichtbar, in Preisskala + Stilwahl)Logarithmischer frei einstellbarer Trendkanal mit Wachstum p.a. über Trendphase

Breakout DailyBreakout - with body - of yesterday's daily high or low.
###################################################################################
Rottura strutturale - con corpo - del massimo o minimo giornaliero di ieri.

Scalping Ichimoku with Optional Choppiness and RSI FilterIchimoku Cloud Buy-Sell Signal Indicator. The Ichimoku Cloud Strategy is a comprehensive trend-following system combining multiple indicators. It uses the Kumo (cloud) to identify support, resistance, and trend direction. Buy signals occur when price breaks above the cloud with bullish confirmation. Sell signals trigger when price breaks below with bearish alignment. Ideal for spotting momentum shifts and sustained trend entries.

IFVG WITH SignalsTitle: Inverted Fair Value Gaps with Alerts – Smart Liquidity Zones
Description:
This script identifies Inverted Fair Value Gaps (IFVGs) – a concept derived from liquidity theory and price inefficiencies, often associated with smart money trading strategies. Unlike traditional FVGs, inverted gaps point to potential liquidity traps or reversal zones, where price may revisit to rebalance or hunt stops.
Key Features:
Automatic detection of Inverted Fair Value Gaps
Visual zones plotted on chart for easy reference
Customizable alerts when a new IFVG is created or price re-enters one
Works on any timeframe or asset

TPMCustom Script for the TPM Strategy
This indicator graphically and in real time displays the parameters of a Bear Put Spread strategy with active management and additional naked options. It is designed to provide a complete and immediate overview directly on the underlying chart.
🔹 Key Features
• Customizable entry point: can be specified by date and time, displayed with a vertical blue line and an “ENTRY” label.
• Automatic calculation of the management level: shown as an orange horizontal line at -13% from the entry price. When the price drops below this threshold:
• an alert is triggered
• an active management label appears
• Visualization of bought and sold options:
• Strike prices of Buy Put and Sell Put are drawn as horizontal colored lines (red and green)
• Strike of an extra sold Put (-23%) shown in purple
• “Today” line (dashed red or blue) with a day counter from the entry date
• Active period box: highlighted area between the entry day and today, visible across the chart
• Dynamic theoretical expiration (based on VIX):
• 60 / 30 / 15 days depending on the current VIX value
• Yellow vertical line with estimated date and descriptive label, always visible even if in the future
• Golden Scenario (optional):
• Analysis of % variation over a configurable number of days
• Icons 🟤 ⚪ 🟡 drawn on the chart to identify significant drops (-2% / -3% / -5%)
• Visual dashboard (optional):
• Fixed table at the bottom right with color-coded sections for:
• Bull Put: strike and expiration (12 months)
• Management Level
• Extra Sell Put: strike and expiration (9 months)
• Values rounded down and well-formatted for readability
⸻
🔧 Customization
Every parameter of the strategy (strike, entry, levels, period) is customizable via input. The script’s behavior adapts in real time to the chart context and VIX conditions.

Supply Demand - Price Action Forecast ( ERJUANSTURK )1 - Supply Demand: Shows support and resistance based on past purchase and sale volumes. The price is written in the support and resistance boxes.
2 - Price Action Forecast: Situations that have been similar in the past (candlesticks) are possible to occur in the future.

A.K Dynamic EMA/SMA / MTF S&R Zones Toolkit with AlertsThe A.K Dynamic EMA/SMA / MTF Support & Resistance Zones Toolkit is a powerful all-in-one technical analysis tool designed for traders who want a clean yet comprehensive market view. Whether you're scalping lower timeframes or swing trading higher timeframes, this indicator gives you both the structure and signals to take action with confidence.
Key Features:
✅ Customizable EMA/SMA Suite
Display key Exponential and Simple Moving Averages including 5, 9, 20, 50, 100, and 200 EMAs, plus optional 50 SMA for trend filtering. Each line can be toggled individually and color-customized.
✅ Multi-Timeframe Support & Resistance Zones
Automatically detects dynamic S/R zones on key timeframes (5min, 15min, 30min, 1H, 4H, 1D) using swing highs/lows. Zones are color-coded by strength and whether they're broken or active, providing a clear visual roadmap for price reaction levels.
✅ Zone Strength & Break Detection
Distinguishes between strong and weak zones based on price proximity and reaction depth, with visual shading and automatic label updates when a level is broken.
✅ Price Action-Based Buy/Sell Signals
Generates BUY signals when bullish candles react to strong support (supply) zones, and SELL signals when bearish candles react to strong resistance (demand) zones. All logic is adjustable — including candle body vs wick detection, tolerance range, and strength thresholds.
✅ Alerts Engine
Built-in TradingView alerts for price touching support/resistance or triggering buy/sell signals. Perfect for automation or hands-free monitoring.
✅ Optional Candle & Trend Filters
Highlight bullish/bearish candles visually for additional confirmation.
Optional RSI display and 50-period SMA trend filter to guide directional bias.
🧠 Use Case Scenarios:
Identify dynamic supply & demand zones across multiple timeframes.
Confirm trend direction with EMAs and SMA filters.
React quickly to clean BUY/SELL signals based on actual price interaction with strong zones.
Customize it fully to suit scalping, day trading, or swing trading strategies.
📌 Recommended Settings:
Use default zone transparency (65%) and offset (250 bars) for optimal visual clarity.
Enable alerts to get notified when price enters key S/R levels or when a trade signal occurs.
Combine this tool with your entry/exit plan for better decision-making under pressure.
💡 Pro Tip: Add this indicator to a clean chart and let the zones + EMAs guide your directional bias. Use alerts to avoid screen-watching and improve discipline.
Created by:
Version: Pine Script v6
Platform: TradingView

Opening Range Retest█ OVERVIEW
This indicator shows the opening range as a box. It also draws markers and triggers alerts when the opening range is retested. The opening range time is configurable, as is the period of time that must elapse before each return to the opening range is considered a retest.
█ FEATURES
Opening range time configurable in bars or minutes
Configurable "resting" period between the end of the opening range or since the last retest before a new retest is considered valid
Configurable tolerance so that a retest can trigger sooner
Active time range can be used to filter alerts and markers to a specific time window
Visual box showing the opening range, which can be optionally limited to the above-mentioned active time window
Well-documented, high-quality, open-source code for those interested
█ CONCEPTS
This indicator can be used for an opening range retest trading strategy, where long or short positions are taken on the retest of the opening range.
The opening range can be user-configured, so it is suitable for use with any opening range time period (e.g., 1-min, 5-min, 15-min, etc.).
The markers and alerts are equivalent, in the sense that whenever a marker appears, an alert will also trigger (assuming the user has set an alert up).
The alert active time range is simply used as a filter for markers and alerts, meaning that these will not draw or trigger outside of the specified time range.
█ LIMITATIONS
The indicator is intended for equities that have a highly active regular market open. For other security types, it will draw the opening range box from whenever TradingView specifies the market open time.

Price Action Forecast (ERJUANSTURK)█ Overview
The Price Action Color Forecast Indicator, is an innovative trading tool that uses the power of historical price action and candlestick patterns to predict potential future market movements. By analyzing the colors of the candlesticks and identifying specific price action events, this indicator provides traders with valuable insights into future market behavior based on past performance.
█ Calculations
The Price Action Color Forecast Indicator systematically analyzes historical price action events based on the colors of the candlesticks. Upon identifying a current price action coloring event, the indicator searches through its past data to find similar patterns that have happened before. By examining these past events and their outcomes, the indicator projects potential future price movements, offering traders valuable insights into how the market might react to the current price action event.
The indicator prioritizes the analysis of the most recent candlesticks before methodically progressing toward earlier data. This approach ensures that the generated candle forecast is based on the latest market dynamics.
The core functionality of the Price Action Color Forecast Indicator:
Analyzing historical price action events based on the colors of the candlesticks.
Identifying similar events from the past that correspond to the current price action coloring event.
Projecting potential future price action based on the outcomes of past similar events.
█ Example
In this example, we can see that the current price action pattern matches with a similar historical price action pattern that shares the same characteristics regarding candle coloring. The historical outcome is then projected into the future. This helps traders to understand how the past pattern evolved over time.
█ How to use
The indicator provides traders with valuable insights into how the market might react to the current price action event by examining similar historical patterns and projecting potential future price movements.
█ Settings
Candle series
The candle lookback length refers to the number of bars, starting from the current one, that will be examined in order to find a similar event in the past.
Forecast Candles
Number of candles to project into the future.
-----------------
Disclaimer
The information contained in my Scripts/Indicators/Ideas/Algos/Systems does not constitute financial advice or a solicitation to buy or sell any securities of any type. I will not accept liability for any loss or damage, including without limitation any loss of profit, which may arise directly or indirectly from the use of or reliance on such information.
All investments involve risk, and the past performance of a security, industry, sector, market, financial product, trading strategy, backtest, or individual's trading does not guarantee future results or returns. Investors are fully responsible for any investment decisions they make. Such decisions should be based solely on an evaluation of their financial circumstances, investment objectives, risk tolerance, and liquidity needs.


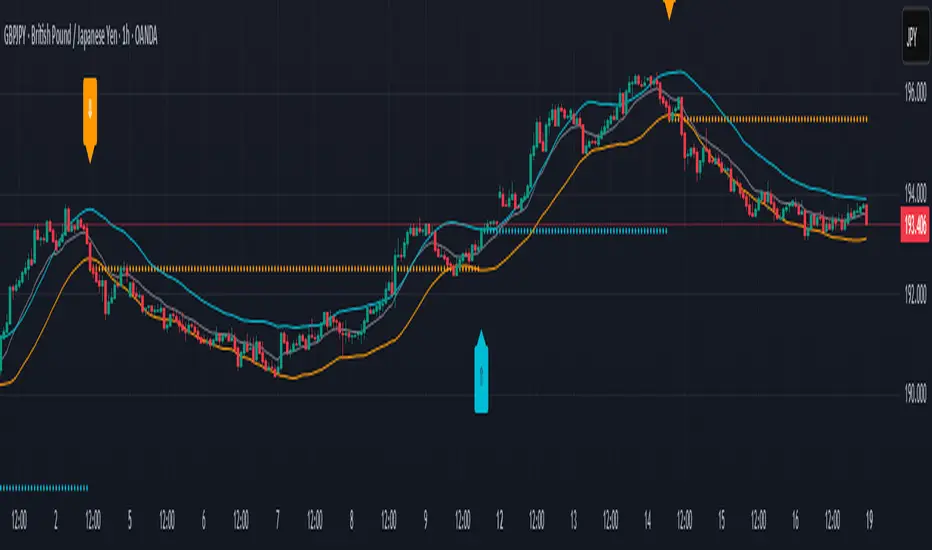
Custom WT Price Signals with MomentumThis script provides modified signals fine-tuned for QQQ on the daily timeframe. It combines WaveTrend crossovers with momentum confirmation and bull/bear trend filtering.
• Yellow: Potential buy signal
• Orange: Accumulation/load signal (optional)
• Purple: Sell signal
Note:
• Some buy signals can be misleading. It’s recommended to use them alongside other indicators.
• Sell signals tend to be more reliable. However, if the fast and slow WaveTrend lines are nearly parallel, false signals may occur.
• While this script is tuned for QQQ daily data, I did not use automated parameter search to avoid overfitting. Recent backtests have shown promising results.
Enjoy and use responsibly!

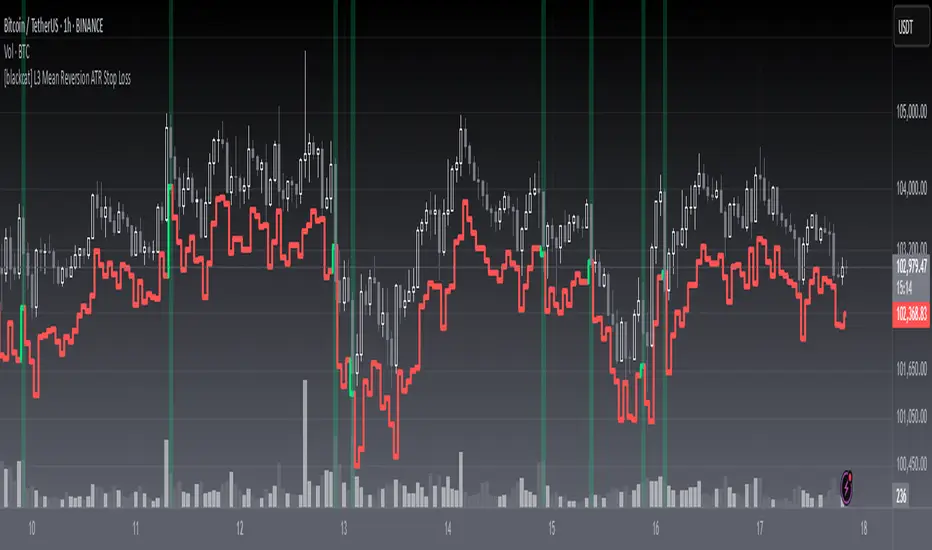
[blackcat] L3 Mean Reversion ATR Stop Loss OVERVIEW
The L3 Mean Reversion ATR Stop Loss indicator is meticulously crafted to empower traders by offering statistically-driven stop-loss levels that adapt seamlessly to evolving market dynamics. By harmoniously blending mean reversion concepts with Advanced True Range (ATR) metrics, it delivers a robust framework for managing risks more effectively. 🌐 The primary objective is to furnish traders with intelligent exit points grounded in both short-term volatility assessments and long-term trend evaluations.
Key highlights encompass:
• Dynamic calculation of Z-scores to evaluate deviations from established means
• Adaptive stop-loss pricing leveraging real-time ATR measurements
• Clear visual cues enabling swift decision-making processes
TECHNICAL ANALYSIS COMPONENTS
📉 Z-SCORE CALCULATION
Measures how many standard deviations an asset's current price lies away from its average
Facilitates identification of extreme conditions indicative of impending reversals
Utilizes simple moving averages and standard deviation computations
📊 STANDARD DEVIATION MEASUREMENT
Quantifies dispersion of closing prices around the mean
Provides insights into underlying price distribution characteristics
Crucial for assessing potential volatility levels accurately
🕵️♂️ ADAPTIVE STOP-LOSS DETECTION
Employs ATR as a proxy for prevailing market volatility
Modulates stop-loss placements dynamically responding to shifting trends
Ensures consistent adherence to predetermined risk management protocols
INDICATOR FUNCTIONALITY
🔢 Core Algorithms
Integrate Smooth Moving Averages (SMAs) alongside standardized deviation formulas
Generate precise Z-scores reflecting true price deviations
Leverage ATR-derived multipliers for fine-grained stop-loss adjustments
🖱️ User Interface Elements
Interactive plots displaying real-time stop-loss markers
Context-sensitive color coding enhancing readability
Background shading indicating proximity to stop-level activations
STRATEGY IMPLEMENTATION
✅ Entry Conditions
Confirm bullish/bearish setups validated through multiple confirmatory signals
Ensure alignment between Z-score readings and broader trend directions
Validate entry decisions considering concurrent market sentiment factors
🚫 Exit Mechanisms
Trigger exits upon hitting predefined ATR-based stop-loss thresholds
Monitor continuous breaches signifying potential trend reversals
Execute partial/total closes contingent upon cumulative loss limits
PARAMETER CONFIGURATIONS
🎯 Optimization Guidelines
Period Length: Governs responsiveness versus smoothing trade-offs
ATR Length: Dictates the temporal scope for volatility analysis
Stop Loss ATR Multiplier: Tunes sensitivity towards stop-trigger activations
💬 Customization Recommendations
Commence with baseline defaults; iteratively refine parameters
Evaluate impacts independently prior to combined adjustments
Prioritize minimizing erroneous trigger occurrences first
Sustain balanced risk-reward profiles irrespective of chosen settings
ADVANCED RISK MANAGEMENT
🛡️ Proactive Risk Mitigation Techniques
Enforce strict compliance with pre-defined maximum leverage constraints
Mandatorily apply trailing stop-loss orders conforming to script outputs
Allocate positions proportionately relative to available capital reserves
Conduct periodic reviews gauging strategy effectiveness rigorously
⚠️ Potential Pitfalls & Solutions
Address frequent violations arising during heightened volatility phases
Manage false alerts warranting manual interventions judiciously
Prepare contingency plans mitigating margin call possibilities
Continuously assess automated system reliability amidst fluctuating conditions
PERFORMANCE AUDITS & REFINEMENTS
🔍 Critical Evaluation Metrics
Assess win percentages consistently across diverse trading instruments
Calculate average profit ratios per successful execution
Measure peak drawdown durations alongside associated magnitudes
Analyze signal generation frequencies revealing hidden patterns
📈 Historical Data Analysis Tools
Maintain comprehensive records capturing every triggered event
Compare realized profits/losses against backtested simulations
Identify recurrent systematic errors demanding corrective actions
Implement iterative refinements bolstering overall efficacy steadily
PROBLEM SOLVING ADVICE
🔧 Frequent Encountered Challenges
Unpredictable behaviors emerging within thinly traded markets
Latency issues manifesting during abrupt price fluctuations
Overfitted models yielding suboptimal results post-extensive tuning
Inaccuracies stemming from incomplete or delayed data inputs
💡 Effective Resolution Pathways
Exclude low-liquidity assets prone to erratic movements
Introduce buffer intervals safeguarding major news/event impacts
Limit ongoing optimization attempts preventing model degradation
Verify seamless connectivity ensuring uninterrupted data flows
USER ENGAGEMENT SEGMENT
🤝 Community Contributions Welcome
Highly encourage active participation sharing experiences & recommendations!
THANKS
A heartfelt acknowledgment extends to all developers contributing invaluable insights about adaptive stop-loss strategies using statistical measures! ✨
Q Impulse EntryQ Impulse Entry
A directional entry system combining impulse breakouts, Elder's momentum confirmation, and ADX trend validation. Designed for clean trade setups with multi-step filtering, entry markers, and real-time alerts.
🔧 Core Logic
This is not a basic mashup — each filter plays a distinct technical role:
1. Impulse Breakout Engine
• Detects sharp directional price breaks using ATR-adjusted dynamic zones
• Impulse window controls sensitivity to local highs/lows
2. Elder Momentum Filter
• Confirms signal using MACD histogram and EMA alignment
• Blocks entries when internal momentum contradicts price move
3. ADX Trend Strength Filter
• Uses threshold-based ADX logic to validate trend power
• Filters out noise in flat or weak markets
The system requires all three filters to agree before confirming an entry.
📈 Visual Feedback
• ⇑ / ⇓ arrows mark confirmed entry signals
• Colored entry dots plotted at signal price help confirm timing and aid in multi-position layering
• Impulse breakout zones and EMA are displayed for directional context
• Clean layout, no repainting, designed for real-time use
⚙️ Configurable Inputs
• Impulse Window — controls breakout signal sensitivity
• ATR Multiplier — defines width of impulse breakout zones
(Elder and ADX filters are embedded and fine-tuned)
✨ Highlights
• Triple-filter signal logic = fewer false positives
• Entry dots + arrows for visual clarity and scaling in
• Lightweight, non-repainting, and alert-ready
• Best suited for Forex and all timeframes
• Ideal for breakout, trend-following, or hybrid systems
• Built-in alerts and customizable zones
• Always apply risk management suited to your capital and strategy
Trade with clarity — stay for quality.
ST + Multi-EMASuperTrend with multiple EMAs.
The indicator includes Supertrend and 10 EMAs. Hope it helps those who are looking for multiple EMAs in one indicator.

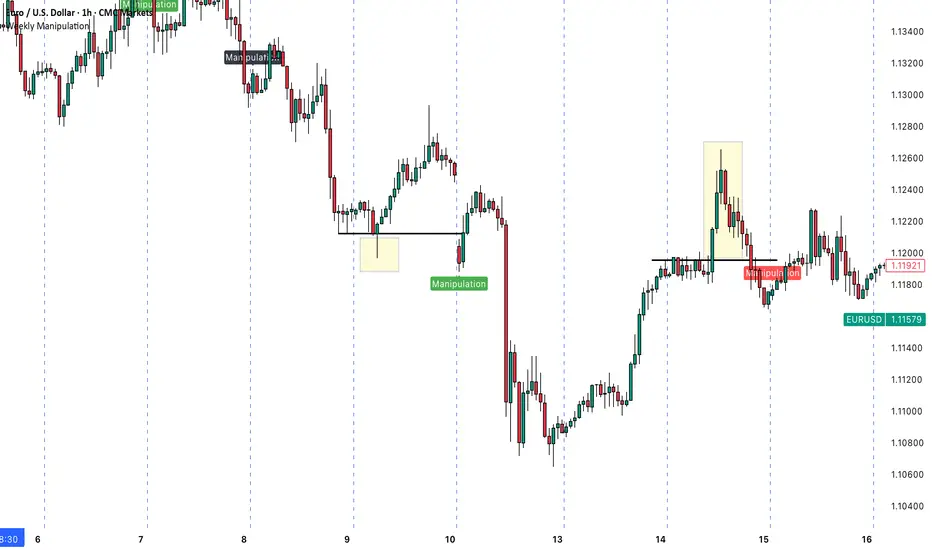
Weekly ManipulationUnderstanding the "Weekly Manipulation" Indicator
The "Weekly Manipulation" indicator is a powerful tool designed to identify false breakouts in the market—moments. Let me explain how it works in simple terms.
What This Indicator Detects
This indicator spots two specific market behaviors that often indicate manipulation:
1. Single-Day Manipulation (Red/Green Labels)
This occurs when price briefly breaks through a significant daily level but fails to maintain the momentum:
Bearish Manipulation (Red): Price pushes above the previous day's high, but then reverses and closes below that high.
Bullish Manipulation (Green): Price drops below the previous day's low), but then reverses and closes above that low.
2. Two-Day Manipulation (Black Labels)
This is a more complex version of the same pattern, but occurring over a 2-day period. These signals can indicate even stronger manipulation attempts and potentially more powerful reversals.
Why This Matters for Your Trading
By identifying these patterns, you can:
- Avoid getting caught in false breakouts
- Find potential entry points after the manipulation is complete
- Understand when market action might not be genuine price discovery
How to Use This Indicator
1. Look for Red Markers: These appear when price has attempted to break higher but failed. This often suggests bearish potential going forward.
2. Look for Green Markers: These appear when price has attempted to break lower but failed. This often suggests bullish potential going forward.
3. Pay Attention to Black Markers: These 2-day patterns can signal stronger reversals and might be worth giving extra weight in your analysis.
The indicator labels these patterns clearly as "Manipulation" right on your chart, giving you an immediate visual cue when these potential setups occur.
Midpoint Line on Last Two Strong CandlesBreaking a mid point of the recent strong candle by its opposite candle can be considered as a trend reversal.

Golden chart v1## Golden Chart v1 – Trend Tracking & Signal Visualization Tool
**Version**: v1
**Pine Script**: version=5
**Visibility**: Invite-only
### Overview
Golden Chart v1 combines EMA-based trend bands (Golden Chart 2) with ATR-derived dynamic levels (Golden Chart 3) to help traders identify potential trend phases, visualize BUY/SELL signals, and color candles by trend direction.
### Key Features
- **Golden Chart 2 (EMA bands)**
- Calculates `emaHigh` & `emaLow` using `gc2_ema_period` (default 10)
- Determines SSL-style trend lines `sslUp` & `sslDown`
- **Golden Chart 3 (ATR levels)**
- Computes weighted ATR (`avgTR`) over `gc3_length` (default 13)
- Sets dynamic levels `hiLimit` & `loLimit` with `gc3_multiplier` (default 2.0)
- Plots `ret` line as the active trend level
- **Trade Signals**
- `BUY` label on bullish cross (`sslUp` → `sslDown` + close>open)
- `SELL` label on bearish cross (`sslDown` → `sslUp` + close **Request:** Invite-only v1 review for House Rules approval. Thank you!

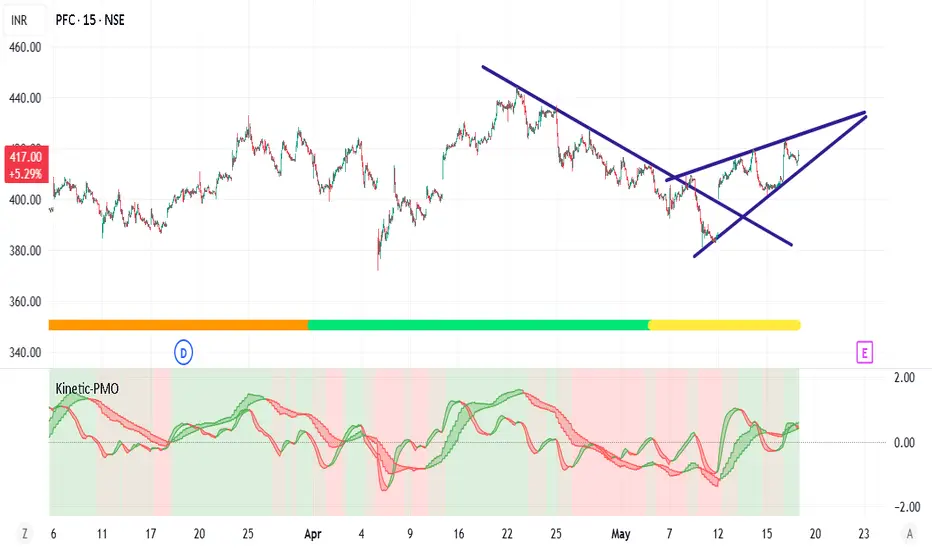
Kinetic Price Momentum Oscillator📈 Kinetic Price Momentum Oscillator (Sri-PMO)
Author's Note:
This script is an educational and custom-adapted visualization based on the concept of the Price Momentum Oscillator (PMO). It is not a direct clone of any proprietary implementation, and it introduces enhancements such as timeframe sensitivity, customizable smoothings, multi-timeframe analysis, and visual trend meters.
🔍 Overview:
The Kinetic Price Momentum Oscillator (Kinetic-PMO) is a dynamic momentum indicator that analyzes price rate of change smoothed with dual exponential moving averages. It offers a clear view of momentum trends across multiple timeframes—the chart's current timeframe, the 1-hour timeframe, and the 1-day timeframe. It includes optional visual cues for zero-line crossovers, trend ribbon fills, and a daily trend meter.
🧮 Calculation Logic:
At its core, Kinetic-PMO calculates momentum by:
Measuring Rate of Change (ROC) over 1 bar.
Applying double EMA smoothing:
The first smoothing (len1) smooths the ROC.
The second smoothing (len2) smooths the result further.
This produces the main KPMO Line.
A third EMA (sigLen) is applied to the KPMO line to produce the Signal Line.
The formula includes a multiplier of 10 to scale values.
pinescript
Copy
Edit
roc = ta.roc(source, 1)
kmo = ta.ema(10 * ta.ema(roc, len1), len2)
signal = ta.ema(kmo, sigLen)
To allow responsiveness across timeframes, the script provides sensitivity inputs (sensA, sensB, sensC) which dynamically scale the smoothing lengths for different contexts:
Intraday (current chart timeframe)
Hourly (1H)
Daily (1D)
🧭 Features:
✅ Multi-Timeframe Calculation:
Intraday: Based on current chart resolution
1H: PMO for the hourly trend
1D: Daily trend meter using KPMO structure
✅ Trend Identification:
Green if PMO is above Signal Line (bullish)
Red if PMO is below Signal Line (bearish)
Daily Trend Meter includes nuanced color mapping:
Lime = Bullish above zero
Orange = Bullish below zero
Red = Bearish below zero
Yellow = Bearish above zero
✅ Custom Visual Enhancements:
Optional filled ribbons between KPMO and Signal
Optional zero-line crossover background highlight
Compact daily trend meter displayed as a color-coded shape
🛠 Customization Parameters:
Input Description
Primary Smoothing Controls ROC smoothing depth (1st EMA)
Secondary Smoothing Controls final smoothing (2nd EMA)
Signal Smoothing Controls EMA of the PMO line
Input Source Default is close, but any price type can be selected
Sensitivity Factors Separate multipliers for intraday, 1H, and 1D
Visual Settings Toggle zero-line highlight and ribbon fill
🧠 Intended Use:
The Kinetic-PMO is suitable for trend confirmation, momentum divergence detection, and entry/exit refinement. The multi-timeframe aspect helps align short-term and long-term momentum trends, supporting better trade decision-making.
⚖️ Legal & Attribution Statement:
This script was independently created and modified for educational and analytical purposes. While the concept of the PMO is inspired by technical analysis literature, this implementation does not copy or reverse-engineer any proprietary code. It introduces custom parameters, visualization enhancements, and multi-timeframe logic. Posting this script complies with TradingView’s policy on derivative work and educational indicators.
HMA ATR Mean Reversion OscillatorMeasures how far the price deviates from a moving average (initially SMA, now HMA).
Normalizes this deviation using the Average True Range (ATR) to account for volatility.
Scales the result into a 0–100 oscillator, displayed in a separate pane (like RSI).
Identifies overbought (above 70) and oversold (below 30) conditions for potential mean reversion trades.
Added visual cues like green/yellow dots to indicate whether the price is above or below the mean.
