Daily High Breakout Strategy v2Long trade signal strategy, connects via API key to any exchange, can be used as an indicator. Based on breakout, rebound from daily highs.Estratégia Pine Script®por KriptoBotik115
[Backtest Crypto] Cross MAThis script is designed for testing the moving average crossover strategy. Script settings: Select testing range Indicator settings: Select moving average type (EMA, SMA, WMA, SMMA, HMA) and period Trade management: Select risk-to-reward ratio, stop-loss defined as min/max for a certain number of candles (you can set a desired number), option to partially lock in a position by moving the stop-loss to breakeven, trailing stop, or close a position on an opposite signal. Option to limit the stop-loss by ATR to prevent it from becoming too large during volatile movements. =============================================================== Скрипт предназначен для тестирования стратегии пересечение скользящих средних. Настройки скрипта: Выбор диапазона тестирования Настройки индикатора: выбор типа скользящей (EMA, SMA, WMA, SMMA, HMA) и периода Сопровождение сделки: выбор соотношения риска к прибыли, стоп-лосс определяется как мин/мах за определенное количество свечей (можно устанавливать желаемое количество), возможность частичной фиксации позиции с переносом стоп-лосса в безубыток, трейлинг-стоп, или закрытие позиции по противоположному сигналу. Возможность ограничения стоп-лосса по ATR, чтобы при волатильных движениях он не был слишком большим.Estratégia Pine Script®por Backtest_Crypto2
Simple Candle Strategy# Candle Pattern Strategy - Pine Script V6 ## Overview A TradingView trading strategy script (Pine Script V6) that identifies candlestick patterns over a configurable lookback period and generates trading signals based on pattern recognition rules. ## Strategy Logic The strategy analyzes the most recent N candlesticks (default: 5) and classifies their patterns into three categories, then generates buy/sell signals based on specific pattern combinations. ### Candlestick Pattern Classification Each candlestick is classified as one of three types: | Pattern | Definition | Formula | |---------|-----------|---------| | **Close at High** | Close price near the highest price of the candle | `(high - close) / (high - low) ≤ (1 - threshold)` | | **Close at Low** | Close price near the lowest price of the candle | `(close - low) / (high - low) ≤ (1 - threshold)` | | **Doji** | Opening and closing prices very close; long upper/lower wicks | `abs(close - open) / (high - low) ≤ threshold` | ### Trading Rules | Condition | Action | Signal | |-----------|--------|--------| | Number of Doji candles ≥ 3 | **SKIP** - Market is too chaotic | No trade | | "Close at High" count ≥ 2 + Last candle closes at high | **LONG** - Bullish confirmation | Buy Signal | | "Close at Low" count ≥ 2 + Last candle closes at low | **SHORT** - Bearish confirmation | Sell Signal | ## Configuration Parameters All parameters are adjustable in TradingView's "Settings/Inputs" tab: | Parameter | Default | Range | Description | |-----------|---------|-------|-------------| | **K-line Lookback Period** | 5 | 3-20 | Number of candlesticks to analyze | | **Doji Threshold** | 0.1 | 0.0-1.0 | Body size / Total range ratio for doji identification | | **Doji Count Limit** | 3 | 1-10 | Number of dojis that triggers skip signal | | **Close at High Proximity** | 0.9 | 0.5-1.0 | Required proximity to highest price (0.9 = 90%) | | **Close at Low Proximity** | 0.9 | 0.5-1.0 | Required proximity to lowest price (0.9 = 90%) | ### Parameter Tuning Guide #### Proximity Thresholds (Close at High/Low) - **0.95 or higher**: Stricter - only very strong candles qualify - **0.90 (default)**: Balanced - good for most market conditions - **0.80 or lower**: Looser - catches more patterns, higher false signals #### Doji Threshold - **0.05-0.10**: Strict doji identification - **0.10-0.15**: Standard doji detection - **0.15+**: Includes near-doji patterns #### Lookback Period - **3-5 bars**: Fast, sensitive to recent patterns - **5-10 bars**: Balanced approach - **10-20 bars**: Slower, filters out noise ## Visual Indicators ### Chart Markers - **Green Up Arrow** ▲: Long entry signal triggered - **Red Down Arrow** ▼: Short entry signal triggered - **Gray X**: Skip signal (too many dojis detected) ### Statistics Table Located at top-right corner, displays real-time pattern counts: - **Close at High**: Count of candles closing near the high - **Close at Low**: Count of candles closing near the low - **Doji**: Count of doji/near-doji patterns ### Signal Labels - Green label: "✓ Long condition met" - below entry bar - Red label: "✓ Short condition met" - above entry bar - Gray label: "⊠ Too many dojis, skip" - trade skipped ## Risk Management ### Exit Strategy The strategy includes built-in exit rules based on ATR (Average True Range): - **Stop Loss**: ATR × 2 - **Take Profit**: ATR × 3 Example: If ATR is $10, stop loss is at -$20 and take profit is at +$30 ### Position Sizing Default: 100% of equity per trade (adjustable in strategy properties) **Recommendation**: Reduce to 10-25% of equity for safer capital allocation ## How to Use ### 1. Copy the Script 1. Open TradingView 2. Go to Pine Script Editor 3. Create a new indicator 4. Copy the entire `candle_pattern_strategy.pine` content 5. Click "Add to Chart" ### 2. Apply to Chart - Select your preferred timeframe (1m, 5m, 15m, 1h, 4h, 1d) - Choose a trading symbol (stocks, forex, crypto, etc.) - The strategy will generate signals on all historical bars and in real-time ### 3. Configure Parameters 1. Right-click the strategy on chart → "Settings" 2. Adjust parameters in the "Inputs" tab 3. Strategy will recalculate automatically 4. Backtest results appear in the Strategy Tester panel ### 4. Backtesting 1. Click "Strategy Tester" (bottom panel) 2. Set date range for historical testing 3. Review performance metrics: - Win rate - Profit factor - Drawdown - Total returns ## Key Features ✅ **Execution Model Compliant** - Follows official Pine Script V6 standards ✅ **Global Scope** - All historical references in global scope for consistency ✅ **Adjustable Sensitivity** - Fine-tune all pattern detection thresholds ✅ **Real-time Updates** - Works on both historical and real-time bars ✅ **Visual Feedback** - Clear signals with labels and statistics table ✅ **Risk Management** - Built-in ATR-based stop loss and take profit ✅ **No Repainting** - Signals remain consistent after bar closes ## Important Notes ### Before Trading Live 1. **Backtest thoroughly**: Test on at least 6-12 months of historical data 2. **Paper trading first**: Practice with simulated trades 3. **Optimize parameters**: Find the best settings for your trading instrument 4. **Manage risk**: Never risk more than 1-2% per trade 5. **Monitor performance**: Review trades regularly and adjust as needed ### Market Conditions The strategy works best in: - Trending markets with clear directional bias - Range-bound markets with defined support/resistance - Markets with moderate volatility The strategy may underperform in: - Highly choppy/noisy markets (many false signals) - Markets with gaps or overnight gaps - Low liquidity periods ### Limitations - Works on chart timeframes only (not intrabar analysis) - Requires at least 5 bars of history (configurable) - Fixed exit rules may not suit all trading styles - No trend filtering (will trade both directions) ## Technical Details ### Historical Buffer Management The strategy declares maximum bars back to ensure enough historical data: ```pine max_bars_back(close, 20) max_bars_back(open, 20) max_bars_back(high, 20) max_bars_back(low, 20) ``` This prevents runtime errors when accessing historical candlestick data. ### Pattern Detection Algorithm ``` For each bar in lookback period: 1. Calculate (high - close) / (high - low) → close_to_high_ratio 2. If close_to_high_ratio ≤ (1 - threshold) → count as "Close at High" 3. Calculate (close - low) / (high - low) → close_to_low_ratio 4. If close_to_low_ratio ≤ (1 - threshold) → count as "Close at Low" 5. Calculate abs(close - open) / (high - low) → body_ratio 6. If body_ratio ≤ doji_threshold → count as "Doji" Signal Generation: 7. If doji_count ≥ cross_count_limit → SKIP_SIGNAL 8. If close_at_high_count ≥ 2 AND last_close_at_high → LONG_SIGNAL 9. If close_at_low_count ≥ 2 AND last_close_at_low → SHORT_SIGNAL ``` ## Example Scenarios ### Scenario 1: Bullish Signal ``` Last 5 bars pattern: Bar 1: Closes at high (95%) ✓ Bar 2: Closes at high (92%) ✓ Bar 3: Closes at mid (50%) Bar 4: Closes at low (10%) Bar 5: Closes at high (96%) ✓ (last bar) Result: - Close at high count: 3 (≥ 2) ✓ - Last closes at high: ✓ - Doji count: 0 (< 3) ✓ → LONG SIGNAL ✓ ``` ### Scenario 2: Skip Signal ``` Last 5 bars pattern: Bar 1: Doji pattern ✓ Bar 2: Doji pattern ✓ Bar 3: Closes at mid Bar 4: Doji pattern ✓ Bar 5: Closes at high Result: - Doji count: 3 (≥ 3) → SKIP SIGNAL - Market too chaotic ``` ## Performance Optimization ### Tips for Better Results 1. **Use Higher Timeframes**: 15m or higher reduces false signals 2. **Combine with Indicators**: Add volume or trend filters 3. **Seasonal Adjustment**: Different parameters for different seasons 4. **Instrument Selection**: Test on liquid, high-volume instruments 5. **Regular Rebalancing**: Adjust parameters quarterly based on performance ## Troubleshooting ### No Signals Generated - Check if lookback period is too large - Verify proximity thresholds aren't too strict (try 0.85 instead of 0.95) - Ensure doji limit allows for trading (try 4-5 instead of 3) ### Too Many False Signals - Increase proximity thresholds to 0.95+ - Reduce lookback period to 3-4 bars - Increase doji limit to 3-4 - Test on higher timeframes ### Strategy Tester Shows Losses - Review individual trades to identify patterns - Adjust stop loss and take profit ratios - Change lookback period and thresholds - Test on different market conditions ## References - (www.tradingview.com) - (www.tradingview.com) - (www.investopedia.com) - (www.investopedia.com) ## Disclaimer **This strategy is provided for educational and research purposes only.** - Not financial advice - Past performance does not guarantee future results - Always conduct thorough backtesting before live trading - Trading involves significant risk of loss - Use proper risk management and position sizing ## License Created: December 15, 2025 Version: 1.0 --- **For updates and modifications, refer to the accompanying documentation files.** Estratégia Pine Script®por masteraux10127
Backtest any Indicator [Target Mode] StrategyUniversal Backtester Strategy with Sequential Logic This strategy serves as a highly versatile, universal backtesting engine designed to test virtually any indicator-based trading system without requiring custom code for every new idea. It transforms standard indicator comparisons into a robust trading strategy with advanced features like sequential entry steps, dynamic target modes, and automated webhook alerts. The core philosophy of this script is flexibility. Whether you are testing simple crossovers (e.g., MA Cross) or complex multi-stage setups (e.g., RSI overbought followed by a MACD flip), this tool allows you to configure logic via the settings panel and immediately see backtested results with professional-grade risk management. Core Logic: Source vs. Target Mode The fundamental building block of this strategy is the "Comparator" engine. Instead of hard-coding specific indicators, the script allows users to define logic slots (L1-L5 for Longs, S1-S5 for Shorts). Each slot operates on a flexible comparison logic: Source: The primary indicator you are testing (e.g., Close Price, RSI, Volume). Operator: The condition to check (Equal/Cross, Greater Than, Less Than). Target Mode: Value Mode: Compares the Source against a fixed number (e.g., RSI > 70). Source Mode: Compares the Source against another dynamic indicator (e.g., Close > SMA 200). This "Target Mode" switch allows the strategy to adapt to almost any technical analysis concept, from oscillator levels to moving average trends. Advanced Entry System: Sequential Steps (1-5) Unlike standard backtesters that usually require all conditions to happen simultaneously (AND logic), this strategy implements a State Machine for sequential execution. Each of the 5 entry slots (L1-L5 / S1-S5) is assigned a "Step" number. The logic flows as follows: Stage 1: The strategy waits for all conditions assigned to "Step 1" to be true. Latch & Wait: Once Step 1 is met, the strategy "remembers" this and advances to Stage 2. It waits for a subsequent bar to satisfy Step 2 conditions. Trigger: The actual trade entry is only executed once the highest assigned step is completed. Example Use Case: Step 1: Price closes below the Lower Bollinger Band (Dip). Step 2: RSI crosses back above 30 (Confirmation). Execution: Buy Signal triggers on the Step 2 confirmation candle. This creates a realistic "Setup -> Trigger" workflow common in professional trading, preventing premature entries. Exit Logic & Risk Management The strategy employs a dual-layer exit system to maximize profit retention and protect capital. 1. Signal-Based Exits (OR Logic) There are 5 configurable exit slots (LX1-LX5 / SX1-SX5). Unlike entries, these operate on "OR" logic. If any enabled exit condition is met (e.g., RSI becomes overbought OR Price crosses below EMA), the position is closed immediately. 2. Hard Stop & Take Profit Fixed %: Users can set a hard percentage-based Stop Loss and Take Profit. Trailing Stop: A toggleable "Trailing?" feature allows the Stop Loss to dynamically trail the price. Longs: The SL moves up as the price makes new highs. Shorts: The SL moves down as the price makes new lows. Automated Alerts & Webhooks This script is built with automation in mind. It includes a dedicated makeJson() function that constructs a JSON payload compatible with most trading bots (e.g., 3Commas, TradersPost, Tealstreet). Alert Modes Supported: | Alert Type | Description | | :--- | :--- | | Order Fills Only | Triggers standard TradingView strategy alerts when the broker emulator fills an order. | | Alert() Function | Triggers specific JSON payloads defined in the code ("action": "buy", "ticker": "MNQ", etc.). | The script automatically calculates the alert quantity based on your equity percentage settings, ensuring the payload matches your backtest sizing. Dashboard & Visuals To aid in rapid analysis, the strategy includes visual tools directly on the chart: Performance Table: A dashboard (top-right) displays real-time stats including Net Profit, Win Rate, Profit Factor, and Max Drawdown. Trade Markers: Custom labels (goLong, exLong) show exactly where trades opened and closed, including the trade number and profit percentage. SL/TP Visualization: Dynamic step-lines (Orange for SL, Lime for TP) show exactly where your protection levels are sitting, helping you visually verify if your stops are too tight or too loose.Estratégia Pine Script®por jegbejimbaAtualizado 5
AlgoIndex NQ/MNQ FuturesAlgoIndex Futures v3.15 - NQ/MNQ (10-Minute RTH) This strategy is specifically tailored for trading CME Nasdaq futures - NQ and MNQ, including continuous symbols such as NQ1!/MNQ1!. It is optimized for a 10-minute chart during U.S. Regular Trading Hours (RTH), utilizing session settings defined in the Inputs. This strategy is not intended for other futures contracts or markets. Core Concept The strategy employs an ATR-based trend-band model similar to Supertrend for identifying directional mechanism changes in NQ/MNQ. Trade signals are evaluated at the bar close, incorporating session and time-based safety techniques to mitigate lower-quality trading opportunities near session boundaries. Recommended Use (Optimized Defaults) The default input parameters are fine-tuned for NQ/MNQ on the 10-minute chart. Users are encouraged to utilize these defaults initially and to make incremental adjustments to one variable at a time to understand the impact on the strategy's performance, trading frequency, and risk profile. Configurable Inputs - Take Profit / Stop Loss Settings: - Enable Stop Loss and define Stop Loss (Points) - Enable Take Profit and define Take Profit (Points) - Enable Trailing Stop and set both Trailing Stop (Points) and Trailing Offset (Points) - Time Avoidance Filter: - Enable Time Avoidance - Avoid First X Minutes - Avoid Last X Minutes - Display Avoidance Zones (visual overlay) - Session Filter and End-of-Day Management: - Enable Session Filter - Define Trading Session (default: 09:30-16:00) - Select Session Timezone - Option to Close Positions at Session End - Specify EOD Close Minutes Before (default: 20) - Safety Controls: - Option to Close Before Holidays (when enabled, this feature allows the strategy to flatten positions prior to holiday or early close conditions) - Automation Settings (Optional): - Ticker Override (optional) - Define Contracts (position size) - Strategy Configuration: - Trade Direction: Both / Long Only / Short Only - Visual Configuration: - Option to Show Buy/Sell Signals - Highlight Trend Zones - Display Info Table - Customizable Bull/Bear Colors Alerts and Automation (Optional) This strategy can generate order-fill alert payloads for hooking into webhook-based automation solutions. Keep in mind to validate your alert type and your bridge/broker configuration during Replay and paper trading. Note that reversals may trigger two sequential actions (e.g., exit followed by new entry). Backtest Notes (Optional) For more precise historical fill data, consider enabling TradingView’s Bar Magnifier in Strategy Properties. Always apply consistent assumptions for commission and slippage when comparing backtest results. Disclaimer This script is intended for informational and educational purposes only and does not constitute investment advice. Trading futures carries significant risk and may result in losses that exceed the initial deposit. Backtested results are hypothetical and do not guarantee future performance.Estratégia Pine Script®por MyAlgoIndex4
Gann High Low Strategy## Trend & Structure Strategy — Overview This strategy is designed to follow directional market moves by using a **dynamic price reference** to identify transitions between strength and weakness. ### Core concept * It visually highlights when the market shifts from a **favorable phase** to an **unfavorable phase**, and vice versa. * Signals are generated only when price behavior shows **minimum structural consistency**, helping to avoid random or low-quality conditions. ### Entries & trade management * Entries aim to align with moments where price shows a **renewed directional intent**. * Trade management is based on **technical price references**, allowing risk and objectives to adapt naturally to the current market context. * Key directional and operational areas are clearly displayed on the chart to keep decision-making simple and visual. ### Best use cases * Performs best in markets with **clear directional movement** and readable transitions. * In very tight or choppy conditions, a more selective approach may be required. *This content is for educational purposes only. Always test on different markets and timeframes before live use.* Estratégia Pine Script®por alblanzAtualizado 4
Momentum Quality Index Strategyfiles.fm Welcome to the Momentum Quality Index Strategy! This is a fairly conservative strategy with a sharp criteria for entries and taking profits. This strategy has been tested amongst the top 50 stocks with volatility over 2%, and the verdict was that the profitability was often times over 85% profitability, often times reaching over 90% profitability. This strategy thrives in more volatile environments, often times beating the buying and holding strategy YTD performance by large margins. This strategy is highly optimized for the 30 minute chart, giving insights into shorter term movements. It is based on cash trades of $1,000 per position, with a maximum of 4 trades being placed at once. This strategy is optimized for common stock trading in more liquid markets, and not yet optimized for options trading (however I plan on developing highly profitable strategies for this purpose soon). The take profit is customizable. I would refer to the image link I have posted at the top of this article for the strategy's effectiveness. The strategy report on this article isn't accurate, as this strategy is based on trading $1,000 per trade, therefore over longer term periods of time will not be as successful due to the fact that there is no compounding. However, over the course of smaller time frames (such as one year), it beats buying and holding of many assets. This strategy is meant for day trading and short term swing trading, and is not meant to beat buying and holding of successful assets over the course of long periods of time.Estratégia Pine Script®por tradequam1
FTSE Santa - Late Dec 12d (Optimised Exit)Simple Santa Rally Strategy. Once a year, in late December, it waits for a sensible (non-spiky) day to get long FTSE, then either stops out around −4%, gets trailed out in profit if it rallies, or exits after about 12 trading days.Estratégia Pine Script®por 1929TRA21
ORB Strategy - EnhancedThis algo is for setting and forgetting ORB. Does require an understanding of how to tweak trading factors Estratégia Pine Script®por DreamweaverFX2210
Institutional Execution Engine v3 [Nishith Rajwar] Institutional Execution Engine v3 Market-Structure-Driven Execution Framework (Indicator + Strategy Hybrid) The **Institutional Execution Engine v3** is a professional-grade execution framework designed to model **how institutional participants interact with liquidity, volatility regimes, and market structure**. It is built for **index traders, crypto traders, and systematic intraday participants** who require **non-repainting, forward-validated signals** with strict risk control. This is **not a mashup of indicators**. Every module is purpose-built and interacts through a unified execution pipeline. --- 🔍 Core Concepts & Methodology 1️⃣ Market Structure & POI Engine * Identifies **Points of Interest (POIs)** using swing structure, volatility context, and liquidity positioning * POIs are **confirmed only after bar close** (strict non-repaint enforcement) * Adaptive pivot sensitivity based on selected execution preset 2️⃣ Liquidity-Aware Scoring System Each potential trade is filtered through a **multi-factor execution score**, including: * Structural alignment * Volatility normalization (ATR regime) * Liquidity reaction quality * Directional efficiency Trades are only allowed when the **minimum institutional score threshold** is met. 3️⃣ Regime Detection (Forward-Walk Safe) The engine dynamically classifies market conditions into execution regimes: * Trending * Rotational * Mean-reverting Regime detection is **forward-walk compatible** and does **not leak future data**. 4️⃣ Risk-First Execution Model * ATR-normalized stop placement * R-multiple-based take-profit targeting * Optional **single-trade-per-session guard** * Strategy engine includes **open-trade protection** to prevent over-execution 5️⃣ Strategy + Indicator Hybrid This script can be used in **two ways**: * **Indicator mode** → discretionary execution with visual POIs, signals, and context * **Strategy mode** → systematic backtesting with full TradingView Strategy Tester support Both modes share the **same execution logic** (no divergence). --- ⚙️ Preset-Driven Architecture Built-in execution presets auto-configure internal parameters without changing core logic: * **Scalp (Index)** * **Daytrade (Index)** * **Crypto Intraday** * **Institutional Research (FWalk)** Presets adjust pivot sensitivity, score thresholds, ATR behavior, and risk profile — while preserving execution integrity. --- ## 🚫 Non-Repainting & Data Integrity * No look-ahead bias * No future bar references * No repainting signals * VWAP and regime logic reset correctly per session * Safe handling of strategy.opentrades to avoid execution errors All signals are **bar-close confirmed**. --- 📊 Who This Is For ✔ Index traders (NIFTY / BANKNIFTY / SENSEX) ✔ Crypto intraday traders ✔ Systematic traders validating execution logic ✔ Traders who value **structure + liquidity + risk discipline** over indicators --- ⚠️ Disclaimer This script is a **research and execution framework**, not financial advice. Always forward-test and adapt risk parameters to your instrument and timeframe. --- **Author:** Nishith Rajwar **Version:** v3 **Execution Philosophy:** Trade where institutions execute — not where indicators react. Estratégia Pine Script®por nishith8544166424
Monarch Strategies Altcoin Optimized Cycle & Trend Strategy (1W)The Altcoin Optimized Cycle & Trend Strategy (1W) is a professional, long-term cycle and trend trading strategy designed specifically for altcoins such as Stellar (XLM). It is built for traders and investors who want to systematically capture explosive altcoin cycles while avoiding emotional decision-making and excessive trading. The strategy operates on the weekly timeframe (1W) and focuses on identifying major accumulation zones, breakout phases, and distribution tops that typically define altcoin market behavior.Estratégia Pine Script®por Monarch_Strategies0
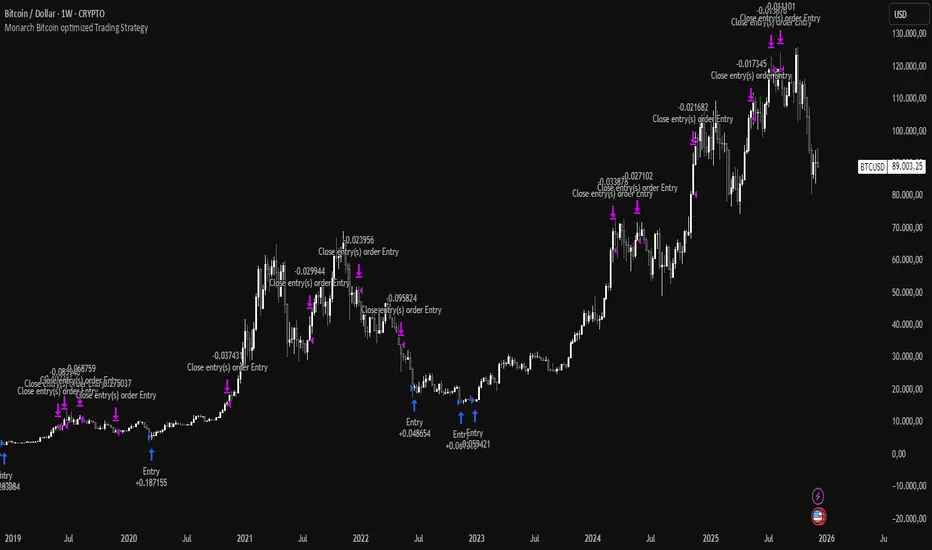
Monarch Strategies BTC Optimized Cycle & Trend Strategy (1W)The "BTC Optimized Cycle & Trend Strategy (1W)" is a high-quality, long-term optimized trading strategy for BTC/USD, designed for traders and investors who want to systematically trade major market cycles — without overtrading, without emotions, and without unnecessary complexity. The strategy is specifically built for the weekly timeframe (1W) and focuses on what Bitcoin has historically done best: strong, multi-year trend movements.Estratégia Pine Script®por Monarch_Strategies0
ARVEXV1“Failed Reversal – Opposite Candle Only (No Doji/Hammer/Hanging Man)”: This strategy captures failed reversal attempts where the current candle is opposite to the previous candle and volume is higher. It enters long if a bearish candle fails to break a previous bullish candle’s low, and short if a bullish candle fails to break a previous bearish candle’s high. Signals are canceled for Doji, Hammer, or Hanging Man candles. Entries only, fully backtestable.Estratégia Pine Script®por riccabunalda23
ARVEX V1“Failed Reversal – Opposite Candle Only (No Doji/Hammer/Hanging Man)”: This strategy captures failed reversal attempts where the current candle is opposite to the previous candle and volume is higher. It enters long if a bearish candle fails to break a previous bullish candle’s low, and short if a bullish candle fails to break a previous bearish candle’s high. Signals are canceled for Doji, Hammer, or Hanging Man candles. Entries only, fully backtestable.Estratégia Pine Script®por riccabunalda8
Ribbon Cross Strategy This strategy uses a simple moving-average ribbon crossover system with a customizable entry filter. You can choose whether trades trigger near the fast or slow average, allowing flexibility in capturing early or confirmed trend moves. It’s best suited for index trading on intraday timeframes , helping identify short-term trend reversals and continuations with clear visual cues and backtestable logic.Estratégia Pine Script®por RAHUL99_996
Buy-Dip / Sell-Pullback Buy the Dip / Sell the Pullback – Trend-Following Strategy (EOD → Next Day Execution) Overview This is a trend-following futures strategy designed to participate in pullbacks within established trends, not to predict reversals. It works on End-of-Day (EOD) confirmation and executes trades on the next trading session, making it suitable for positional and swing traders. The strategy combines momentum, trend direction, volatility, and price location to filter for high-quality setups while avoiding overtrading. 🔍 Core Philosophy Trade only in the direction of the prevailing trend Buy dips in uptrends Sell pullbacks in downtrends Avoid chasing price after extended gaps Use volatility-adjusted risk management (ATR-based SL & targets) 📊 Indicators Used RSI (20) Measures underlying momentum strength Stochastic Oscillator (55, 34, 21) Confirms pullback exhaustion within a trend Supertrend (10, 2) Defines primary trend direction Bollinger Bands (20, 2) Provides structural trend bias ATR (5) Used for: Entry gap filter Stop-loss Profit target Supertrend buffer ✅ Long (Buy) Setup – Evaluated at EOD A long setup is generated when all of the following conditions are satisfied at the close of the trading day: RSI(20) is above the bullish threshold (default: 48) Stochastic %K is above %D (confirming pullback momentum) Supertrend direction is bullish Price is near or above Supertrend, allowing a volatility-adjusted buffer (ATR-based) Price is above the Bollinger Band middle line This combination ensures: The market is trending up Momentum supports continuation The pullback is controlled, not a breakdown ❌ Short (Sell) Setup – Evaluated at EOD A short setup is generated when: RSI(20) is below the bearish threshold (default: 52) Stochastic %K is below %D Supertrend direction is bearish Price is near or below Supertrend, with an ATR buffer Price is below the Bollinger Band middle line This filters for pullbacks within sustained downtrends. ⏰ Trade Execution Logic (Next Day Rule) Once a setup is confirmed at EOD, a trade is attempted on the next trading session To avoid chasing gaps: Long trades are allowed only if price does not move more than a defined multiple of the previous day’s True Range Short trades follow the same logic in reverse This is implemented via limit orders, ensuring realistic backtesting and execution behavior 🛑 Risk Management All exits are volatility-adjusted using ATR: Stop-Loss: 1.1 × ATR(5) from entry price Target: 2.2 × ATR(5) from entry price This results in a risk–reward ratio of approximately 1:2 ATR is frozen at entry to avoid forward-looking bias. 🧠 Why This Strategy Works Avoids low-quality trades during consolidation Participates only when trend + momentum align Prevents emotional gap-chasing Adapts automatically to changing volatility Suitable for index futures and liquid stocks 📌 Recommended Usage Timeframe: Daily Instruments: Index Futures (e.g. NIFTY, BANKNIFTY) Highly liquid stocks Market Type: Trending markets Not ideal for: Sideways or low-volatility environments ⚙️ Customization Tips You can control trade frequency and aggressiveness by adjusting: RSI thresholds Supertrend buffer (ATR multiple) Gap filter multiplier Stochastic edge parameter Looser settings → more trades Stricter settings → higher selectivity ⚠️ Disclaimer This strategy is for educational and research purposes only. Backtest results do not guarantee future performance. Always validate with paper trading before deploying real capital.Estratégia Pine Script®por Praveenmishrainvestments25
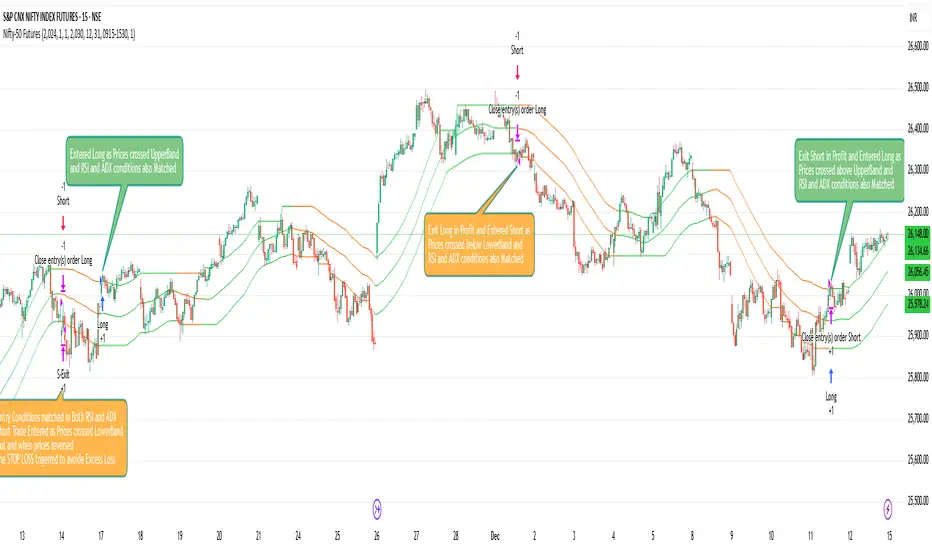
Nifty-50 Futures Trading Ideas/ Strategyb]Nifty-50 Futures Trading Ideas is a trend-following strategy designed for study and backtesting . The strategy identifies directional bias using a structured price-based approach and applies ADX + DI and RSI filters to validate trend strength. It includes inbuilt risk-management logic such as Stop-Loss, Take-Profit, ATR-based exits, separate maximum loss per trade (₹) for long and short positions, and optional date/session filters. This script is provided for educational and analytical purposes only and is not a trading signal or investment recommendation. Estratégia Pine Script®por Alpha_Trinity1
Time Syndicate: Prop Firm SpecialTime Syndicate – Prop-Firm Special (Exit-Focused Edition) Overview Time Syndicate – Master Strategy is a non-repainting, cycle-aware execution framework designed to trade structured market phases rather than random price movement. This version has been specifically updated to focus on exit efficiency , trade management, and controlled trade churn. The strategy is built to align trades with time-based market behavior and liquidity expansion, without relying on indicator stacking or repainting logic. What This Version Is Optimized For This update emphasizes: • More structured exits • Increased trade churning • Improved realized profitability • Mechanical trailing stop execution The goal is not to increase entries, but to extract more value from correct ones . Recommended Markets • EUR/USD • NASDAQ (NQ / US100 Cash CFD) This strategy is primarily designed and tested for these instruments. Recommended Cycles & Timeframes 90-Minute Cycle → Use 1-Minute chart Session Cycle → Use 5-Minute chart Do not mismatch cycle selection and chart timeframe. Important Settings (Do Not Over-Optimize) • Exit Mode: Trailing Stop (Default & Recommended) • Max Trades Per Cycle: 1 • Target: 1 : 1.5 • Most other settings should remain unchanged This is not a parameter-tuning strategy. Trade Behavior • Trade Status remains FLAT until a valid trade is triggered • After entry, the dashboard displays: – Entry Price – Initial Stop Loss – Trailing Trigger Level – Live Trailing Stop (once activated) In most cases, the entry candle’s low/high will act as the initial stop loss. Exit Logic Trailing Stop Mode • Trailing activates only after price reaches the required expansion level • Trailing is mechanical and non-emotional • Live trailing stop updates are shown clearly on the chart Fixed Target Mode • Available for testing purposes • Not recommended for live execution Non-Repainting Logic • All zones, cycles, and trade logic are non-repainting • No historical shifting • What appears live is final Known Limitations (Current Version) • Quantity calculation can be aggressive, especially on 1-minute charts • Manual quantity is recommended for now • Not every valid signal should be traded These will be refined in future updates. Recommended Trading Window For US100 Cash CFD: 4:00 PM – 8:00 PM IST Outside this window, liquidity behavior becomes inconsistent. Advanced Usage Tip Download strategy trade data and analyze: • Time of day • Cycle performance • Trade outcomes Use this data to determine the most effective trading hours for your instrument. Purpose of This Strategy This is not a signal-spamming indicator. It is a professional execution framework built to: • Enforce discipline • Improve exit quality • Reduce emotional decision-making • Align trades with structured market phases Final Note This strategy does not predict the market. It waits, reacts, and extracts. Use it with patience, proper risk control, and respect for time-based structure.Estratégia Pine Script®por akshaykiriti1443Atualizado 6
Smart Money Bot [MTF Confluence Edition]Uses multi-time frame analysis and supply and demand strategy. Best used when swing trading.Estratégia Pine Script®por bakinyemi24Atualizado 29
Wealth Pilot AlphaTrend + RSI StrategyWealth Pilot AlphaTrend + RSI Strategy Works on Multi Time frames and across Different pairsEstratégia Pine Script®por bill_mm3
Nifty-50 Futures trading ideas with RSI and ADX FilterNifty Futures @15M is a trend-following strategy derived from the Savitzky Flow Bands methodology by ChartPrime , adapted into a complete strategy with structured trade execution and risk controls. The strategy identifies directional bias using a Savitzky-smoothed price structure and executes trades based on trend changes or continuation, depending on the selected entry mode. Configurable Entry Modes are : 1. Change Only (trend reversal based) 2.Continuation Allowed (trend follow-through). Optional ADX + DI and RSI filters help validate trend strength and avoid unfavorable market conditions. Risk management features include configurable Stop-Loss and Take-Profit, ATR-based exits, trailing stop, and separate maximum loss per trade (₹) for long and short positions. Date and session filters are provided for controlled backtesting. This script is published for educational and analytical purposes only and is intended for research and backtesting, not as a trading signal or investment recommendation. Credits: Original indicator concept: Savitzky Flow Bands by ChartPrime Strategy conversion & enhancements: @Alpha_Trinity Estratégia Pine Script®por Alpha_Trinity3
FxAST LiteWave Universal Profiles (intraday / swing)FxAST Lite Wave — Universal (Profiles) This strategy is intended for educational and analytical use. Derivative works must retain attribution and license terms. _____________________________________________________________________________ Overview FxAST Lite Wave is a rule-based trend participation strategy designed to adapt across multiple markets and timeframes using a simple profile switch. Rather than attempting to predict reversals or tops and bottoms, the strategy focuses on identifying continuation opportunities once directional alignment and market participation are already present. Its purpose is to provide a structured, repeatable framework for studying trend behavior and managing trades within established directional moves. _______________________________________________________________________________ How It Works FxAST Lite Wave evaluates market conditions using a layered confirmation process that includes: • Directional bias • Trend alignment • Momentum participation • Volatility suitability • Market regime awareness Trades are only considered when these conditions align, helping to reduce low-quality signals and overtrading during unfavorable environments. Two built-in profiles are provided: Intraday — designed for shorter-term participation Swing — designed for higher-timeframe continuation _______________________________________________________________________________ Core Concepts (Plain English) Direction Identifies which side of the market is currently in control. This answers: “Is pressure aligned for continuation?” _______________________________________________________________________________ Momentum Confirms that price is moving with intent rather than drifting or stalling. This answers: “Is participation present?” _______________________________________________________________________________ Regime Filters out unfavorable conditions such as congestion, compression, or low-energy chop. This answers: “Is this a tradable environment?” _______________________________________________________________________________ Continuation Focus Entries are designed to occur after alignmen t, not at arbitrary turning points. The strategy favors: • Pullbacks within trend • Momentum resumption • Sustained directional movement _______________________________________________________________________________ Risk & Trade Management FxAST Lite Wave includes structured trade management logic: • Volatility-aware initial risk • Optional partial profit taking • Optional breakeven and trailing behavior • Optional time-based exits • Optional equity-based position sizing A built-in on-chart Backtesting HUB displays live performance statistics for transparency and review. _______________________________________________________________________________ Philosophy FxAST Lite Wave is intentionally not a signal-spamming strategy . It is designed to: • Reduce decision fatigue • Encourage rule-based consistency • Support disciplined execution If you need: precise entries → use price action precise exits → use structure system context → use Lite Wave _______________________________________________________________________________ Disclaimer This strategy is provided for educational and analytical purposes only and does not constitute financial advice. Trading involves risk, and users are responsible for their own decisions. responsible for their own decisions.Estratégia Pine Script®por alldyn_pip_king7
Crypto LONG PYThis trading approach is a powerful combination of technical tools aimed at taking advantage of market fluctuations with precision and reliability. By integrating Bollinger Bands (BB), the Relative Strength Index (RSI), Exponential Moving Averages (EMA), and Fibonacci retracement levels (Fib), we create a strategy that captures key market moves and helps identify optimal entry and exit points, all within the context of the New York market conditions (NY). Bollinger Bands provide insight into market volatility, offering signals about potential extreme price movements. The RSI is used to measure momentum and assess overbought or oversold conditions, indicating when the market might be nearing a reversal. Meanwhile, EMAs add a layer of smoothing, allowing us to observe short- and medium-term trends, helping filter out false signals and providing a clearer view of the overall market direction. Additionally, Fibonacci retracements are integrated to identify key support and resistance levels, pinpointing potential areas of price retracement and continuation. When combined, these indicators offer a holistic approach to navigating the markets, enabling traders to make data-driven, informed decisions. This approach is ideal for traders looking for a meticulous methodology for trading during the NY session, where liquidity and volatility tend to be at their highest. Leverage the synergy between these indicators to optimize your trading strategy and maximize your market performance.Estratégia Pine Script®por Saletrader18