Indicadores e estratégias

AI Candlestick Pattern Identifier — Arrows & AlertsAI shows you high confidence candlestick patterns so that you can identify them quickly. Buy/Sell arrows will be placed alongside the pattern to alert you of which direction the indicator believes the market will go, as well as showing you the confidence in that indicator.

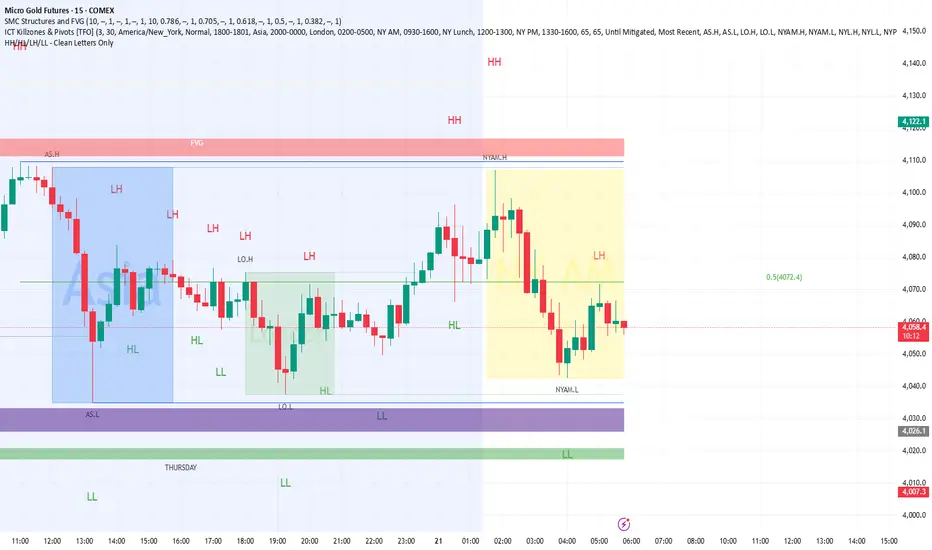
HH/HL/LH/LL - Bigger Letter MArkingAlam's Money
//@version=6
indicator("HH/HL/LH/LL - Clean Letters Only", overlay = true, max_labels_count = 500)
// Pivot confirmation bars (fixed)
L = 2
R = 2
// Confirmed pivots (appear R bars after turn)
sh = ta.pivothigh(high, L, R)
sl = ta.pivotlow(low, L, R)
// Keep last confirmed swing values
var float lastHigh = na
var float lastLow = na
// Swing highs → HH / LH
if not na(sh)
if na(lastHigh)
lastHigh := sh
else
string txtH = sh > lastHigh ? "HH" : "LH"
label.new(bar_index - R, sh, txtH, xloc.bar_index, yloc.price, color.new(color.white, 100), label.style_label_down, color.red, size.large)
lastHigh := sh
// Swing lows → HL / LL
if not na(sl)
if na(lastLow)
lastLow := sl
else
string txtL = sl > lastLow ? "HL" : "LL"
label.new(bar_index - R, sl, txtL, xloc.bar_index, yloc.price, color.new(color.white, 100), label.style_label_up, color.green, size.large)
lastLow := sl

Mirror Blocks: StrategyMirror Blocks is an educational structural-wave model built around a unique concept:
the interaction of mirrored weighted moving averages (“blocks”) that reflect shifts in market structure as price transitions between layered symmetry zones.
Rather than attempting to “predict” markets, the Mirror Blocks framework visualizes how price behaves when it expands away from, contracts toward, or flips across stacked WMA structures. These mirrored layers form a wave-like block system that highlights transitional zones in a clean, mechanical way.
This strategy version allows you to study how these structural transitions behave in different environments and on different timeframes.
The goal is understanding wave structure, not generating signals.
How It Works
Mirror Blocks builds three mirrored layers:
Top Block (Structural High Symmetry)
Base Block (Neutral Wave)
Bottom Block (Structural Low Symmetry)
The relative position of these blocks — and how price interacts with them — helps visualize:
Compression and expansion
Reversal zones
Wave stability
Momentum transitions
Structure flips
A structure is considered bullish-stack aligned when:
Top > Base > Bottom
and bearish-stack aligned when:
Bottom > Base > Top
These formations create the core of the Mirror Blocks wave engine.
What the Strategy Version Adds
This version includes:
Long Only, Short Only, or Long & Short modes
Adjustable symmetry distance (Mirror Distance)
Configurable WMA smoothing length
Optional trend filter using fast/slow MA comparison
ENTER / EXIT / LONG / SHORT labels for structural transitions
Fixed stop-loss controls for research
A clean, transparent structure with no hidden components
It is optimized for educational chart study, not automated signals.
Intended Purpose
Mirror Blocks is meant to help traders:
Study structural transitions
Understand symmetry-based wave models
Explore how price interacts with mirrored layers
Examine reversals and expansions from a mechanical perspective
Conduct long and short backtesting for research
Develop a deeper sense of market rhythm
This is not a prediction model.
It is a visual and structural framework for understanding movement.
Backtesting Disclaimer
Backtest results can vary depending on:
Slippage settings
Commission settings
Timeframe
Asset volatility
Structural sensitivity parameters
Past performance does not guarantee future results.
Use this as a research tool only.
Warnings & Compliance
This script is educational.
It is not financial advice.
It does not provide signals.
It does not promise profitability.
The purpose is to help visualize structure, not predict price.
The strategy features are simply here to help users study how structural transitions behave under various conditions.
License
Released under the Michael Culpepper Gratitude License (2025).
Use and modify freely for education and research with attribution.
No resale.
No promises of profitability.
Purpose is understanding, not signals.

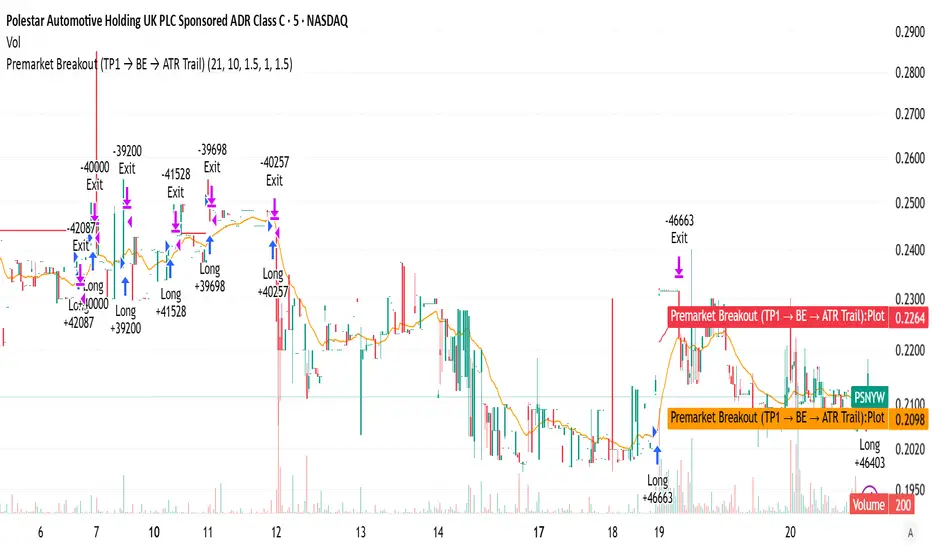
Premarket Breakout (TP1 → BE → ATR Trail)the best one you can find a very good indicator and strategy to help with al l trading needs in every way
Regression Channel + Levels + RSI Divergence Description:
This multi-tool script combines a regression channel, pivot levels, RSI divergence, and trade signals with a fakeout filter to help traders identify high-probability setups.
Key Features:
Regression Channel: Linear regression with smoothed upper, middle, and lower bands to highlight trend and volatility.
Ultra Strong Levels: Detects key pivot highs and lows, acting as reliable support/resistance zones.
RSI Divergence: Identifies bullish and bearish divergences for potential reversals.
Trade Signals with Fakeout Filter:
LONG ✔ for bullish setups
SHORT ✔ for bearish setups
WAIT ✖ when conditions are not favorable
Avoids false signals by filtering short-term spikes and RSI extremes.
Info Table: Displays RSI, divergence type, and current trade signal for quick reference.
Inputs:
Regression Window (bars for regression)
Pivot Strength (bars for pivot detection)
Minimum Distance Between Levels (%)
Max Levels Up/Down
RSI Length
Usage:
Use the regression channel to gauge trend direction.
Treat pivot levels as strong support/resistance.
Confirm RSI divergences and trade signals before executing trades.
Best used in conjunction with volume and price action analysis.

Hash Momentum Strategy# Hash Momentum Strategy
## 📊 Overview
The **Hash Momentum Strategy** is a professional-grade momentum trading system designed to capture strong directional price movements with precision timing and intelligent risk management. Unlike traditional EMA crossover strategies, this system uses momentum acceleration as its primary signal, resulting in earlier entries and better risk-to-reward ratios.
---
## ⚡ What Makes This Strategy Unique
### 1. Momentum-Based Entry System
Most strategies rely on lagging indicators like moving average crossovers. This strategy captures momentum *acceleration* - entering when price movement is gaining strength, not after the move has already happened.
### 2. Programmable Risk-to-Reward
Set your exact R:R ratio (1:2, 1:2.5, 1:3, etc.) and the strategy automatically calculates stop loss and take profit levels. No more guessing or manual calculations.
### 3. Smart Partial Profit Taking
Lock in profits at multiple stages:
- **First TP**: Take 50% off at 2R
- **Second TP**: Take 40% off at 2.5R
- **Final TP**: Let 10% ride to maximum target
This approach locks in gains while letting winners run.
### 4. Dynamic Momentum Threshold
Uses ATR (Average True Range) multiplied by your threshold setting to adapt to market volatility. Volatile markets = higher threshold. Quiet markets = lower threshold.
### 5. Trade Cooldown System
Prevents overtrading and revenge trading by enforcing a cooldown period between trades. Configurable from 1-24 bars.
### 6. Optional Session & Weekend Filters
Filter trades by Tokyo, London, and New York sessions. Optional weekend-off toggle to avoid low-liquidity periods.
---
## 🎯 How It Works
### Signal Generation
**STEP 1: Calculate Momentum**
- Momentum = Current Price - Price
- Check if Momentum > ATR × Threshold Multiplier
- Momentum must be accelerating (positive change in momentum)
**STEP 2: Confirm with EMA Trend Filter**
- Long: Price must be above EMA
- Short: Price must be below EMA
**STEP 3: Check Filters**
- Not in cooldown period
- Valid session (if enabled)
- Not weekend (if enabled)
**STEP 4: ENTRY SIGNAL TRIGGERED**
### Risk Management Example
**Example Long Trade:**
- Entry: $100
- Stop Loss: $97.80 (2.2% risk)
- Risk Amount: $2.20
**Take Profit Levels:**
- TP1: $104.40 (2R = $4.40) → Close 50%
- TP2: $105.50 (2.5R = $5.50) → Close 40%
- Final: $105.50 (2.5R) → Close remaining 10%
---
## ⚙️ Settings Guide
### Core Strategy
**Momentum Length** (Default: 13)
Number of bars for momentum calculation. Higher = stronger but fewer signals.
**Momentum Threshold** (Default: 2.25)
ATR multiplier. Higher = only trade biggest moves.
**Use EMA Trend Filter** (Default: ON)
Only long above EMA, short below EMA.
**EMA Length** (Default: 28)
Period for trend-confirming EMA.
### Filters
**Use Trading Session Filter** (Default: OFF)
Restrict trading to specific sessions.
**Tokyo Session** (Default: OFF)
Trade during Asian hours (00:00-09:00 JST).
**London Session** (Default: OFF)
Trade during European hours (08:00-17:00 GMT).
**New York Session** (Default: OFF)
Trade during US hours (08:00-17:00 EST).
**Weekend Off** (Default: OFF)
Disable trading on Saturdays and Sundays.
### Risk Management
**Stop Loss %** (Default: 2.2)
Fixed percentage stop loss from entry.
**Risk:Reward Ratio** (Default: 2.5)
Your target reward as multiple of risk.
**Use Partial Profit Taking** (Default: ON)
Take profits in stages.
**First TP R:R** (Default: 2.0)
First target as multiple of risk.
**First TP Size %** (Default: 50)
Percentage of position to close at TP1.
**Second TP R:R** (Default: 2.5)
Second target as multiple of risk.
**Second TP Size %** (Default: 40)
Percentage of position to close at TP2.
### Trade Management
**Use Trade Cooldown** (Default: ON)
Prevent overtrading.
**Cooldown Bars** (Default: 6)
Bars to wait after closing a trade.
---
## 🎨 Visual Elements
### Chart Indicators
🟢 **Green Dot** (below bar) = Long entry signal
🔴 **Red Dot** (above bar) = Short entry signal
🔵 **Blue X** (above bar) = Long position closed
🟠 **Orange X** (below bar) = Short position closed
**EMA Line** = Trend direction (green when bullish, red when bearish)
**White Line** = Entry price
**Red Line** = Stop loss level
**Green Lines** = Take profit levels (TP1, TP2, Final)
### Dashboard
When not in real-time mode, a dashboard displays:
- Current position (LONG/SHORT/FLAT)
- Entry price
- Stop loss price
- Take profit price
- R:R ratio
- Current momentum strength
- Total trades
- Win rate
- Net profit %
---
## 📈 Recommended Settings by Timeframe
### 1-Hour Timeframe (Default)
- Momentum Length: 13
- Momentum Threshold: 2.25
- EMA Length: 28
- Stop Loss: 2.2%
- R:R Ratio: 2.5
- Cooldown: 6 bars
### 4-Hour Timeframe
- Momentum Length: 24-36
- Momentum Threshold: 2.5
- EMA Length: 50
- Stop Loss: 3-4%
- R:R Ratio: 2.0-2.5
- Cooldown: 6-8 bars
### 15-Minute Timeframe
- Momentum Length: 8-10
- Momentum Threshold: 2.0
- EMA Length: 20
- Stop Loss: 1.5-2%
- R:R Ratio: 2.0
- Cooldown: 4-6 bars
---
## 🔧 Optimization Tips
### Want More Trades?
- Decrease Momentum Threshold (2.0 instead of 2.25)
- Decrease Momentum Length (10 instead of 13)
- Decrease Cooldown Bars (4 instead of 6)
### Want Higher Quality Trades?
- Increase Momentum Threshold (2.5-3.0)
- Increase Momentum Length (18-24)
- Increase Cooldown Bars (8-10)
### Want Lower Drawdown?
- Increase Cooldown Bars
- Use tighter stop loss
- Enable session filters (trade only high-liquidity sessions)
- Enable Weekend Off
### Want Higher Win Rate?
- Increase R:R Ratio (may reduce total profit)
- Increase Momentum Threshold (fewer but stronger signals)
- Use longer EMA for trend confirmation
---
## 📊 Performance Expectations
Based on typical backtesting results:
- **Win Rate**: 35-45%
- **Profit Factor**: 1.5-2.0
- **Risk:Reward**: 1:2.5 (configurable)
- **Max Drawdown**: 10-20%
- **Trades/Month**: 8-15 (1H timeframe)
**Note:** Win rate may appear low, but with 2.5:1 R:R, you only need ~29% win rate to break even. The strategy aims for quality over quantity.
---
## 🎓 Strategy Logic Explained
### Why Momentum > EMA Crossover?
**EMA Crossover Problems:**
- Signals lag behind price
- Late entries = poor R:R
- Many false signals in ranging markets
**Momentum Advantages:**
- Catches moves as they start accelerating
- Earlier entries = better R:R
- Adapts to volatility via ATR
### Why Partial Profit Taking?
**Without Partial TPs:**
- All-or-nothing approach
- Winners often turn to losers
- High stress watching open positions
**With Partial TPs:**
- Lock in 50% at first target
- Reduce risk to breakeven
- Let remainder ride for bigger gains
- Lower psychological pressure
### Why Trade Cooldown?
**Without Cooldown:**
- Revenge trading after losses
- Overtrading in choppy markets
- Emotional decision-making
**With Cooldown:**
- Forces discipline
- Waits for new setup to develop
- Reduces transaction costs
- Better signal quality
---
## ⚠️ Important Notes
1. **This is a momentum strategy, not an EMA strategy**
The EMA only confirms trend direction. Momentum generates the actual signals.
2. **Backtest thoroughly before live trading**
Past performance ≠ future results. Test on your specific asset and timeframe.
3. **Use proper position sizing**
Risk 1-2% of account per trade maximum. The strategy uses 100% equity by default (adjust in Properties).
4. **Dashboard auto-hides in real-time**
Clean chart for live trading. Visible during backtesting.
5. **Customize for your trading style**
All settings are fully adjustable. No single "best" configuration.
---
## 🚀 Quick Start Guide
1. **Add to Chart**: Apply to your preferred asset and timeframe
2. **Keep Defaults**: Start with default settings
3. **Backtest**: Review historical performance
4. **Paper Trade**: Test with simulated money first
5. **Go Live**: Start small and scale up
---
## 💡 Pro Tips
**Tip 1: Combine Timeframes**
Use higher timeframe (4H) for trend direction, lower timeframe (1H) for entries.
**Tip 2: Avoid News Events**
Major news can cause whipsaws. Consider manual intervention during high-impact events.
**Tip 3: Monitor Momentum Strength**
Dashboard shows momentum in sigma (σ). Values >1.0σ indicate very strong momentum.
**Tip 4: Adjust for Volatility**
In high-volatility markets, increase threshold and stop loss. In quiet markets, decrease them.
**Tip 5: Review Losing Trades**
Check if losses are hitting stop loss or reversing. Adjust stop accordingly.
---
## 📝 Changelog
**v1.0** - Initial Release
- Momentum-based signal generation
- EMA trend filter
- Programmable R:R ratio
- Partial profit taking (3 stages)
- Trade cooldown system
- Session filters (Tokyo/London/New York)
- Weekend off toggle
- Smart dashboard (auto-hides in real-time)
- Clean visual design
---
## 🙏 Credits
Developed by **Hash Capital Research**
If you find this strategy useful, please give it a like and share with others!
---
## ⚖️ Disclaimer
This strategy is for educational purposes only. Trading involves substantial risk of loss and is not suitable for all investors. Past performance is not indicative of future results. Always do your own research and consult with a qualified financial advisor before trading.
---
## 📬 Feedback
Have suggestions or found a bug? Leave a comment below! I'm continuously improving this strategy based on community feedback.
---
**Happy Trading! 🚀📈**

Tarih & Saat (Sol Alt - Orta Arası)Sometimes we may have some questions about the clock in our minds, if your PC clock or application clock gets a bug, this indicator is the source of the exact solution to this problem, enjoy it

Static Beta for Pair and Quant Trading A beta coefficient shows the volatility of an individual stock compared to the systematic risk of the entire market. Beta represents the slope of the line through a regression of data points. In finance, each point represents an individual stock's returns against the market.
Beta effectively describes the activity of a security's returns as it responds to swings in the market. It is used in the capital asset pricing model (CAPM), which describes the relationship between systematic risk and expected return for assets. CAPM is used to price risky securities and to estimate the expected returns of assets, considering the risk of those assets and the cost of capital.
Calculating Beta
A security's beta is calculated by dividing the product of the covariance of the security's returns and the market's returns by the variance of the market's returns over a specified period. The calculation helps investors understand whether a stock moves in the same direction as the rest of the market. It also provides insights into how volatile—or how risky—a stock is relative to the rest of the market.
For beta to provide useful insight, the market used as a benchmark should be related to the stock. For example, a bond ETF's beta with the S&P 500 as the benchmark would not be helpful to an investor because bonds and stocks are too dissimilar.
Beta Values
Beta equal to 1: A stock with a beta of 1.0 means its price activity correlates with the market. Adding a stock to a portfolio with a beta of 1.0 doesn’t add any risk to the portfolio, but it doesn’t increase the likelihood that the portfolio will provide an excess return.
Beta less than 1: A beta value less than 1.0 means the security is less volatile than the market. Including this stock in a portfolio makes it less risky than the same portfolio without the stock. Utility stocks often have low betas because they move more slowly than market averages.
Beta greater than 1: A beta greater than 1.0 indicates that the security's price is theoretically more volatile than the market. If a stock's beta is 1.2, it is assumed to be 20% more volatile than the market. Technology stocks tend to have higher betas than the market benchmark. Adding the stock to a portfolio will increase the portfolio’s risk, but may also increase its return.
Negative beta: A beta of -1.0 means that the stock is inversely correlated to the market benchmark on a 1:1 basis. Put options and inverse ETFs are designed to have negative betas. There are also a few industry groups, like gold miners, where a negative beta is common.
LET'S START
Now I'll give my own definition.
Beta:
If we assume market caps are equal ,
it is an indicator that shows how much of the second instrument we should buy if we buy one of the first, taking into account the price volatility of two instruments.
But if the market caps are not equal:
For example, the ETF for A is $300.
The ETF for B is $600.
If static beta predicted by this script is 0.5:
300 * 1 * a = 600 * 0.5 * b
Then we should use 1 b for 1 a.
(Long a and short b or vice versa )
So, we can try pair trading for a/b or a-b.
However, these values are generally close to each other, such as 0.8 and 0.93. However, the closer we can adjust our lot purchases to bring the double beta to a value closer to 1, the higher the hedge ratio will be.
Large commercials use dynamic betas, which are updated periodically, in addition to static betas
However, scaling this is very difficult for individual investors with limited investment tools.
But a static beta of 5,000 bars is still much better than not considering any beta at all.
Note: The presence of a beta value for two instruments does not necessarily mean they can be included in pair trading.
It is also important (%99) to consider historically very high correlations and cointegration relationships, as well as the compatibility of security structures.
Note 2 : This script is designed for low timeframes.
Do not use betas from different timeframes.
Beta dynamics are different for each timeframe.
Note 3 : I created this script with the help of ChatGPT.
Source for beta definition ( ) :
www.investopedia.com
Regards.

SuperMegaIndicator5000SuperMegaIndicator5000
key levels
ema
volume on price High Vol LowV and chop on price
London open close
vwap
orb
and maybe a couple other indicators

Montosca's Volume Delta Volume Delta Montosca - Indicator Summary
Volume Delta Montosca is a specialized Pine Script indicator for TradingView designed to analyze buying and selling pressure within each candle. It focuses on identifying high-impact volume events combined with strong directional dominance.
Key Features
1. Volume Delta Visualization
Displays volume bars split into Buy Volume (Blue) and Sell Volume (Red).
Includes centered text labels inside the bars showing the exact percentage of buy and sell volume for clear readability.
2. Signal Generation Logic (Triangles)
The indicator generates Buy (Blue Triangle) and Sell (Red Triangle) signals based on two strict criteria that must be met simultaneously:
Criterion A: Significant Volume (SMA Filter)
The current candle's volume must exceed a dynamic threshold.
This threshold is calculated using a Simple Moving Average (SMA) of the volume (e.g., 20 periods) multiplied by a user-defined Adjustment Factor (e.g., 150%).
Example: If the factor is 150%, the volume must be 1.5x higher than the average.
Criterion B: Directional Dominance
The candle must show strong internal conviction.
The Buy Percentage (for long signals) or Sell Percentage (for short signals) must exceed a specific Dominance Threshold (e.g., 70%).
3. Simplified Analysis
Alerts: Integrated alert conditions for both Buy and Sell signals for automated trading or notifications.

Volume Surge AlertVolume is often the fuel behind meaningful price moves. The Volume Surge Alert indicator highlights bars where volume explodes above its recent average, helping you spot accumulation, distribution, and breakout attempts before the price fully reacts.
Calculates a configurable simple moving average of volume to establish “normal” activity.
Flags bars where the current volume exceeds the SMA by a user-defined multiple (default 2×).
Colors the column and background on surge bars for quick visual confirmation.
Provides an alert condition so you can receive notifications the moment activity spikes.
Use it on any timeframe or market to monitor for unusual participation, confirm breakouts, or filter entries. Adjust the SMA length and surge multiple to match your market’s typical liquidity profile.

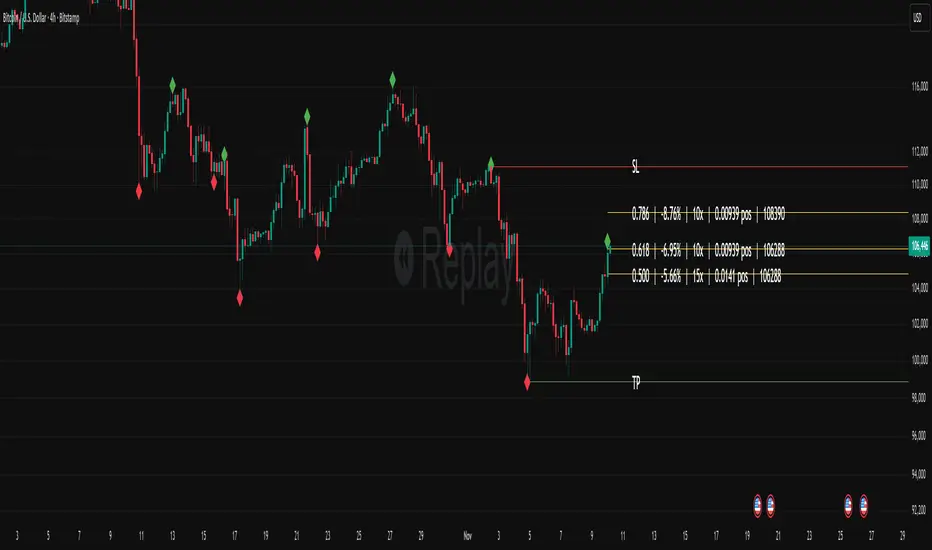
Fibonacci Set-upThe indicator plots Fibonacci retracements based on recent lows and highs.
Additionally it calculates position size, max leverage, max drawdown and pricelevels.
EQT Stochastic RibbonEQT Stochastic Ribbon is a modified Stochastic Oscillator with ribbon fill visualization.
Features:
- Dynamic color ribbon that changes based on trend direction (Blue for bullish, White for bearish)
- Crossover signals with triangle markers when %K crosses %D
- Customizable colors and signal offset
- Dashed lines at 80/20 levels for overbought/oversold zones
How to use:
- Blue ribbon = Bullish momentum (%K above %D)
- White ribbon = Bearish momentum (%K below %D)
- Triangle up = Buy signal (K crosses above D)
- Triangle down = Sell signal (K crosses below D)
Settings:
- K, D, Smooth - Standard Stochastic parameters
- Signal Offset - Distance of signal arrows from the line
- Bullish/Bearish Colors - Customize ribbon and signal colors

Breakouts & Pullbacks [Trendoscope®]🎲 Breakouts & Pullbacks - All-Time High Breakout Analyzer
Probability-Based Post-Breakout Behavior Statistics | Real-Time Pullback & Runup Tracker
A professional-grade Pine Script v6 indicator designed specifically for analyzing the historical and real-time behavior of price after strong All-Time High (ATH) breakouts. It automatically detects significant ATH breakouts (with configurable minimum gap), measures the depth and duration of pullbacks, the speed of recovery, and the subsequent run-up strength — then turns all this data into easy-to-read statistical probabilities and percentile ranks.
Perfect for swing traders, breakout traders, and anyone who wants objective, data-driven insight into questions like:
“How deep do pullbacks usually get after a strong ATH breakout?”
“How many bars does it typically take to recover the breakout level?”
“What is the median run-up after recovery?”
“Where is the current pullback or run-up relative to historical ones?”
🎲 Core Concept & Methodology
Indicator is more suitable for indices or index ETFs that generally trade in all-time highs however subjected to regular pullbacks, recovery and runups.
For every qualified ATH breakout, the script identifies 4 distinct phases:
Breakout Point – The exact bar where price closes above the previous ATH after at least Minimum Gap bars.
Pullback Phase – From breakout candle high → lowest low before price recovers back above the breakout level.
Recovery Phase – From the pullback low → the bar where price first trades back above the original breakout price.
Post-Recovery Run-up Phase – From the recovery point → current price (or highest high achieved so far).
Each completed cycle is stored permanently and used to build a growing statistical database unique to the loaded chart and timeframe.
🎲 Visual Elements
Yellow polyline triangle connecting Previous ATH / Pullback point(start), New ATH Breakout point (end), Recovery point (lowest pullback price), and extends to recent ATH price.
Small green label at the pullback low showing detailed tooltip on hover with all measured values
Clean, color-coded statistics table in the top-right corner (visible only on the last bar)
Powerful Statistics Table – The Heart of the Indicator
The table constantly compares the current situation against all past qualified breakouts and shows details about pullbacks, and runups that help us calculate the probability of next pullback, recovery or runup.
🎲 Settings & Inputs
Minimum Gap
The minimum number of bars that must pass between breaking a new ATH and the previous one.
Higher values = stricter filter → only the strongest, cleanest breakouts are counted.
Lower values = more data points (useful on lower timeframes or very trending instruments).
Recommendation:
Daily charts: 30–50
4H charts: 40–80
1H charts: 100–200
🎲 How to Use It in Practice
This indicator helps investors to understand when to be bullish, bearish or cautious and anticipate regular pullbacks, recovery of markets using quantitative methods.
The indicator does not generate buy/sell signals. However, helps traders set expectations and anticipate market movements based on past behavior.

Fat Tony's Composite Momentum Histogram (v01)# Fat Tony's Composite Momentum Histogram
## What It Does
This indicator combines four momentum oscillators into a single composite signal that ranges approximately from -100 to +100. It identifies potential overbought and oversold conditions while weighting signals by volume activity to filter out weak moves.
The histogram shows momentum strength with color-coded bars:
- **Red bars** indicate extreme overbought conditions (above +100)
- **Green bars** indicate extreme oversold conditions (below -100)
- **Blue bars** show positive momentum in normal range
- **Orange bars** show negative momentum in normal range
## Core Components
The indicator blends these four momentum measures:
1. **Williams %R** - Measures where price closed relative to the high-low range
2. **Stochastic %K** - Compares closing price to the recent price range
3. **MACD Histogram** - Shows momentum changes via moving average convergence/divergence
4. **ROC (Rate of Change)** - Measures percentage price change, normalized by volatility
Each component is scaled to a -50 to +50 range, then averaged together. The MACD component uses adaptive scaling based on its historical volatility to remain relevant across different market conditions.
## Volume Weighting
The indicator amplifies signals when volume is elevated and dampens them when volume is low. It uses a logarithmic scaling approach to smooth extreme volume spikes. There's also a minimum volume filter that prevents signals from triggering during very low-volume periods.
## Settings Explained
**Momentum Settings:**
- **Length (14)** - Lookback period for Williams %R and Stochastic calculations
- **MACD Fast/Slow/Signal (12/26/9)** - Standard MACD parameters
- **ROC Length (10)** - Lookback for rate of change calculation
- **MACD StDev Length (200)** - Historical window for normalizing MACD values
**Levels:**
- **Overbought Level (+100)** - Threshold for extreme upside momentum
- **Oversold Level (-100)** - Threshold for extreme downside momentum
**Volume Settings:**
- **Enable Volume Weighting** - Toggle volume amplification on/off
- **Volume Sensitivity (1.5)** - Controls how much volume impacts the signal (higher = stronger impact)
- **Min Avg Volume (50,000)** - Filters out signals when 5-bar average volume is too low
**Components:**
- **Include ROC Component** - Toggle to add/remove ROC from the calculation
- **Enable Trend Filter** - Only allows signals aligned with the 200-period EMA trend
- **Show Component Plots** - Displays individual oscillator values for tuning purposes
## Trading Signals
**Entry Signals:**
- **Long (green triangle)** - Composite crosses above the oversold level with adequate volume
- **Short (red triangle)** - Composite crosses below the overbought level with adequate volume
**Exit Signals (when trend filter enabled):**
- **Long Exit** - Composite crosses below zero from positive territory
- **Short Exit** - Composite crosses above zero from negative territory
The indicator also provides alert conditions for automated notifications on these signal events.

3 day look backThis script is designed to help traders visually compare daily liquidity behavior between two correlated assets — for example, the Nasdaq (NQ) and the S&P500 (ES).
It plots each day’s High and Low, aligned from Midnight to Midnight, with a clean session structure. This makes it easier to identify:
SMT (Smart Money Technique) divergences
liquidity grabs
daily highs/lows sweeps
relative strength/weakness between assets
intraday bias shifts based on daily structure
What the script does
Reconstructs each trading day from 00:00 to 00:00, regardless of session irregularities.
Plots the High and Low of every completed day.
Allows users to display as many past days as they want (custom “look-back” parameter).
Automatically merges the weekend with Friday for assets where Saturday/Sunday sessions are fragmented.
Includes a manual midnight offset (–12h to +12h) to fix timezone inconsistencies on TradingView charts (common on futures).
Optional real-time lines for the current day.
No excessive right-side extensions for clean intraday reading.
Why this is useful
When comparing paired assets (e.g., NQ vs ES), liquidity behavior is often different.
This script makes it easy to spot:
when one asset makes a new daily high while the other doesn’t
asymmetrical liquidity sweeps
SMT-based divergence setups
liquidity grabs at daily levels
intraday directional bias shifts
About the other indicators shown on the chart
In the example chart, two additional indicators are used only for clarity and structure:
Day of the Week — displays the weekday on each session for easier orientation.
Vertical Line Timeline — draws a clean separator line between days.
These indicators are not required for this High/Low script to work.
They simply help visually organize sessions and make daily structure easier to read when comparing two assets side by side.
How to use
Open two assets (e.g., NQ1! and ES1!) side by side.
Apply this script on both charts.
Set the same timeframe.
Choose how many days back you want to visualize (look-back parameter).
Observe how each asset interacts with its daily High/Low.
Look for SMT divergences and liquidity-based setups.
Main features
Midnight-to-Midnight alignment
Weekend fusion
Manual offset for perfect timing
Adjustable daily look-back
Clean daily liquidity
Optional dynamic daily levels
Ideal for SMT/liquidity-based intraday trading

Smart Margin Zone
SMART MARGIN ZONE - CME-BASED SUPPORT & RESISTANCE INDICATOR
TITLE FOR PUBLICATION:
Smart Margin Zone - CME Margin-Based Support and Resistance
CATEGORY:
Support and Resistance
SHORT DESCRIPTION (for preview):
Automatically plots margin zones based on CME Group requirements. These zones represent critical price levels where leveraged traders face margin calls, creating natural support and resistance through forced liquidations.
═══════════════════════════════════════════════════════════════
FULL DESCRIPTION FOR TRADINGVIEW:
═══════════════════════════════════════════════════════════════
📊 Smart Margin Zone - Professional Trading Zones Based on CME Data
This indicator automatically calculates and displays margin zones derived from official CME Group margin requirements. These zones represent critical price levels where traders using leverage receive margin calls, triggering forced position closures that create natural support and resistance levels.
═══════════════════════════════════════════════════════════════
🎯 CORE CONCEPT
═══════════════════════════════════════════════════════════════
When price reaches calculated margin zones, traders using 2:1 or 4:1 leverage on CME futures receive margin calls. Brokers automatically liquidate these positions, creating waves of buying or selling pressure that form strong support and resistance levels.
This is not theoretical - it's based on actual margin requirements from CME Group, the world's largest derivatives marketplace.
═══════════════════════════════════════════════════════════════
📐 CALCULATION METHODOLOGY
═══════════════════════════════════════════════════════════════
The indicator uses the following formula to calculate zone sizes:
Zone Size = (Margin Requirement / Tick Value) × Tick Size × 1.10
Where:
• Margin Requirement = Official CME initial margin (updated November 2024)
• Tick Value = Dollar value of minimum price movement
• Tick Size = Minimum price increment
• 1.10 = 10% buffer for realistic zone width
SUPPORTED INSTRUMENTS WITH CME DATA:
Currency Pairs:
• EURUSD: $2,100 margin → 0.0168 zone size
• GBPUSD: $1,800 margin → 0.0144 zone size
• AUDUSD: $1,300 margin → 0.0065 zone size
• NZDUSD: $1,100 margin → 0.0055 zone size
• USDJPY: $3,200 margin → custom calculation
• USDCAD: $950 margin → calculated
• USDCHF: $1,650 margin → calculated
Commodities:
• Gold (XAUUSD): $8,000 margin → 80 points zone size
• Silver (XAGUSD): $6,500 margin → calculated
• WTI Crude Oil: $4,500 margin → calculated
═══════════════════════════════════════════════════════════════
🔍 HOW IT WORKS
═══════════════════════════════════════════════════════════════
1. SWING POINT DETECTION
The indicator automatically identifies swing highs and swing lows using a configurable lookback period (default 10 bars). These become anchor points for zone calculations.
2. FIVE ZONE LEVELS
From each swing point, five zone levels are calculated:
• Zone 1/4 (25%) - First correction level
• Zone 1/2 (50%) - KEY ZONE for trend determination
• Zone 3/4 (75%) - Intermediate level
• Zone 1/1 (100%) - Full margin zone (strongest level)
• Zone 5/4 (125%) - Extended zone
3. TREND IDENTIFICATION
• Close above Zone 1/2 resistance = Bullish trend
• Close below Zone 1/2 support = Bearish trend
• Between zones = Range/consolidation
4. HISTORICAL CONTEXT
Current zones are displayed prominently with fills and labels. Historical zones appear as thin, semi-transparent lines for context without cluttering the chart.
═══════════════════════════════════════════════════════════════
⚙️ FEATURES
═══════════════════════════════════════════════════════════════
AUTOMATED CALCULATION:
✅ Auto-detection of swing highs and lows
✅ Real-time zone updates as new swings form
✅ CME margin data built-in for major instruments
✅ Manual override option for custom calculations
VISUAL CLARITY:
✅ Color-coded zones (red=resistance, green=support)
✅ Adjustable transparency for fills and lines
✅ Current zones bold with fills and price labels
✅ Historical zones thin and transparent
✅ Swing point markers show calculation origins
CUSTOMIZATION:
✅ Show/hide individual zone levels (1/4, 1/2, 3/4, 1/1, 5/4)
✅ Toggle historical zones on/off
✅ Adjustable lookback period (5-50 bars)
✅ Customizable colors for all elements
✅ Line width and transparency controls
✅ Zone extension options (none/right/both)
TREND ANALYSIS:
✅ Optional trend background coloring
✅ Customizable trend colors and transparency
✅ Real-time trend identification display
STATISTICS:
✅ Live statistics table showing:
- Current instrument
- Active zone size
- Calculation mode
- Current trend direction
- Number of zones displayed
ALERTS:
✅ Zone 1/2 breakout (up/down)
✅ Full margin zone 1/1 reached
✅ Customizable alert messages
═══════════════════════════════════════════════════════════════
📈 TRADING APPLICATIONS
═══════════════════════════════════════════════════════════════
ENTRY SIGNALS:
• Bounces from zone levels = potential entry points
• Zone 1/2 breakouts = trend continuation entries
• Zone rejections = reversal opportunities
RISK MANAGEMENT:
• Zone levels = logical stop-loss placement
• Zone 1/1 = maximum risk level
• Zone spacing = position sizing guide
PROFIT TARGETS:
• Next zone level = first target
• Zone 1/1 = full profit target
• Zone breakouts = extended targets
TREND CONFIRMATION:
• Price above Zone 1/2 resistance = confirmed uptrend
• Price below Zone 1/2 support = confirmed downtrend
• Consolidation between zones = wait for breakout
═══════════════════════════════════════════════════════════════
📚 USAGE INSTRUCTIONS
═══════════════════════════════════════════════════════════════
GETTING STARTED:
1. Add indicator to chart of any supported instrument
2. Zones automatically calculate and display
3. Adjust swing detection period if needed (default 10 works well)
4. Customize colors and visibility to your preference
OPTIMAL SETTINGS:
• Best timeframes: H1, H4, Daily, Weekly
• Default swing length (10) suitable for most markets
• Show 2-3 historical zones for context
• Enable swing point markers to see calculation origins
INTERPRETATION:
• Watch for price reactions at zone boundaries
• Strong bounces = respect for margin level
• Clean breaks = momentum continuation
• Multiple touches = zone strength confirmation
SET ALERTS:
• Zone 1/2 breakouts for trend entries
• Zone 1/1 reaches for profit-taking
• Custom alerts for your specific strategy
═══════════════════════════════════════════════════════════════
⚠️ IMPORTANT NOTES
═══════════════════════════════════════════════════════════════
DATA ACCURACY:
• CME margin requirements updated November 2024
• Margins change periodically - check CME Group website
• Manual mode available for latest margin data
• Indicator provides analysis tool, not financial advice
STATISTICAL PERFORMANCE:
• Historical data shows >60% probability of continued movement after Zone 1/2 breakout
• Zone effectiveness varies by market conditions
• Best results in trending markets with clear swings
LIMITATIONS:
• Margin requirements change - monitor CME updates
• Works best on liquid instruments with clear swings
• Not a standalone trading system
• Should be combined with additional analysis
═══════════════════════════════════════════════════════════════
🔧 METHODOLOGY CREDIT
═══════════════════════════════════════════════════════════════
This indicator is based on the margin zones concept developed by Alexander Bazylev (BTrade indicator for MetaTrader platforms).
The TradingView implementation has been completely rewritten with original enhancements:
• Multiple zone levels instead of single level
• Automatic swing point detection algorithm
• Direct CME data integration
• Historical zone visualization
• Advanced customization options
• Comprehensive statistics and alerts
All code is original and specifically designed for TradingView's Pine Script v5 environment.
═══════════════════════════════════════════════════════════════
💡 BEST PRACTICES
═══════════════════════════════════════════════════════════════
COMBINE WITH:
• Volume analysis for confirmation
• Trend indicators for direction bias
• Price action patterns at zones
• Higher timeframe analysis
AVOID:
• Trading against strong trends at minor zones
• Over-leveraging based solely on zone placement
• Ignoring broader market context
• Expecting perfect bounces every time
OPTIMIZE:
• Adjust swing length for different timeframes
• Shorter period (5-7) for intraday trading
• Longer period (15-20) for swing trading
• Test historical effectiveness on your instruments
═══════════════════════════════════════════════════════════════
📖 EDUCATIONAL VALUE
═══════════════════════════════════════════════════════════════
This indicator helps traders understand:
• How institutional margin requirements affect price
• Where forced liquidations create pressure
• Natural support and resistance formation
• Relationship between leverage and price levels
• Market structure and key technical levels
═══════════════════════════════════════════════════════════════
🔄 VERSION HISTORY
═══════════════════════════════════════════════════════════════
Version 1.0 (Initial Release):
• CME-based zone calculation for 10 instruments
• Automatic swing high/low detection
• 5 zone levels with customizable display
• Historical zones with transparency control
• Swing point markers
• Trend background indicator
• Live statistics table
• Multiple alert conditions
• Fully customizable colors and styles
• English language interface
═══════════════════════════════════════════════════════════════
📞 SUPPORT & FEEDBACK
═══════════════════════════════════════════════════════════════
Questions or suggestions? Leave a comment below!
If you find this indicator useful:
⭐ Please leave a like
💬 Share your experience in comments
🔔 Follow for updates and new indicators
═══════════════════════════════════════════════════════════════
⚖️ DISCLAIMER
═══════════════════════════════════════════════════════════════
This indicator is provided for educational and analytical purposes only. It is not financial advice and should not be the sole basis for trading decisions.
• Past performance does not guarantee future results
• Trading involves substantial risk of loss
• CME margin requirements subject to change
• Always do your own research and risk management
• Consult a financial advisor for investment advice
The creator is not responsible for any trading losses incurred through use of this indicator.

The Operator Schedule (Daily/Repeating) - Time-Based AlertsKKRESULT PLAYBOOK SUCCES FORMULA
DAILY ROUTINE — THE OPERATOR SCHEDULE
• 5 AM wake-up. (5-6hrs)
• Pre-workout meal.
• Boxing or conditioning.
• Fuel + hydration.
• Morning silence.
• Chart prep.
• Trade 9:30 AM – 3 PM.
• Journal.
• Shutdown routine to reset. A consistent routine builds a consistent trader.
• Edit YouTube Video
• 12 PM Fuel + hydration

SwiftTrend█ OVERVIEW
SwiftTrend is a trend-following indicator inspired by the classic SuperTrend, but built on a completely different calculation method — using the average candle body size and the body midpoint (bodyMid). It reacts very dynamically to changes in momentum strength. The indicator is clean, easy to read, and perfect for traders who want fast yet confirmed trend direction. By adjusting the settings, you can make signals extremely sensitive or, conversely, reduce their frequency to almost completely eliminate trend flips on minor price moves.
█ CONCEPT
The indicator was created to strike the perfect balance between signal speed and effective noise filtering.
Instead of using classic ATR and price extremes (high/low), SwiftTrend uses the average candle body size and the midpoint of the previous candle’s body as its core reference. The dynamic trend line (avgLine) is protected by a tolerance zone – the trend only changes after price closes beyond this zone. This approach delivers significantly faster reaction times than many traditional solutions while maintaining excellent resistance to false signals during ranging markets.
█ FEATURES
Data source:
- Average candle body size: SMA(|open – close|, period)
- Reference point: midpoint of the previous candle’s body (bodyMid )
Dynamic trend line (avgLine):
- Built using Band Multiplier
- The line is “attracted” toward price movement
Tolerance zone (margin):
- Tolerance = Tolerance Multiplier × avgBody
- Default: 2.5 (for both band and tolerance)
Trend change logic:
- Down → Up: close > avgLine + tolerance
- Up → Down: close < avgLine – tolerance
Visual signals:
- “Buy” label (green upward arrow) and “Sell” label (red downward arrow) only on confirmed trend change
- Optional soft gradient fill between trend line and price
- Optional bar coloring based on current trend
- Trend line with breaks at reversal points
Alerts:
- Buy alert – triggers only when the closing price crosses from below to above the marginLineBase
- Sell alert – triggers only when the closing price crosses from above to below the marginLineBase
█ HOW TO USE
Add to chart → paste the code in Pine Editor or search for “SwiftTrend”.
Main settings:
- Average Body Periods → default 100
- Band Multiplier → default 2.5
- Tolerance Multiplier → default 2.5 (key sensitivity parameter)
- Colors, fill, and bar coloring – fully customizable
Interpretation:
- Green line & shading = uptrend
- Red line & shading = downtrend
- Higher Tolerance Multiplier = fewer but higher-quality signals
- Tolerance Multiplier near 0 = ultra-fast signals (aggressive mode)
█ APPLICATIONS
Excellent for:
- Trend-following (enter with trend, exit on reversal)
- Breakout and momentum strategies
- Filtering consolidation and noise – thanks to the adjustable tolerance zone
Best combined with:
- Classic support/resistance levels
- Fibonacci retracements, Pivot Points, psychological round numbers
- Confirmation from oscillators (RSI, Stochastic, MACD)
- Volume or volume profile analysis
Style adaptation:
- Scalping / daytrading → lower Tolerance Multiplier (0.8–1.8) + shorter period
- Swing / position trading → higher values (2.5–5.0) + longer period
█ NOTES
- Works on all markets and timeframes
- Success depends on matching the Tolerance Multiplier to your strategy and the instrument’s volatility
- Higher multiplier & period values = fewer signals, significantly higher quality
- At Tolerance Multiplier = 0 the indicator becomes extremely responsive – perfect for aggressive momentum trading
