Enhanced OB Retest Strategy v7.0The OB Retest Strategy is a full Order Block retest trading system that detects, plots, and trades OB zones across multiple timeframes. It uses structure breaks, retrace depth, and ATR filters to identify strong reversal or continuation setups.
⸻
⚙️ Core Features
• Multi-timeframe OB detection using break-of-structure (BOS) logic
• Automatic zone creation for bullish and bearish order blocks
• Smart merging of overlapping OB zones
• Dynamic flip-zone logic that turns invalidated OBs into new zones
• Wick zone detection for high-precision entries
• ATR-based trailing stop and optional breakeven
• Adjustable retrace depth, breakout %, and ATR filters
• Built-in performance table showing PnL, win rate, and total trades
• Fully backtestable with date range and commission control
⸻
🧠 Logic Summary
1. Detects a BOS on the higher timeframe.
2. Identifies the last opposing candle as the valid OB.
3. Validates the OB based on ATR size and breakout strength.
4. Waits for price to retest the zone to a set depth.
5. Executes trades and manages exits using trailing stop or breakeven.
6. Flips invalidated zones automatically.
⸻
💡 Usage Tips
• Best used on 1H to 4H charts for swing setups.
• Tune ATR and breakout thresholds for your market’s volatility.
• Combine with higher-timeframe bias or liquidity levels for better accuracy.
⸻
⚠️ Notes
• For educational and testing purposes only.
• Backtested results do not predict future performance.
• Always test before live use.
Indicadores e estratégias

Adaptive Trend 1m ### Overview
The "Adaptive Trend Impulse Parallel SL/TP 1m Realistic" strategy is a sophisticated trading system designed specifically for high-volatility markets like cryptocurrencies on 1-minute timeframes. It combines trend-following with momentum filters and adaptive parameters to dynamically adjust to market conditions, ensuring more reliable entries and risk management. This strategy uses SuperTrend for primary trend detection, enhanced by MACD, RSI, Bollinger Bands, and optional volume spikes. It incorporates parallel stop-loss (SL) and multiple take-profit (TP) levels based on ATR, with options for breakeven and trailing stops after the first TP. Optimized for realistic backtesting on short timeframes, it avoids over-optimization by adapting indicators to market speed and efficiency.
### Principles of Operation
The strategy operates on the principle of adaptive impulse trading, where entry signals are generated only when multiple conditions align to confirm a strong trend reversal or continuation:
1. **Trend Detection (SuperTrend)**: The core signal comes from an adaptive SuperTrend indicator. It calculates upper and lower bands using ATR (Average True Range) with dynamic periods and multipliers. A buy signal occurs when the price crosses above the lower band (from a downtrend), and a sell signal when it crosses below the upper band (from an uptrend). Adaptation is based on Rate of Change (ROC) to measure market speed, shortening periods in fast markets for quicker responses.
2. **Momentum and Trend Filters**:
- **MACD**: Uses adaptive fast and slow lengths. In "Trend Filter" mode (default when "Use MACD Cross" is false), it checks if the MACD line is above/below the signal for long/short. In cross mode, it requires a crossover/crossunder.
- **RSI**: Adaptive period RSI must be above 50 for longs and below 50 for shorts, confirming overbought/oversold conditions dynamically.
- **Bollinger Bands (BB)**: Depending on the mode ("Midline" by default), it requires the price to be above/below the BB midline for longs/shorts, or a breakout in "Breakout" mode. Deviation adapts to market efficiency.
- **Volume Spike Filter** (optional): Entries require volume to exceed an adaptive multiple of its SMA, signaling strong impulse.
3. **Volatility Filter**: Entries are only allowed if current ATR percentage exceeds a historical minimum (adaptive), preventing trades in low-volatility ranges.
4. **Risk Management (Parallel SL/TP)**:
- **Stop-Loss**: Set at an adaptive ATR multiple below/above entry for long/short.
- **Take-Profits**: Three levels at adaptive ATR multiples, with partial position closures (e.g., 51% at TP1, 25% at TP2, remainder at TP3).
- **Post-TP1 Features**: Optional breakeven moves SL to entry after TP1. Trailing SL uses BB midline as a dynamic trail.
- All levels are calculated per trade using the ATR at entry, making them "realistic" for 1m charts by widening SL and tightening initial TPs.
The strategy enters long on buy signals with all filters met, and short on sell signals. It uses pyramid margin (100% long/short) for full position sizing.
Adaptation is driven by:
- **Market Speed (normSpeed)**: Based on ROC, tightens multipliers in volatile periods.
- **Efficiency Ratio (ER)**: Measures trend strength, adjusting periods for trending vs. ranging markets.
This ensures the strategy "adapts" without manual tweaks, reducing false signals in varying conditions.
### Main Advantages
- **Adaptability**: Unlike static strategies, parameters dynamically adjust to market volatility and trend strength, improving performance across ranging and trending phases without over-optimization.
- **Realistic Risk Management for 1m**: Wider SL and tiered TPs prevent premature stops in noisy short-term charts, while partial profits lock in gains early. Breakeven/trailing options protect profits in extended moves.
- **Multi-Filter Confirmation**: Combines trend, momentum, and volume for high-probability entries, reducing whipsaws. The volatility filter avoids flat markets.
- **Debug Visualization**: Built-in plots for signals, levels, and component checks (when "Show Debug" is enabled) help users verify logic on charts.
- **Efficiency**: Low computational load, suitable for real-time trading on TradingView with alerts.
Backtesting shows robust results on volatile assets, with a focus on sustainable risk (e.g., SL at 3x ATR avoids excessive drawdowns).
### Uniqueness
What sets this strategy apart is its **fully adaptive framework** integrating multiple indicators with real-time market metrics (ROC for speed, ER for efficiency). Most trend strategies use fixed parameters, leading to poor adaptation; here, every key input (periods, multipliers, deviations) scales dynamically within bounds, creating a "self-tuning" system. The "parallel SL/TP with 1m realism" adds custom handling for micro-timeframes: tightened initial TPs for quick wins and adaptive min-ATR filter to skip low-vol bars. Unlike generic mashups, it justifies the combination—SuperTrend for trend, MACD/RSI/BB for impulse confirmation, volume for conviction—working synergistically to capture "trend impulses" while filtering noise. The post-TP1 breakeven/trailing tied to BB adds a unique profit-locking mechanism not common in open-source scripts.
### Recommended Settings
These settings are optimized and recommended for trading ASTER/USDT on Bybit, with 1-minute chart, x10 leverage, and cross margin mode. They provide a balanced risk-reward for this volatile pair:
- **Base Inputs**:
- Base ATR Period: 10
- Base SuperTrend ATR Multiplier: 2.5
- Base MACD Fast: 8
- Base MACD Slow: 17
- Base MACD Signal: 6
- Base RSI Period: 9
- Base Bollinger Period: 12
- Bollinger Deviation: 1.8
- Base Volume SMA Period: 19
- Base Volume Spike Multiplier: 1.8
- Adaptation Window: 54
- ROC Length: 10
- **TP/SL Settings**:
- Use Stop Loss: True
- Base SL Multiplier (ATR): 3
- Use Take Profits: True
- Base TP1 Multiplier (ATR): 5.5
- Base TP2 Multiplier (ATR): 10.5
- Base TP3 Multiplier (ATR): 19
- TP1 % Position: 51
- TP2 % Position: 25
- Breakeven after TP1: False
- Trailing SL after TP1: False
- Base Min ATR Filter: 0.001
- Use Volume Spike Filter: True
- BB Condition: Midline
- Use MACD Cross (false=Trend Filter): True
- Show Debug: True
For backtesting, use initial capital of 30 USD, base currency USDT, order size 100 USDT, pyramiding 1, commission 0.1%, slippage 0 ticks, long/short margin 0%.
Always backtest on your platform and use risk management—risk no more than 1-2% per trade. This is not financial advice; trade at your own risk.

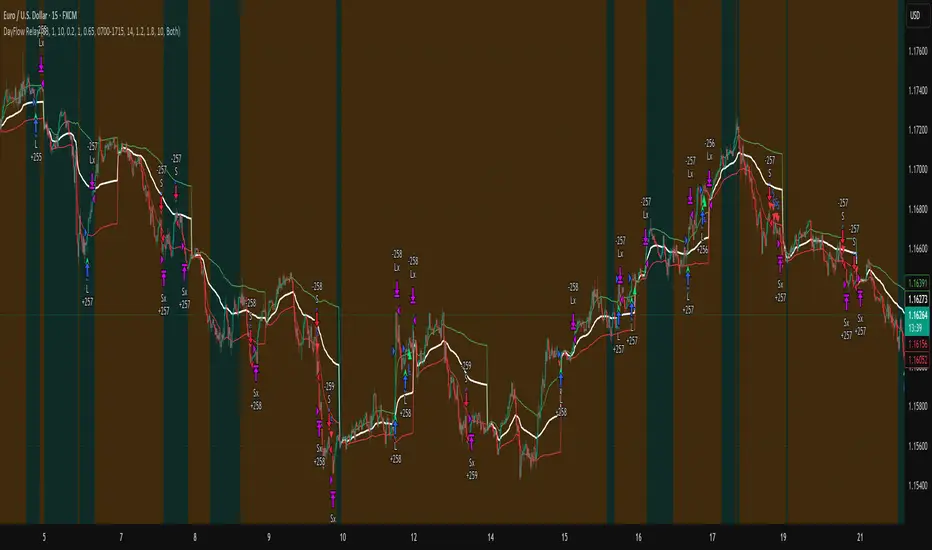
DayFlow VWAP Relay Forex Majors StrategySummary in one paragraph
DayFlow VWAP Relay is a day-trading strategy for major FX pairs on intraday timeframes, demonstrated on EURUSD 15 minutes. It waits for alignment between a daily anchored VWAP regime check, residual percentiles, and lower-timeframe micro flow before suggesting trades. The originality is the fusion of daily VWAP residual percentiles with a live micro-flow score from 1 minute data to switch between fade and breakout behavior inside the same session. Add it to a clean chart and use the markers and alerts.
Scope and intent
• Markets: Major FX pairs such as EURUSD, GBPUSD, USDJPY, AUDUSD, USDCHF, USDCAD
• Timeframes: One minute to one hour
• Default demo in this publication: EURUSD on 15 minutes
• Purpose: Reduce false starts by acting only when context, location and micro flow agree
• Limits: This is a strategy. Orders are simulated on standard candles only
Originality and usefulness
• Core novelty: Residual percentiles to daily anchored VWAP decide “balanced versus expanding day”. A separate 1 minute micro-flow score confirms direction, so the same model fades extremes in balance and rides range breaks in expansion
• Failure modes addressed: Chop fakeouts and unconfirmed breakouts are filtered by the expansion gate and micro-flow threshold
• Testability: Every input is exposed. Bands, background regime color, and markers show why a suggestion appears
• Portable yardstick: Stops and targets are ATR multiples converted to ticks, which transfer across symbols
• Open source status: No reused third-party code that requires attribution
Method overview in plain language
The day is anchored with a VWAP that updates from the daily session start. Price minus VWAP is the residual. Percentiles of that residual measured over a rolling window define location extremes for the current day. A regime score compares residual volatility to price volatility. When expansion is low, the day is treated as balanced and the model fades residual extremes if 1 minute micro flow points back to VWAP. When expansion is high, the model trades breakouts outside the VWAP bands if slope and micro flow agree with the move.
Base measures
• Range basis: True Range smoothed by ATR for stops and targets, length 14
• Return basis: Not required for signals; residuals are absolute price distance to VWAP
Components
• Daily Anchor VWAP Bands. VWAP with standard-deviation bands. Slope sign is used for trend confirmation on breakouts
• Residual Percentiles. Rolling percentiles of close minus VWAP over Signal length. Identify location extremes inside the day
• Expansion Ratio. Standard deviation of residuals divided by standard deviation of price over Signal length. Classifies balanced versus expanding day
• Micro Flow. Net up minus down closes from 1 minute data across a short span, normalized to −1..+1. Confirms direction and avoids fades against pressure
• Session Window optional. Restricts trading to your configured hours to avoid thin periods
• Cooldown optional. Bars to wait after a position closes to prevent immediate re-entry
Fusion rule
Gating rather than weighting. First choose regime by Expansion Ratio versus the Expansion gate. Inside each regime all listed conditions must be true: location test plus micro-flow threshold plus session window plus cooldown. Breakouts also require VWAP slope alignment.
Signal rule
• Long suggestion on balanced day: residual at or below the lower percentile and micro flow positive above the gate while inside session and cooldown is satisfied
• Short suggestion on balanced day: residual at or above the upper percentile and micro flow negative below the gate while inside session and cooldown is satisfied
• Long suggestion on expanding day: close above the upper VWAP band, VWAP slope positive, micro flow positive, session and cooldown satisfied
• Short suggestion on expanding day: close below the lower VWAP band, VWAP slope negative, micro flow negative, session and cooldown satisfied
• Positions flip on opposite suggestions or exit by brackets
What you will see on the chart
• Markers on suggestion bars: L for long, S for short
• Exit occurs on reverse signal or when a bracket order is filled
• Reference lines: daily anchored VWAP with upper and lower bands
• Optional background: teal for balanced day, orange for expanding day
Inputs with guidance
Setup
• Signal length. Residual and regime window. Typical 40 to 100. Higher smooths, lower reacts faster
Micro Flow
• Micro TF. Lower timeframe used for micro flow, default 1 minute
• Micro span bars. Count of lower-TF bars. Typical 5 to 20
• Micro flow gate 0..1. Minimum absolute flow. Raising it demands stronger confirmation and reduces trade count
VWAP Bands
• VWAP stdev multiplier. Band width. Typical 0.8 to 1.6. Wider bands reduce breakout frequency and increase fade distance
• Expansion gate 0..3. Threshold to switch from fades to breakouts. Raising it favors fades, lowering it favors breakouts
Sessions
• Use session filter. Enable to trade only inside your window
• Trade window UTC. Default 07:00 to 17:00
Risk
• ATR length. Stop and target basis. Typical 10 to 21
• Stop ATR x. Initial stop distance in ATR multiples
• Target ATR x. Profit target distance in ATR multiples
• Cooldown bars after close. Wait bars before a new entry
• Side. Both, long only, or short only
View
• Show VWAP and bands
• Color bars by residual regime
Properties visible in this publication
• Initial capital 10000
• Base currency Default
• request.security uses lookahead off everywhere
• Strategy: Percent of equity with value 3. Pyramiding 0. Commission cash per order 0.0001 USD. Slippage 3 ticks. Process orders on close ON. Bar magnifier ON. Recalculate after order is filled OFF. Calc on every tick OFF. Using standard OHLC fills ON.
Realism and responsible publication
No performance claims. Past results never guarantee future outcomes. Fills and slippage vary by venue. Shapes can move while a bar forms and settle on close. Strategies must run on standard candles for signals and orders.
Honest limitations and failure modes
High impact news, session opens, and thin liquidity can invalidate assumptions. Very quiet days can reduce contrast between residuals and price volatility. Session windows use the chart exchange time. If both stop and target are touched within a single bar, TradingView’s standard OHLC price-movement model decides the outcome.
Expect different behavior on illiquid pairs or during holidays. The model is sensitive to session definitions and feed time. Past results never guarantee future outcomes.
Legal
Education and research only. Not investment advice. You are responsible for your decisions. Test on historical data and in simulation before any live use. Use realistic costs.
Multi-Module Full-Featured Trading Strategy System v1🧠 Key Features Summary:
🧩 Full Modular Structure: Entry / Position Adding / Take Profit & Stop Loss / Delay / Capital Management.
⏱️ Delay & Reverse System: Prevents frequent long-short switching with minute-based delay intervals.
💰 Capital Management System:
• Controls opening/adding positions based on account equity percentage;
• Limits maximum position ratio;
• Supports leverage multiplier.
⚙️ Each module is independently configurable and can be disabled;
📈 Unified variable naming for easy expansion with more indicators.

Granny Strategy [rdjxyz]This is the Granny Strategy, as described on TG Capital's Sunday Service stream .
Definitions
C0 - Candle 0 - the candle where the FVG start is plotted
C1 - Candle 1 - the candle that drives the FVG
C2 - Candle 2 - the candle where the FVG end is plotted
C3 - Candle 3 - the entry candle (assuming all criteria are met)
👵🏻 - Valid setup
🤡 - Invalid setup
The Setup
*As described on the stream.
*Look for longs when price is above 50 EMA; look for shorts when price is below the 50 EMA.
FVG is printed
C2 sweeps the low of C1 and closes bullish (for longs) or sweeps the high of C1 and closes bearish (for shorts)
C3 inverts FVG and closes below C1 open (for longs) or above C1 open (for shorts)
If criteria above is met, position is entered on the close of C3 with stop loss at the low of C3 (for longs) or high of C3 (for shorts)
Inputs
Time Window Filter - only look for setups within a certain range of time
EMA length - original strategy calls for 50
Stop loss offset - ticks to offset stop loss from low (for longs) / high (for shorts) of C3
Risk:Reward ratio - take profit as a multiple of the stop loss size from entry
Break even stop loss - optional, move stop loss to break even after price reaches a specific R:R; e.g. once price hits 1:1 R:R, move stop loss to break even
Exception Inputs
Allow some exceptions to the rigid rules
Select which candle in the sequence the EMA filter is applied to (can produce different results)
Disable EMA bias filter (will find shorts when price is above EMA and longs when price is below)
Allow C3 to close inside of FVG (instead of completely inverting it)
Allow C3 to close above C1 open (for longs) or below C1 open (for shorts)
Allow C2 to close opposite of setup direction; e.g. if long, C2 is allowed to close as a bearish candle instead of bullish candle
Play around with the different settings on various timeframes and instruments to find rules that work best for your strategy goals. Or just use it to find valid vs. invalid setups historically.
Will be working on adding a trailing stop loss.
Leave a comment with any bugs or ideas you have to improve the strategy.
IMPORTANT
Adjust account size, position size, commissions, etc in the properties tab for accurate results!

EVWMA VWAP MACD Strategy - HTF Trigger with SL & EMA ExitEVWMA VWAP MACD Strategy - HTF Trigger with SL & EMA Exit

EVWMA VWAP MACD Strategy - HTF Trigger with SL & EMA ExitRENEW TRY IT EVWMA VWAP MACD Strategy - HTF Trigger with SL & EMA Exit
VWAP Retest + EMA9 Cross + Candle Pattern V2📈 VWAP Retest + EMA9 Cross + Candle Pattern Strategy_V2
Setup: This intraday momentum strategy combines 3 core elements:
• VWAP Retest: Price retests VWAP within a small buffer zone
• EMA9 Crossover: EMA9 crosses above VWAP within the last 3 bars
• Bullish Candle Pattern: At least one bullish signal — Hammer, Engulfing, or Momentum candle
A trade is triggered only during the US morning session (9:30–12:30 EST) and only if price is above yesterday’s high, suggesting strong momentum.
⚙️ Strategy Settings
• Initial Capital: $100,000
• Position Sizing: 10% of equity per trade
• Commission: 0.03% per trade
• Slippage: 1 tick
• Take Profit: +3% from entry
• Stop Loss: 0.5% below VWAP at entry
• Forced Exit: 1:00 PM EST
📊 Strategy Logic
• VWAP Retest Filter ensures entry is near a value zone.
• EMA9 Cross Confirmation aligns short-term momentum with volume-weighted price.
• Bullish Candle Patterns provide price action confirmation:
○ ✅ Hammer
○ ✅ Bullish Engulfing
○ ✅ Large momentum body
• Above Yesterday’s High (YH) acts as a bullish bias filter.
🧪 Backtest Results (Jan 2023 – Oct 2025)
• Total Trades: 120
• Win Rate: 52.5%
• Profit Factor: 1.18
• Max Drawdown: 1.22%
• Net P&L: +$1,064 (+1.06%)
Due to chart data limits, only part of the period may be visible on publication charts.
🔍 Chart Visuals
This strategy plots:
• VWAP (white) and EMA9 (orange)
• Candle pattern markers:
○ “H” = Hammer
○ “BE” = Bullish Engulfing
○ “M” = Momentum Candle
• “SETUP” label when all conditions are met
• YH/YL labels for context — previous day’s high/low
💡 Use Case
This setup is designed for intraday momentum scalping, ideal for traders who:
• Trade morning breakouts
• Use VWAP as a dynamic support/resistance
• Want clear, rule-based entries based on both trend and price action
Educational and research use - not financial advice.

ChadAnt- Ray to 2nd Fractal Time buy/sell strategyUsing Williams Fractals and adding rays that extend to the second fractal after a high/low looking for an entry

saodisengxiaoyu-lianghua-2.1- This indicator is a modular, signal-building framework designed to generate long and short signals by combining a chosen leading indicator with selectable confirmation filters. It runs on Pine Script version 5, overlays directly on price, and is built to be highly configurable so traders can tailor the signal logic to their market, timeframe, and trading style. It includes a dashboard to visualize which conditions are active and whether they validate a signal, and it outputs clear buy/sell labels and alert conditions so you can automate or monitor trades with confidence.
Core Design
- Leading Indicator: You choose one primary signal generator from a broad list (for example, Range Filter, Supertrend, MACD, RSI, Ichimoku, and many others). This serves as the anchor of the system and determines when a preliminary long or short setup exists.
- Confirmation Filters: You can enable additional filters that validate the leading signal before it becomes actionable. Each “respect…” input toggles a filter on or off. These filters include popular tools like EMA, 2/3 EMA crosses, RQK (Nadaraya Watson), ADX/DMI, Bollinger-based oscillators, MACD variations, QQE, Hull, VWAP, Choppiness Index, Damiani Volatility, and more.
- Signal Expiry: To avoid waiting indefinitely for confirmations, the indicator counts how many consecutive bars the leading condition holds. If confirmations do not align within a defined number of bars, the setup expires. This controls latency and helps reduce late or stale entries.
- Alternating Signals: An optional mode enforces alternation (long must follow short and vice versa), helping avoid repeated entries in the same direction without a meaningful reset.
- Aggregation Logic: The final long/short conditions are formed by combining the leading condition with all selected confirmation filters through logical conjunction. Only if all enabled filters validate the signal (within expiry constraints) does the indicator consider it a confirmed long or short.
- Visualization and Alerts: The script plots buy/sell labels at signal points, provides alert conditions for automation, and displays a compact dashboard summarizing the leading indicator’s status and each confirmation’s pass/fail result using checkmarks.
Leading Indicator Options
- The indicator includes a very large menu of leading tools, each with its own logic to determine uptrend or downtrend impulses. Highlights include:
- Range Filter: Uses a dynamic centerline and bands computed via conditional EMA/SMA and range sizing to define directional movement. It can operate in a default mode or an alternative “DW” mode.
- Rational Quadratic Kernel (RQK): Applies a kernel smoothing model (Nadaraya Watson) to detect uptrends and downtrends with a focus on noise reduction.
- Supertrend, Half Trend, SSL Channel: Classic trend-following tools that derive direction from ATR-based bands or moving average channels.
- Ichimoku Cloud and SuperIchi: Multi-component systems validating trend via cloud position, conversion/base line relationships, projected cloud, and lagging span.
- TSI (True Strength Index), DPO (Detrended Price Oscillator), AO (Awesome Oscillator), MACD, STC (Schaff Trend Cycle), QQE Mod: Momentum and cycle tools that parse direction from crossovers, zero-line behavior, and momentum shifts.
- Donchian Trend Ribbon, Chandelier Exit: Trend and exit tools that can validate breakouts or sustained trend strength.
- ADX/DMI: Measures trend strength and directional movement via +DI/-DI relationships and minimum ADX thresholds.
- RSI and Stochastic: Use crossovers, level exits, or threshold filters to gate entries based on overbought/oversold dynamics or relative strength trends.
- Vortex, Chaikin Money Flow, VWAP, Bull Bear Power, ROC, Wolfpack Id, Hull Suite: A diverse set of directional, momentum, and volume-based indicators to suit different markets and styles.
- Trendline Breakout and Range Detector: Price-behavior filters that confirm signals during breakouts or within defined ranges.
Confirmation Filters
- Each filter is optional. When enabled, it must validate the leading condition for a signal to pass. Examples:
- EMA Filter: Requires price to be above a specified EMA for longs and below for shorts, filtering signals that contradict broader trend or baseline levels.
- 2 EMA Cross and 3 EMA Cross: Enforce moving average cross conditions (fast above slow for long, the reverse for short) or a three-line stacking logic for more stringent trend alignment.
- RQK, Supertrend, Half Trend, Donchian, QQE, Hull, MACD (crossover vs. zero-line), AO (zero line or AC momentum variants), SSL: Each adds its characteristic validation pattern.
- RSI family (MA cross, exits OB/OS zones, threshold levels) plus RSI MA direction and RSI/RSI MA limits: Multiple ways to constrain signals via relative strength behavior and trajectories.
- Choppiness Index and Damiani Volatility: Prevent entries during ranging conditions or insufficient volatility; choppiness thresholds and volatility states gate the trade.
- VWAP, Volume modes (above MA, simple up/down, delta), Chaikin Money Flow: Volume and flow conditions that ensure signals happen in supportive liquidity or accumulation/distribution contexts.
- ADX/DMI thresholds: Demand a minimum trend strength and directional DI alignment to reduce whipsaw trades.
- Trendline Breakout and Range Detector: Confirm that the price is breaking structure or remains within active range consistent with the leading setup.
- By combining several filters you can create strict, conservative entries or looser setups depending on your goals.
Range Filter Engine
- A core building block, the Range Filter uses conditional EMA and SMA functions to compute adaptive bands around a dynamic centerline. It supports two types:
- Type 1: The centerline updates when price exceeds the band thresholds; bands define acceptable drift ranges.
- Type 2: Uses quantized steps (via floor operations) relative to the previous centerline to handle larger moves in discrete increments.
- The engine offers smoothing for range values using a secondary EMA and can switch between raw and averaged outputs. Its hi/lo bands and centerline compose a corridor that defines directional movement and potential breakout confirmation.
Signal Construction
- The script computes:
- leadinglongcond and leadingshortcond : The primary directional signals from the chosen leading indicator.
- longCond and shortCond : Final signals formed by combining the leading conditions with all enabled confirmations. Each confirmation contributes a boolean gate. If a filter is disabled, it contributes a neutral pass-through, keeping the logic intact without enforcing that condition.
- Expiry Logic: The code counts consecutive bars where the leading condition remains true. If confirmations do not line up within the user-defined “Signal Expiry Candle Count,” the setup is abandoned and the signal does not trigger.
- Alternation: An optional state ensures that long and short signals alternate. This can reduce repeated entries in the same direction without a clear reset.
- Finally, longCondition and shortCondition represent the actionable signals after expiry and alternation logic. These drive the label plotting and alert conditions.
Visualization
- Buy and Sell Labels: When longCondition or shortCondition confirm, the script plots annotated labels directly on the chart, making entries easy to see at a glance. The labels use color coding and clear text tags (“long” vs. “short”).
- Dashboard: A table summarizes the status of the leading indicator and all confirmations. Each row shows the indicator label and whether it passed (✔️) or failed (❌) on the current bar. This intensely practical UI helps you diagnose why a signal did or did not trigger, empowering faster strategy iteration and parameter tuning.
- Failed Confirmation Markers: If a setup expires (count exceeds the limit) and confirmations failed to align, the script can mark the chart with a small label and provide a tooltip listing which confirmations did not pass. It’s a helpful audit trail to understand missed trades or prevent “chasing” invalid signals.
- Data Window Values: The script outputs signal states to the data window, which can be useful for debugging or building composite conditions in multi-indicator templates.
Inputs and Parameters
- You control the indicator from a comprehensive input panel:
- Setup: Signal expiry count, whether to enforce alternating signals, and whether to display labels and the dashboard (including position and size).
- Leading Indicator: Choose the primary signal generator from the large list.
- Per-Filter Toggles: For each confirmation, a respect... toggle enables or disables it. Many include sub-options (like MACD type, Stochastic mode, RSI mode, ADX variants, thresholds for choppiness/volatility, etc.) to fine-tune behavior.
- Range Filter Settings: Choose type and behavior; select default vs. DW mode and smoothing. The underlying functions adjust band sizes using ATR, average change, standard deviation, or user-defined scales.
- Because everything is customizable, you can adapt the indicator to different assets, volatility regimes, and timeframes.
Alerts and Automation
- The script defines alert conditions tied to longCondition and shortCondition . You can set these alerts in your chart to trigger notifications or webhook calls for automated execution in external bots. The alert text is simple, and you can configure your own message template when creating alerts in the chart, including JSON payloads for algorithmic integration.
Typical Workflow
- Select a Leading Indicator aligned with your style. For trend following, Supertrend or SSL may be appropriate; for momentum, MACD or TSI; for range/trend-change detection, Range Filter, RQK, or Donchian.
- Add a few key Confirmation Filters that complement the leading signal. For example:
- Pair Supertrend with EMA Filter and RSI MA Direction to ensure trend alignment and positive momentum.
- Combine MACD Crossover with ADX/DMI and Volume Above MA to avoid signals in low-trend or low-liquidity conditions.
- Use RQK with Choppiness Index and Damiani Volatility to only act when the market is trending and volatile enough.
- Set a sensible Signal Expiry Candle Count. Shorter expiry keeps entries timely and reduces lag; longer expiry captures setups that mature slowly.
- Observe the Dashboard during live markets to see which filters pass or fail, then iterate. Tighten or loosen thresholds and filter combinations as needed.
- For automation, turn on alerts for the final conditions and use webhook payloads to notify your trading robot.
Strengths and Practical Notes
- Flexibility: The indicator is a toolkit rather than a single rigid model. It lets you test different combinations rapidly and visualize outcomes immediately.
- Clarity: Labels, dashboard, and failed-confirmation markers make it easy to audit behavior and refine settings without digging into code.
- Robustness: The expiry and alternation options add discipline, avoiding the temptation to enter late or repeatedly in one direction without a reset.
- Modular Design: The logical gates (“respect…”) make the behavior transparent: if a filter is on, it must pass; if it’s off, the signal ignores it. This keeps reasoning clean.
- Avoiding Overfitting: Because you can stack many filters, it’s tempting to over-constrain signals. Start simple (one leading indicator and one or two confirmations). Add complexity only if it demonstrably improves your edge across varied market regimes.
Limitations and Recommendations
- No single configuration is universally optimal. Markets change; tune filters for the instrument and timeframe you trade and revisit settings periodically.
- Trend filters can underperform in choppy markets; likewise, momentum filters can false-trigger in quiet periods. Consider using Choppiness Index or Damiani to gate signals by regime.
- Use expiry wisely. Too short may miss good setups that need a few bars to confirm; too long may cause late entries. Balance responsiveness and accuracy.
- Always consider risk management externally (position sizing, stops, profit targets). The indicator focuses on signal quality; combining it with robust trade management methods will improve results.
Example Configurations
- Trend-Following Setup:
- Leading: Supertrend uptrend for longs and downtrend for shorts.
- Confirmations: EMA Filter (price above 200 EMA for long, below for short), ADX/DMI (trend strength above threshold with +DI/-DI alignment), Volume Above MA.
- Expiry: 3–4 bars to keep entries timely.
- Result: Strong bias toward sustained moves while avoiding weak trends and thin liquidity.
- Mean-Reversion to Momentum Crossover:
- Leading: RSI exits from OB/OS zones (e.g., RSI leaves oversold for long and leaves overbought for short).
- Confirmations: 2 EMA Cross (fast crossing slow in the same direction), MACD zero-line behavior for added momentum validation.
- Expiry: 2–3 bars for responsive re-entry.
- Result: Captures momentum transitions after short-term extremes, with extra confirmation to reduce head-fakes.
- Range Breakout Focus:
- Leading: Range Filter Type 2 or Donchian Trend Ribbon to detect breakouts.
- Confirmations: Damiani Volatility (avoid low-volatility false breaks), Choppiness Index (prefer trend-ready states), ROC positive/negative threshold.
- Expiry: 1–3 bars to act on breakout windows.
- Result: Better alignment to breakout dynamics, gating trades by volatility and regime.
Conclusion
- This indicator is a comprehensive, configurable framework that merges a chosen leading signal with an array of corroborating filters, disciplined expiry handling, and intuitive visualization. It’s designed to help you build high-quality entry signals tailored to your approach, whether that’s trend-following, breakout trading, momentum capturing, or a hybrid. By surfacing pass/fail states in a dashboard and allowing alert-based automation, it bridges the gap between discretionary analysis and systematic execution. With sensible parameter tuning and thoughtful filter selection, it can serve as a robust backbone for signal generation across diverse instruments and timeframes.

Heiken Ashi BasProfessional Heiken Ashi + Ichimoku Baseline Scalping Strategy
Strategy Overview:
This advanced scalping methodology combines the smoothing power of Heiken Ashi candles with the reliable support/resistance levels of Ichimoku's Kijun-sen baseline. Designed for active traders seeking precise entry points in trending markets, the strategy incorporates multiple confirmation filters to enhance signal reliability.
Key Features:
• Dual Confirmation System : Heiken Ashi trend alignment with Ichimoku baseline crossover
• Smart Risk Management : Dynamic ATR-based take profit and stop loss across multiple timeframes
• Trend Filter Integration : Optional 200 EMA filter to align with broader market direction
• Divergence Detection : Real-time Ichimoku baseline momentum analysis
• Visual Trading Signals : Clear buy/sell markers with TP/SL level displays
Technical Components:
- Heiken Ashi Smoothing : Reduces market noise for cleaner trend identification
- Ichimoku Baseline (Kijun-sen) : Acts as dynamic support/resistance level
- Multi-timeframe ATR : Adaptive position sizing based on market volatility
- Momentum Confirmation : Baseline divergence filtering for enhanced timing
Ideal For:
- Forex and cryptocurrency markets
- 1-5 minute timeframes for scalping
- Trending market conditions
- Risk-aware traders seeking systematic approaches
Customization Options:
- Adjustable TP/SL multipliers based on risk tolerance
- Optional trend and divergence filters
- Flexible timeframe settings for different trading styles
- Visual display preferences for chart clarity
Educational Value:
This script demonstrates professional-grade techniques in:
- Multi-indicator convergence strategies
- Dynamic risk management implementation
- Real-time market structure analysis
- Systematic trade execution methodolog

Bollinger Bands Breakout StrategyHey guys check out this strategy script.
Chart plotting:
I use a classic plot of Bollinger Bands to define a consolidation zone, I also use a separate Trend Filter (SMA).
Logic:
When the price is above the SMA and above the Bollinger Upper Band the strategy goes Long. When the price is below the SMA and below the Bollinger Lower Band the strategy goes Short. Simple.
Exits:
TP and SL are a percentage of the price.
Notes: This simple strategy can be used at any timeframe (I prefer the 15min for day trading). It avoids consolidation, when the price is inside the Bollinger Bands, and has a good success rate. Adjust the Length of the BB to suit your style of trading (Lower numbers=more volatile, Higher numbers=more restrictive). Also you can adjust the Trend Filter SMA, I presonally chose the 50 SMA. Finally the SL/TP can be also adjusted from the input menu.
Test it for yourself!
Have great trades!

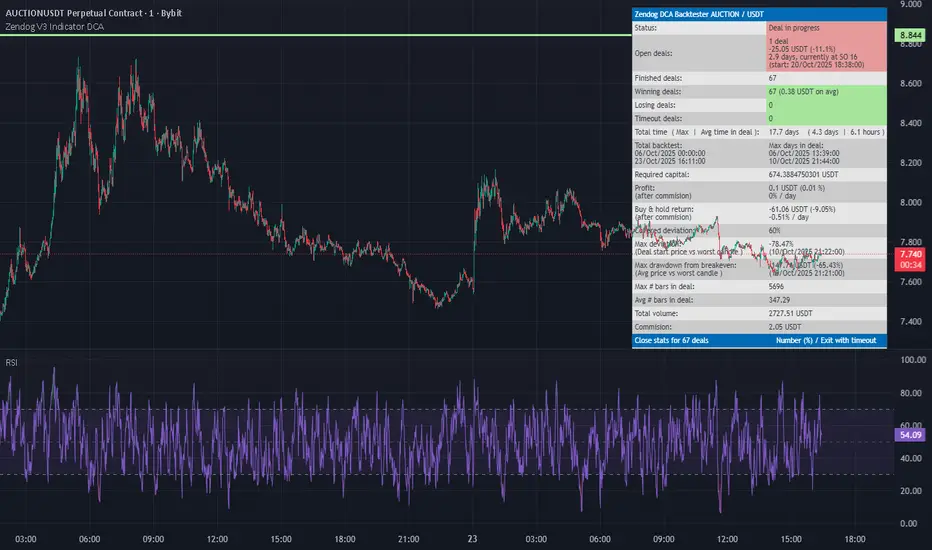
Zendog V3 Indicator DCAThis strategy is same as Zendog v3 but edited to be backtest compatible for SO additions through indicator
for Longs
Safety order type = External indicator
External indicator = RSI 30/70 : Long Trigger
Safety Order Value = 1
for Shorts
Safety order type = External indicator
External indicator = RSI 30/70 : Short Trigger
Safety Order Value = 2
Amiya's Doji / Hammer / Spinning Top Breakout Strategy v5How it works
1. Pattern Detection (Previous Candle):
• Checks if total shadow length ≥ 2 × body.
• Checks if candle height (high − low) is between 10 and 21.5 points.
• If true → marks that candle as a potential Doji, Hammer, or Spinning Top.
2. Long Setup:
• LTP (close) crosses above previous candle high.
• Previous candle is a valid pattern candle.
• Stop Loss = 3 points below previous candle low.
• Take Profit = 5 × (high − low) of previous candle added to previous high.
3. Short Setup:
• LTP (close) crosses below previous candle low.
• Previous candle is a valid pattern candle.
• Stop Loss = 3 points above previous candle high.
• Take Profit = 5 × (high − low) of previous candle subtracted from previous low.
4. Visualization:
• Yellow background highlights pattern candles.
• Green ▲ and Red ▼ markers show entry points.
Deep yellow candles → represent Doji / Hammer / Spinning Top patterns
• Green triangle → Buy signal
• Red triangle → Sell signal
• Dotted green line + label → Target
• Dotted red line + label → Stop loss
• Gray background → Outside trading hours
• Auto close → All trades square off at 3:29 PM IST

Squeeze Breakout Strategy [KedArc Quant]Description:
Squeeze Breakout strategy looks for volatility compression (Bollinger Bands inside Keltner Channels = a “squeeze”), then trades the volatility expansion in the direction of a momentum filter.
🧠 How the “Squeeze → Expansion” works
- Markets alternate between quiet (compressed) and active (expanded) phases.
- We call it a squeeze when Bollinger Bands (BB)—which reflect standard deviation around price—shrink inside the Keltner Channels (KC)—which reflect ATR/range.
- This means dispersion (stdev) is small relative to typical range (ATR). Price is coiling; participants are agreeing on value.
- When BB pops back outside KC, the squeeze releases. That’s the first sign that volatility is expanding again.
- A release alone doesn’t tell you direction. That’s why this strategy pairs the release with a momentum filter:
- We estimate momentum using a smoothed linear-regression slope of price (a clean proxy for acceleration).
- If the slope is positive at release, we favor longs; if negative, we favor shorts.
- Optionally, you can require Band Break + Momentum (price closes beyond the BB) for a stricter entry.
- This combination aims to capture the first leg of the range-to-trend transition while avoiding random pokes that often occur during tight consolidations.
💡 Why this is unique
Two entry modes (toggle):
1. Release + Momentum (enter when the squeeze turns off)
2. Band Break + Momentum (enter on a close beyond BB with momentum)
- Momentum = smoothed linear-regression slope, a clean thrust detector that’s less laggy than many oscillators.
- Risk module included: ATR stop, optional 1R partial take-profit, and a Chandelier trailing stop for the runner.
- Practical filters: higher-timeframe EMA trend alignment, volume surge, minimum BB width, and session window—so it adapts across markets/timeframes.
- Backtest-ready: uses TradingView’s `strategy.` framework with commission/slippage controls.
📈 How it helps traders
✅Regime clarity: distinguishes compression vs. expansion so you’re not forcing trades during dead zones.
✅Objective entries: momentum + band logic reduces discretionary “feel” and late chases.
✅Built-in risk plan: stop/targets/trailing defined in inputs—consistent execution across tickers.
✅Adaptable: works across instruments/timeframes; filters let you tailor noise tolerance per market session.
✅Alerts: real-time signals for entry and squeeze release.
✅Not a Mash-Up / Original Work
✅Fully authored in Pine Script v6; no external libraries or copied logic blocks.
✅Uses well-known, documented formulas (BB, KC, ATR, LinReg slope) combined into a new rule set (two entry modes + momentum + structured exits).
✅Code and parameters are transparent and adjustable; the script stands alone.
🧩 Formulas (core)
Bollinger Bands
# Basis = `SMA(close, bbLen)`
# Upper/Lower = `Basis ± bbMult × stdev(close, bbLen)`
# Width% = `(Upper − Lower) / Basis × 100`
Keltner Channels
# Basis = `EMA(close, kcLen)`
# Upper/Lower = `Basis ± kcMult × ATR(kcATR)`
Squeeze state
# ON: `BB_Upper < KC_Upper` and `BB_Lower > KC_Lower`
# Release: `squeeze_on ` and `not squeeze_on`
Momentum (this script)
# `lin = linreg(close, momLen, 0)`
# `mom = SMA( lin − lin , momSmoothing )`
# Long bias when `mom > 0`; short bias when `mom < 0`.
⚙️ Inputs
Compression
`bbLen`, `bbMult` — BB length & std-dev multiplier
`kcLen`, `kcATR`, `kcMult` — KC lengths & ATR multiplier
`Entry Mode` — Release + Momentum, Band Break + Momentum, or Either
Momentum
`momLen`, `momSmoothing`
Filters (optional)
`Use HTF Trend Filter` + `HTF Timeframe` + `HTF EMA Length`
`Require Volume Surge` (`volLen`, `volMult`)
`Avoid Ultra-Low Vol` (`Min BB Width %`)
`Session` window
Risk / Exits
`ATR Length`, `ATR Stop Multiplier`
`Take Profit at 1R` (with Partial 50%)
`Chandelier` (`chLen`, `chMult`)
Optional `Time Stop (bars)`
🎯 Entry & Exit Rules
Entry (choose one mode):
1. Release + Momentum (default)
Long: on the bar the squeeze releases and `mom > 0`, passing all enabled filters.
Short: on the bar the squeeze releases and `mom < 0`, passing filters.
2. Band Break + Momentum
Long: `close > BB_Upper` and `mom > 0`, with filters.
Short: `close < BB_Lower` and `mom < 0`, with filters.
Initial Stop
ATR-based: `Stop Distance = atrMult × ATR(atrLen)` from entry.
Targets & Runner
TP1 at 1R (optional): take 50% at `entry + 1R` (long) / `entry − 1R` (short).
Runner: remaining position trails a Chandelier stop:
Long trail = `highest(high, chLen) − chMult × ATR`
Short trail = `lowest(low, chLen) + chMult × ATR`
Optional Time Stop: close the trade after N bars in position.
Labels on chart
“Long” / “Short” = entry signals.
“L-TP1 / S-TP1” = partial exits at 1R.
“L-Runner / S-Runner” = trailing-stop exits of the runner.
Alerts
Provided for Long Entry, Short Entry, and Squeeze Release.
💬 How to use
1. Choose your market/timeframe (e.g., NSE 5–15m intraday, 60m–Daily for swing).
2. If you prefer cleaner trends, enable the HTF EMA filter (e.g., 240m/1D).
3. For intraday, consider Band Break + Momentum with Volume Surge and a small Min BB Width.
4. Adjust ATR/Chandelier multipliers to fit your risk tolerance and instrument.
Abbreviations
BB – Bollinger Bands
KC – Keltner Channels
ATR – Average True Range
SMA / EMA – Simple/Exponential Moving Average
HTF – Higher Timeframe
R – Risk unit (equal to the initial stop distance)
⚠️ Disclaimer
This script is for educational purposes only. Past performance ≠ future returns. Always paper trade first. Options trading carries high risk — manage exposure responsibly.

Venza Rocket ScalperVenza Rocket Scalper: Compliant Description (Plaintext)
This strategy is a complex, multi-indicator trend-following system designed for intraday scalping on low-timeframe charts. It uses a confluence of four distinct filters to ensure high-conviction entries during optimal momentum and volume.
1. Overview and Core Logic
The entry signal requires simultaneous confirmation from the following components:
Trend Confirmation (Heikin-Ashi EMAs): The primary trend is established using Heikin-Ashi price action combined with an EMA (Fast=8) crossing and remaining above an EMA (Slow=21). This provides a smoother, momentum-based trend signal.
Momentum Strength (ADX/RSI): The trend must be validated by the ADX (default 16) to confirm sufficient directional strength, and the RSI (default 42) to confirm continued positive internal momentum.
Volume Validation: A dynamic filter requires the current bar's volume to be greater than the 20-period Volume MA (multiplied by the default 1.0 factor), ensuring trades are executed during periods of active market participation.
Session & Volatility Filter: Trades are restricted to a defined trading window (default UTC 12:00 to 20:00). The script also includes an optional Volatility Cap filter based on a long-term ATR to suppress entries during extreme volatility.
2. Trade Management and Realistic Risk
This strategy employs a robust, partial-exit risk management plan driven by the Average True Range (ATR) for sustainable risk control.
Initial Stop Loss (SL): The initial SL is tight and calculated dynamically using the 14-period ATR multiplied by an adjustable factor (default 0.7). This size is designed for micro-losses appropriate for scalping and is adapted slightly during high volatility.
Partial Exits & Profit Taking: The position is split into two equal halves for exit management:
50% Position (TP1): Exited at a 1R profit target, where 1R is defined as the exact value of the initial ATR-based SL.
50% Position (Run): Managed by a Trailing Stop Loss (TSL), with trail points also calculated dynamically using the current ATR.
Breakeven (BE) Lock: An optional feature (default: ON) automatically moves the stop loss to Breakeven (entry price plus 1 tick) once the position is 2 ticks in profit, locking in capital protection rapidly.
Daily Risk Controls: The strategy includes mandatory daily money management features (default: ON):
Max Daily Loss Stop: Stops all trading for the day if the cumulative closed P&L reaches -$500 (default).
Profit Protection Floor: If the closed P&L reaches a minimum threshold (default $110), any open position will be closed if the total daily P&L drops back below this floor, locking in minimum daily gains.
3. Strategy Properties & Backtesting Disclosure
The default settings are configured for high-liquidity futures or FX markets. Users must ensure their backtesting environment is realistic:
Risk Per Trade: The ATR-based SL aims to keep the risk per trade below 5% of a reasonable account size, which is critical for sustainable trading.
Contracts/Size: Default quantity is 3 contracts.
Commissions/Slippage: Commissions and slippage MUST be configured by the user in the Strategy Properties window to reflect real-world brokerage fees and execution costs.
Sample Size: The strategy should be run on a dataset that generates over 100 trades for statistically valid results.
MANDATORY DISCLAIMER: Past performance is not necessarily indicative of future results. Trading involves substantial risk. All claims of historical performance are substantiated by the backtesting results on the chart, but these results do not guarantee actual trading outcomes. Keep your language realistic.
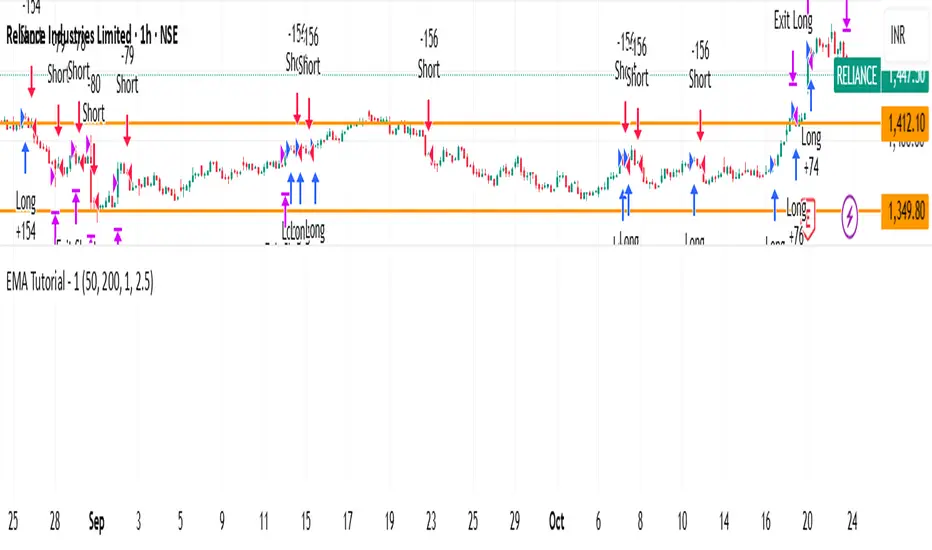
EMA Tutorial - 1Buy when in downtrend and close above EMA_50
Buy when in uptrend and below EMA_50
adjust ema length and risk reward for other stocks. Works good with nifty. Need to perform stress test on it
[Aegis]DCA grid Strategy for Crypto### **Crypto Market Long-Only Strategy (DCA with Risk Mitigation)**
This strategy is a Long-only approach, often using a Dollar-Cost Averaging (DCA) method for staggered entries. It is designed to mitigate the risk of being unable to exit a position for a prolonged period, which typically occurs when a series of initial DCA entries result in a losing trade.
The strategy has the following characteristics:
#### **1. Markets**
* Trade in highly liquid Perpetual Futures markets for cryptocurrencies.
#### **2. Position Sizing**
The initial entry quantity is determined by setting the **Initial Entry Ratio** in the input values.
* If the **Subsequent Entry Multiplier** is 1, the maximum position size upon final entry is determined by:
$$\text{Initial Entry Quantity} \times \text{Number of Entries}$$
* If the **Subsequent Entry Multiplier** is $x$, the maximum position size is determined by the following cumulative sum:
$$\text{1st Entry Quantity} + (\text{1st Entry Quantity} \times x) + (\text{2nd Entry Quantity} \times x) + \dots + ((\text{n-1)th Entry Quantity} \times x)$$
#### **3. Entries**
* The **1st Entry** is determined by the **Entry Sensitivity**. The first entry is automatically calculated based on an oversold condition; setting a higher sensitivity value will trigger the 1st entry in a more significant oversold situation.
* Entries from the **2nd Entry onwards** are made sequentially based on the generated **Grid Spacing**.
* The **Grid Spacing** is calculated as an equal interval:
$$\text{Grid Spacing} = \frac{\text{Final Entry Distance}}{(\text{Number of Entries} - 1)}$$
#### **4. Exits**
This strategy **does not distinguish between Stop-Loss and Take-Profit**. All entered quantities are liquidated simultaneously upon mean reversion. This transaction may result in either a loss or a profit. Generally:
* If the price recovery is rapid, the trade finishes with a profit.
* If the price recovery is slow, the trade finishes with a loss.
Therefore, the **'resilience' or 'recovery speed'** of the underlying asset significantly influences the long-term performance of the strategy.
크립토 시장에 특화된 Long only전략입니다. DCA 방식의 분할 매수 전략이 대체로 이익 거래가 아닌 경우, 장기간 탈출하지 못할 리스크를 보완한 전략입니다.
이 전략은 다음과 같은 특징을 가지고 있습니다.
##### 1. 시장 (Markets)
• 유동성이 풍부한 코인 무기한 선물 시장에서 거래한다.
##### 2. 포지션 크기 (Position Sizing)
인풋 값에 최초진입비율을 설정함으로써 1차 진입의 수량이 결정됩니다.
- 추가 진입배수가 1일 때, 최대 진입 시 포지션 크기는 "1차 진입수량 * 진입횟수"에 의해 결정됩니다.
- 추가 진입배수가 x일때,
1차진입물량 + (1차진입 물량 * x) + (2차진입 물량 * x) ..... + (n-1)차 진입물량 * x 의 방식으로 최대 진입 시 포지션 크기가 결정 됩니다
##### 3. 진입 (Entries)
- 1차 진입은 진입 둔감도에 의해 결정됩니다. 1차 진입은 과매도 상황을 자동적으로 계산하여 결정되며, 둔감도를 높은 값으로 설정하면 더 큰 과매도 상황에서 1차 진입이 결정됩니다.
- 2차 이후의 진입은 생성된 그리드 간격에 의해 순차적으로 진입하게 됩니다.
- 그리드 간격은 최종 진입 간격 / (진입 횟수 - 1) 으로 등간격으로 이루어집니다.
##### 4. 청산 (Exits)
이 전략은 손절과 익절을 구분하지 않습니다. 평균 회귀를 하는 경우 진입한 모든 물량을 일시에 청산하며, 이 거래는 손실 거래일 수도, 이익 거래일 수도 있습니다. 일반적으로, 가격 회복이 빠르게 되는 경우 이익 거래로 마무리되고, 가격 회복이 느린 경우 손실 거래로 마무리되기 때문에, 장기적으로 종목의 '회복탄력성'이 전략의 성과에 영향을 줄 수 있습니다.

[Aegis]Original Turtle System for CryptoAs Richard Dennis once said, "Even if I published all the Turtle rules in the newspaper right now, no one would be able to 'execute' them," and 40 years later, even in modern financial markets (like the crypto market) where all the conditions have been disclosed, this strategy continues to deliver amazing performance. The following outlines the original Turtle rules as disclosed by Curtis Faith in his book *Way of the Turtle*, and a TradingView algorithm that translates these rules for application in the crypto market.
---
### **The Original Turtle Trading Rules**
#### **1. Markets**
* Trade in liquid futures markets.
#### **2. Position Sizing**
The volatility measure, **N**, is used as the basis for all calculations.
**True Range (TR) Calculation:** Select the largest of the following three values:
* Current High - Current Low
* $|\text{Current High} - \text{Previous Close}|$ (Absolute Value)
* $|\text{Current Low} - \text{Previous Close}|$ (Absolute Value)
**N (Average True Range, ATR) Calculation:**
$$N = \frac{(19 \times \text{PDN} + \text{TR})}{20}$$
* **PDN:** Previous Day's N value
* **TR:** Current True Range
This is similar to a 20-day Exponential Moving Average, and is sometimes calculated using a Simple Moving Average.
**Unit Size Calculation:**
$$\text{Unit Size (Number of Contracts)} = \frac{1\% \text{ of Account Equity}}{(\text{N} \times \text{Dollars per Point})}$$
* **Dollars per Point (Tick Value):** The value of a 1-point change in price.
#### **3. Entries**
* **Entry:** Buy when the 55-day high is broken to the upside, and sell when the 55-day low is broken to the downside.
#### **5. Stops**
* The stop-loss for every unit is set at a price **2N** unfavorable from the entry price.
* For each additional unit added, the stop price for the **entire position** is adjusted favorably by **1/2 N**.
* In other words, the stop price of the last unit entered becomes the stop price for the entire position.
#### **6. Exits**
The exit rule for profitable positions (before a stop is hit) is as follows:
* **Long Positions:** Exit when the 20-day low is broken to the downside.
* **Short Positions:** Exit when the 20-day high is broken to the upside.
*Note: This exit rule is followed only if the price has moved up by a value greater than or equal to the N value multiplied by the criterion for changing the take-profit line (the original Korean text mentions a condition based on N, which is commonly interpreted as requiring a profit before applying the channel exit).*
리처드 데니스가 앞서 "내가 지금 당장 터틀의 모든 규칙을 신문에 공표한다고 해도 아무도 '실행'하지 못할 것"라고 말했듯 40년이 흘러 모든 조건이 공개된 현대 금융시장(크립토 시장)에서도 여전히 이 전략은 놀라운 퍼포먼스를 기록하고 있습니다. 아래는 커티스 페이스가 자신의 저서 '터틀의 방식'에 공개한 오리지널 터틀 규칙과 이를 알고리즘으로 변환하여 크립토마켓에 적용한 트레이딩뷰 알고리즘 입니다.
##### 1. 시장 (Markets)
• 유동성이 풍부한 선물 시장에서 거래한다.
##### 2. 포지션 크기 (Position Sizing)
변동성 측정 단위인 N을 모든 계산의 기초로 사용한다.
**True Range (TR) 계산:** 다음 세 가지 값 중 가장 큰 값을 선택한다.
- • 현재 고가 - 현재 저가
- • |현재 고가 - 전일 종가| (절대값)
- • |현재 저가 - 전일 종가| (절대값)
**N (Average True Range, ATR) 계산:**
N = (19 × PDN + TR) / 20
- • PDN: 이전 날의 N 값
- • TR: 현재 True Range
이는 20일 지수이동평균과 유사하며, 단순이동평균으로 계산하기도 한다.
**1 유닛(Unit)의 크기 계산:**
유닛 크기 (계약 수) = 계좌 자산의 1% / (N × 틱 가치)
• 틱 가치(Dollars per Point): 1포인트 변동 시의 가치
##### 3. 진입 (Entries)
- • 진입: 55일 고가를 상향 돌파하면 매수, 55일 저가를 하향 돌파하면 매도한다.
##### 5. 손절 (Stops)
- • 모든 유닛에 대한 손절 기준은 진입 가격으로부터 2N 만큼 불리한 가격에 설정한다.
- • 유닛이 추가될 때마다 전체 포지션의 손절 가격을 1/2 N 만큼 유리한 방향으로 상향 조정한다.
- • 즉, 마지막으로 진입한 유닛의 손절 가격이 전체 포지션의 손절 가격이 된다.
##### 6. 청산 (Exits)
손절에 도달하기 전 수익 중인 포지션의 청산 규칙은 다음과 같다.
- • 매수 포지션: 20일 저가를 하향 돌파할 때 청산한다.
- • 매도 포지션: 20일 고가를 상향 돌파할 때 청산한다.
단, N값에 익절선 변경 기준을 곱한 값 이상으로 가격이 상승할 경우, 위 규칙을 따른다.

NNFX Lite Precision Strategy - Balanced Risk Management🎯 Overview
The NNFX Lite Precision Strategy is a complete trading system designed for consistent, risk-managed trading at 4H timeframe and BTC/USD. It combines simple yet effective technical indicators with professional-grade risk management, including automatic position sizing and multiple take-profit levels.
This strategy is based on the No Nonsense Forex (NNFX) methodology enhanced with modern risk management techniques.
✨ Key Features
🛡️ Professional Risk Management
- Automatic 1% Position Sizing: Every trade risks exactly 1% of your account equity, calculated automatically based on stop loss distance
- Multiple Take-Profit Levels: Scale out at 33%, 50%, and 100% of position at 2 ATR, 3 ATR, and 4.5 ATR respectively
- Trailing Stop Protection: Activates after 2 ATR profit to protect gains while letting winners run
- Average Risk/Reward: 2:1 to 3:1 depending on exit level
- ATR-Based Stops: 1.5× ATR stop loss provides proper breathing room while managing risk
📊 Technical Indicators
- **Baseline**: 21-period EMA for trend direction
- Confirmation 1: SuperTrend (7-period ATR, 2.0 multiplier) for trend validation
- Confirmation 2: 14-period RSI for momentum and overbought/oversold zones
- Volume Filter: Requires 1.4× average volume for quality setups
- Exit Indicator: Multiple TP levels with trailing stop
🎛️ Precision Filters (All Configurable)
1. Trend Strength: Requires 3+ consecutive bars in same SuperTrend direction
2. Momentum Alignment: Baseline and RSI must be rising (long) or falling (short) for 2 bars
3. Volume Confirmation: Entry volume must exceed 1.4× of 20-bar average
4. Cooldown Period: 4-bar minimum between entries to prevent overtrading
5. Optional Filters: Distance from baseline, RSI strength threshold, strong momentum (3-bar)
📈 Entry Conditions
LONG Entry Requirements:
- Price above 21 EMA (current and previous bar)
- SuperTrend GREEN and confirmed for 3+ bars
- RSI between 50-70 (bullish but not overbought)
- EMA and RSI both rising (momentum alignment)
- Volume > 1.4× average
- At least 4 bars since last entry
- No current position
SHORT Entry Requirements:
- Price below 21 EMA (current and previous bar)
- SuperTrend RED and confirmed for 3+ bars
- RSI between 30-50 (bearish but not oversold)
- EMA and RSI both falling (momentum alignment)
- Volume > 1.4× average
- At least 4 bars since last entry
- No current position
🚪 Exit Conditions
Multiple Take-Profit Strategy:
- TP1 (2.0 ATR): Exit 33% of position = 1.33:1 R:R
- TP2(3.0 ATR): Exit 50% of remaining = 2:1 R:R
- TP3 (4.5 ATR): Exit 100% remaining = 3:1 R:R
Trailing Stop:
- Activates after 2 ATR profit
- Trails by 1 ATR offset
- Protects profits while allowing trend continuation
Stop Loss:
- 1.5× ATR from entry
- Risks exactly 1% of account (via automatic position sizing)
Opposite Signal Exit:
- Closes position if opposite direction signal appears (no reversal entry, clean exit only)
⚙️ Customizable Settings
Trading Parameters:
- Enable/Disable Longs and Shorts independently
- Adjustable Risk % (default: 1.0%)
- Entry label display options
Precision Filters (All Optional):
- Trend Strength: Toggle ON/OFF, adjustable bars (1-10)
- Momentum Alignment: Toggle standard or strong (3-bar) momentum
- Volume Filter: Toggle ON/OFF, adjustable multiplier (1.0-3.0×)
- Cooldown: Adjustable bars between entries (0-20)
- Distance Filter: Optional distance requirement from baseline
- RSI Strength: Optional RSI strength threshold for entries
Indicator Parameters:
- Baseline EMA Period (default: 21)
- SuperTrend ATR Period (default: 7)
- SuperTrend Multiplier (default: 2.0)
- RSI Period (default: 14)
- Volume MA Period (default: 20)
- ATR Period for exits (default: 14)
📊 Expected Performance
Balanced Default Settings:
- Trade Frequency: 8-15 trades per month (4H timeframe)
- Win Rate**: 55-70%
- Profit Factor: 2.5-3.5
- Average Win: +2.0% to +3.0%
- Average Loss: Exactly -1.0%
- Risk Consistency: Every trade risks exactly 1%
Note: Performance varies by market, timeframe, and market conditions. Past performance does not guarantee future results.
🕐 Recommended Timeframes
- Daily (1D): Best for swing trading, high-quality signals
- 4-Hour (4H): Optimal balance of frequency and accuracy
💎 Best Use Cases
Ideal For:
✅ Cryptocurrency (BTC, ETH, major alts)
✅ Stock indices (SPX, NDX, DJI)
✅ Individual stocks with good liquidity
✅ Commodities (Gold, Silver, Oil)
Works Best In:
✅ Trending markets
✅ Normal to high volatility
✅ Liquid instruments with tight spreads
✅ Markets with clear directional movement
Less Effective In:
⚠️ Choppy/sideways markets (use filters)
⚠️ Low liquidity instruments
⚠️ During major news events (use cooldown)
⚠️ Extremely low volatility periods
🎓 How to Use
1. Initial Setup:
- Add strategy to chart
- Set initial capital to match your account
- Verify commission settings (default: 0.05%)
- Adjust risk % if desired (default: 1% recommended)
2. Customize Filters:
- **Conservative**: Enable all filters, increase thresholds
- **Balanced** (Default): Standard filter settings
- **Aggressive**: Disable optional filters, lower thresholds
3. Backtest:
- Run on historical data (minimum 2 year)
- Check Strategy Tester results
- Verify profit factor > 2.0
- Ensure win rate > 50%
- Review individual trades
4. Forward Test:
- Paper trade for 2-4 weeks
- Monitor performance vs backtest
- Adjust filters if needed
5. Live Trading:
- Start with small position sizes
- Monitor risk per trade (should be consistent 1%)
- Let take-profit levels work automatically
- Don't override the system
⚠️ Important Notes
Risk Management:
- This strategy calculates position size automatically based on your risk % setting
- Default 1% risk means each losing trade costs 1% of your account
- Ensure you have sufficient capital (minimum $1,000 recommended)
- Stop loss distance varies with ATR (volatile markets = larger SL = smaller position)
Market Conditions:
- Strategy performs best in trending markets
- Use higher cooldown settings in choppy conditions
- Consider disabling in extremely volatile news events
- May underperform during prolonged consolidation
Execution:
- Strategy uses limit orders for TP levels
- Slippage can affect actual entry/exit prices
- Commission settings should match your broker
- High-spread instruments will reduce profitability
🔧 Configuration Profiles
Conservative (High Accuracy, Fewer Trades):
Trend Bars: 4-5
Strong Momentum: ON
Volume Multiplier: 1.6-1.8×
Cooldown: 6-8 bars
Distance Filter: ON
RSI Strength: ON
Expected: 4-8 trades/month, 65-80% win rate
Balanced (Default - Recommended):
Trend Bars: 3
Strong Momentum: OFF
Volume Multiplier: 1.4×
Cooldown: 4 bars
Distance Filter: OFF
RSI Strength: OFF
Expected: 8-15 trades/month, 55-70% win rate
Aggressive (More Trades):
Trend Bars: 2
Momentum: OFF
Volume Multiplier: 1.2×
Cooldown: 2 bars
All Optional Filters: OFF
Expected: 15-25 trades/month, 50-60% win rate
📚 Strategy Logic
Core Philosophy:
This strategy follows the principle that consistent, properly-managed trades with positive expectancy will compound over time. It doesn't try to catch every move or avoid every loss - instead, it focuses on:
1. Quality Setups: Multiple confirmations reduce false signals
2. Proper Position Sizing: 1% risk ensures survivability
3. Asymmetric Risk/Reward: Average wins exceed average losses
4. Scaling Out: Partial profits reduce stress and lock in gains
5. Trailing Stops: Capture extended trends without guessing tops/bottoms
Not Included:
- No martingale or position averaging
- No grid trading or pyramiding
- No reversal trades (clean exit only)
- No look-ahead bias or repainting
- No complicated formulas or curve-fitting
🎯 Performance Tips
1. Let the System Work: Don't override exits or entries manually
2. Respect the Risk: Keep risk at 1% per trade maximum
3. Monitor Equity Curve: Smooth upward = good, choppy = adjust filters
4. Adapt to Conditions: Use conservative settings in uncertain markets
5. Track Statistics: Keep a journal of trades and performance
6. Stay Disciplined: The strategy's edge comes from consistency
7. Update Periodically: Review and adjust filters monthly
✅ Advantages
✅ Automated Risk Management: Position sizing calculated for you
✅ Multiple Exit Levels: Reduces stress, improves R:R
✅ Highly Customizable: Adjust to your trading style
✅ Simple Indicators: Easy to understand and verify
✅ No Repainting: Signals don't disappear or change
✅ Proper Backtesting: All calculations use confirmed bars
✅ Works on All Timeframes: From 15M to Daily
✅ Universal Application: Forex, crypto, stocks, indices
✅ Visual Feedback: Background colours show setup alignment
✅ Clean Code: Well-documented Pine Script v5
⚠️ Limitations
⚠️ Requires Trending Markets: Underperforms in consolidation
⚠️ Not a Holy Grail: Will have losing trades and drawdowns
⚠️ Needs Proper Capital: Minimum $1,000 recommended
⚠️ Slippage Impact: Real-world execution may differ
⚠️ Backtesting Bias: Past results don't guarantee future performance
⚠️ Learning Curve: Optimal settings require experimentation
⚠️ Market Dependent: Some markets work better than others
📊 Statistics to Monitor
When evaluating this strategy, focus on:
1. Profit Factor: Should be > 2.0 (higher is better)
2. Win Rate: Target 50-70% (varies by settings)
3. Average Win vs Average Loss: Should be at least 1.5:1
4. Maximum Drawdown: Keep under 15-20%
5. Consistency: Look for steady equity curve
6. Number of Trades: Minimum 30-50 for statistical relevance
7. Risk/Trade: Should be consistent around 1%
🔐 Risk Disclaimer
IMPORTANT: Trading carries substantial risk of loss and is not suitable for all investors. Past performance is not indicative of future results. This strategy is provided for educational purposes and should not be considered financial advice.
Before using this strategy with real money:
- Thoroughly backtest on historical data
- Forward test on a demo account
- Understand your broker's execution and fees
- Only risk capital you can afford to lose
- Consider consulting with a financial advisor
- Start with small position sizes
- Monitor performance regularly
The creator of this strategy:
- Makes no guarantees of profitability
- Is not responsible for any trading losses
- Recommends proper risk management at all times
- Suggests thorough testing before live use
📞 Support & Updates
- Version: 1.0 (Pine Script v6)
- Last Updated**: 2025
- Tested On: Multiple forex pairs, crypto, indices
- Minimum TradingView Plan: Free (backtesting included)
For questions, suggestions, or bug reports, please comment below or send a message.

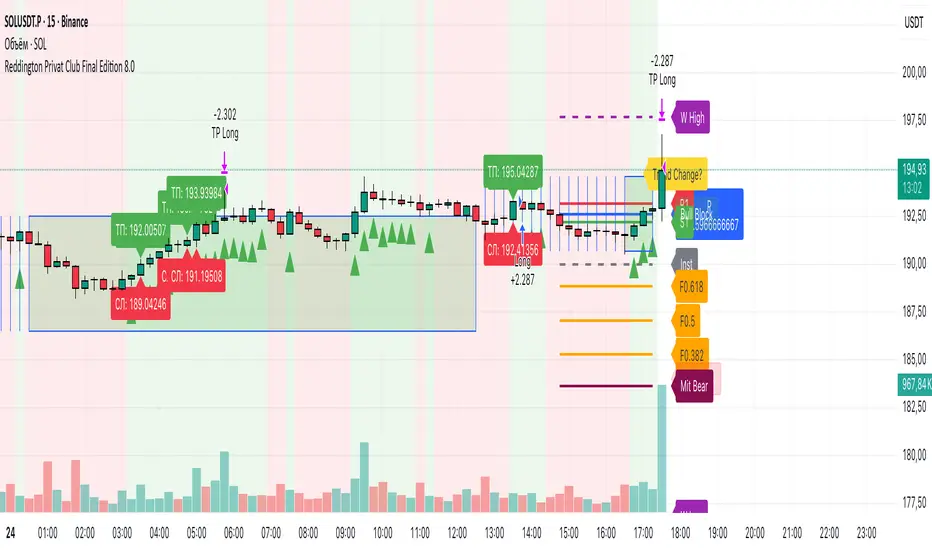
Reddington Privat Club Final Edition 8.0Introduction
Reddington Privat Club Final Edition is an advanced trading strategy designed to identify high-probability entries based on institutional levels, order blocks, and reversal patterns. The strategy combines multi-timeframe analysis (4H, 1D, 1W) with dynamic risk management to help traders capture trending moves with minimal risk. It is optimized for volatile markets like cryptocurrencies (e.g., ETH/USD on 15m timeframe) but can be adapted for forex or stocks.
The strategy automatically detects bullish and bearish order blocks on 4H, filters signals through breakouts, outside bars, and climax candles, and applies strict risk management with partial position closure. This is not a “holy grail,” but a tool for disciplined trading—always backtest on historical data before use!
Key Features
Order Block Detection: Automatic identification of institutional blocks on 4H with visual boxes (green for bullish, red for bearish). Blocks update and “mitigate” upon breach.
Entry Signals:
Long: Bullish trend + breakout/up/outside up/climax sell (no fakeout) + proximity to bullish block/mitigated + institutional level.
Short: Bearish trend + breakout/down/outside down/climax buy (no fakeout) + proximity to bearish block/mitigated + institutional level.
Risk Management:
SL: Dynamic based on ATR (14) * factor (default 1.0).
TP: Simplified—full position closes at HalfTP level (distance = 2 * SL distance, RR 1:2).
Position Size: 2% of equity with leverage (default 10x).
Visualization:
Background: Green for bullish trend, red for bearish.
Lines: Institutional levels, pivot (P, R1, S1), equal highs/lows, weekly high/low, Fibonacci (0.382/0.5/0.618 on 4H), mitigated blocks.
Labels: Signals (triangles), levels (Entry, SL, TP) on chart.
Boxes: Order blocks with color indication.
Additional: Trend continuation arrows, warnings for trend change at Fib 0.618.
The strategy uses request.security for multi-timeframe, arrays for blocks, and alerts for notifications.
Parameters (Inputs)
Risk Percent (2%): Percentage of equity per trade (0.1–10%).
Risk/Reward Ratio (4): Not used in current version (kept for compatibility; TP fixed at RR 1:2).
Leverage (10): Leverage for position sizing (1–100).
ATR Factor for SL (1.0): ATR multiplier for SL (0.5–3, step 0.1).
Bull Block Color: Bullish block color (default semi-transparent green).
Bear Block Color: Bearish block color (default semi-transparent red).
Line Width (1): Line thickness (1–5).
How to Use
Installation: Add the script to your chart (recommended TF: 15m for entries, with 4H/1D for context).
Settings: Set Risk Percent and Leverage to match your account. Test ATR Factor on historical data (backtest in Strategy Tester).
Signals:
Green triangle below bar — Long signal (buy).
Red triangle above bar — Short signal (sell).
Wait for confirmation: Signal + level labels (Entry/SL/TP).
Management:
Enter on the open of the next bar after signal.
Monitor SL/TP—the strategy auto-closes the position.
Avoid trading in flat (use trend background).
Backtesting: Test in Strategy Tester over 1–2 years. Account for commissions/spread (set in tester).
Alerts: Enable notifications for Long/Short Entry, SL/TP.
Recommendations:
Risk no more than 2% per trade.
Combine with manual analysis (e.g., news).
Demo test before live trading.
Important Disclaimer
This script is provided for educational and informational purposes only. It does not constitute financial advice or a recommendation to trade. Trading financial instruments involves a high risk of loss of capital, and past performance does not guarantee future profits. The author is not liable for any losses resulting from the use of this script. Before using, thoroughly backtest on historical data and consult a qualified financial advisor. TradingView and the author make no warranties as to the accuracy or functionality of the script. Use at your own risk.
If you have questions or suggestions for improvements, leave a comment! Happy trading! 📈
Mario vr SIT MC Utilizar en el gráfico
4
1
55
🧠 Market Structure Pro System – MVR
Market Structure Pro System – MVR is an advanced trading strategy designed to detect key reversal and trend-break zones with high precision.
It combines multiple professional tools within a single algorithm — integrating market structure, dynamic channels, volatility filters, and trend confirmations — making it ideal for scalping and swing trading across different markets (Forex, indices, cryptocurrencies, or stocks).
⚙️ How it works
The algorithm performs a complete structural analysis of the market through several technical layers:
🔹 1. Price Structure (BOS, Supply & Demand)
The system automatically detects:
Order Blocks
Supply and Demand Zones
Break of Structure (BOS) to identify market structure shifts
This allows traders to recognize where price is likely to react or break a trend, anticipating major market movements.
🔹 2. Keltner Channels and Linear Regression
The strategy uses multiple Keltner Channels with different settings to measure volatility expansion and contraction.
In combination, a dynamic linear regression line shows the overall market direction, helping confirm whether price is trending or ranging.
🔹 3. Volatility and Trend Filters
It integrates several complementary systems:
ATR (Average True Range): measures the strength and volatility of price movement.
PSAR (Parabolic SAR): identifies potential trend reversals.
Supertrend: acts as the main trend filter and confirmation tool.
These filters work together to avoid false signals in ranging or low-volatility conditions.
🔹 4. Swing Highs / Lows and Dynamic Lines
The indicator also marks swing high and low points, helping visualize dynamic support and resistance levels and potential price reversal areas.
📈 Signal Interpretation
BUY signals:
Occur when price breaks a demand zone or bearish structure, while trend filters (Supertrend / PSAR) confirm bullish direction.
SELL signals:
Trigger when price breaks a supply zone or bullish structure, with bearish confirmation from the trend filters.
These conditions can be further validated by visual confirmations from the Keltner Channel or a color change in the linear regression.
Script protegido
Este script se publica como código cerrado. Sin embargo, puede utilizarlo libremente y sin limitaciones: obtenga más información aquí.
mariovr_usd
Exención de responsabilidad
La información y las publicaciones que ofrecemos, no implican ni constituyen un asesoramiento financiero, ni de inversión, trading o cualquier otro tipo de consejo o recomendación emitida o respaldada por TradingView. Puede obtener información adicional en las Condiciones de uso.
1 comentario
