Trend Trader Buy/Sell SignalsTrend Trader
The code is open source, what it uses to print signals is MACD cross and ADX. Bar colors change in relation to where price is according to the 50 day MA. The MA ribbon is used for visualizing trend and using it for dynamic support/resistance. The ribbon is comprised of the 50 day and 100 day MAs.
Main reason to publish this script is because some like to jumble up scripts together slap some moving averages on it to "follow trend" and then label it an algorithm, market it and sell it to people online. No single system will work 100% of the time, do you due diligence in anything you are interested in buying. Plenty of free scripts in the TV library that can do you justice when trading.
P-signal

Bjorgum Triple EMA Strat-This script uses a triple EMA strategy to establish trend direction and reversal points
-Inputs are smoothed with Heiken Ashi values to reduce whipsaws, while providing timely execution
-Buy and sell indications are dictated by bar color
-Bar color is dictated by the candle close value in relation to the EMAs, specifically the faster of the 3
(If candle closes above or below the fast and intermediate averages, a buy or sell signal is indicated by bar color change)
-If the close falls between the two a cautionary signal is given. The viewer can hold, or take profit, or evaluate other indicators for clues
-Best results are obtained when coupled with Bjorgum TSI and Bjorgum RSI for confirmation of signals (see TradingView profile)
@Bjorgum on Stocktwits

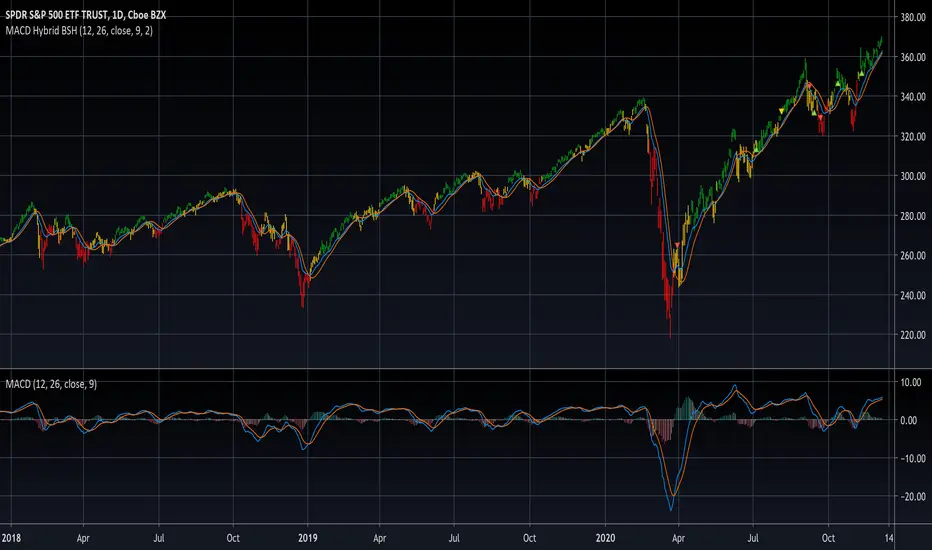
MACD Hybrid BSHMACD = Moving Average Convergence and Divergence
Hybrid = Combining the two main MACD signals into one indicator
BSH = Buy Sell Hold
This indicator looks for a crossover of the MACD moving averages (12ema and 26ema) in order to generate a buy/sell signal and a crossover of the MACD line (12ema minus 26ema) and MACD signal line (9ema of MACD line) in order to generate a completely seperate buy/sell signal. The two buy/sell signals are combined into a hybrid buy/sell/hold indicator which looks for one, neither, or both signals to be "buys." If both signals are buys (fast crossed above slow), a "buy" signal is given (green bar color). If only one signal is a buy, a "hold" signal is given (yellow bar color). If neither signal is a buy, a "sell" signal is given (red bar color). Note: MACD moving averages crossing over is the same thing as the MACD line crossing the zero level in the MACD indicator.
It makes sense to have the MACD indicator loaded as a reference when using this but it isn't required. The lines plotted on the chart are the 12ema and a signal line which is the MACD signal line shown relative to the 12ema rather than the MACD line. The 26ema is not plotted on the chart because the chart becomes cluttered, plus the moving averages crossing over is indicated with the MACD indicator.
This indicator should be used with other indicators such as ATR (1), RSI (14), Bollinger bands (20, 2), etc. in order to determine the best course of action when a signal is given. One way to use this as a strict system is to take a neutral cash position when a yellow "hold" signal is given, to go long when a
green "buy" signal is given, and to go short when a red "sell" signal is given. It can be observed that for many tickers and timeframes that green-yellow-green and red-yellow-red sequences are stronger signals than green-yellow-red and red-yellow-green signals.
Note: Chart type must be "bars" in order for the bar colorization to work properly
Bollinger Band Crossover SignalI'm a little surprised I couldn't find a BB crossover script on here since I've always used it on other charting software. So of course I had to write one in for TradingView.
Essentially what this script signifies are price breakouts when price crosses over the upper BB band. So what it shows is that market conditions are entering overbought territory.
Length is set to 20 and Standard Deviation is set to 2. These are the default settings.
The way I use the script is to identify breakouts in price, as well as a signal to start scaling out of a position if I am already in one.

piphunter sspiphunter ss the latest indicator in the pip hunter suite its single aim is to combine important trend analysis from multiple time frames and display the estimated direction of price based off that multi-timeframe analysis
the multi-timeframe analysis is done with a series of modified SSL channels taking data from 4 different time frames and then assimilating that with a pair of moving averages periods then through a series of calculations using those 2 moving averages gives you a signal line and what we call the bacd line when they cross it signifies a new trend direction to enable entry and exit points in a lower time frame whilst still respecting the overall trend from higher time frames
things that this displays
- symbol above or below candles when multiple time frames line up in the same direction and confirmed with the integrated maths mentioned above
- recoloured candles when an overbought or oversold condition is met
This is best used with the rest of the pip hunter package for more info on getting access to all indicators in the package. Please message me for more information.

Logistic EMA w/ Signals by DGTLogistic Map Equation - The logistic map connects fluid convection, neuron firing, the Mandelbrot set and so much more.
This study is an attempt to apply Logistic Map Equation in Trading
Logistic Map Equation
Xn+1 = r * Xn * (1 - Xn)
Where,
r - growth rate
Xn - percentage of theoretical maximum of measured event (from 0 to 1)
(1 - Xn) - represents constraints of the environment, presents the idea of negative feedback
For trading the measured event will be the price of the instrument (price is commonly reffered as source in mathematicall forumlations),
hence
r - growth rate can be expressed as => change(source, length) / source, expressing r in such manner mades the equation dynamic with regards to the growth rate
Xn - percentage of theoretical maximum of the price for given duration can be expressed as => source / highest(length)
Putting pieces together we are ready to plot
Printed alone does not seem to provide much useful visualization for trading, in fact not easy to interpret especially when the market is an uptrend
What it has numerically,
Provides a ratio, where sudden changes are much more reflected thanks to negative feedback nature of the logistic equation.
As we know moving average indicators are lagging and the logistic map may fit here to reduce the lag
With this study you will find application of Logistic Map Equation with combination of Exponential Moving Average (EMA)
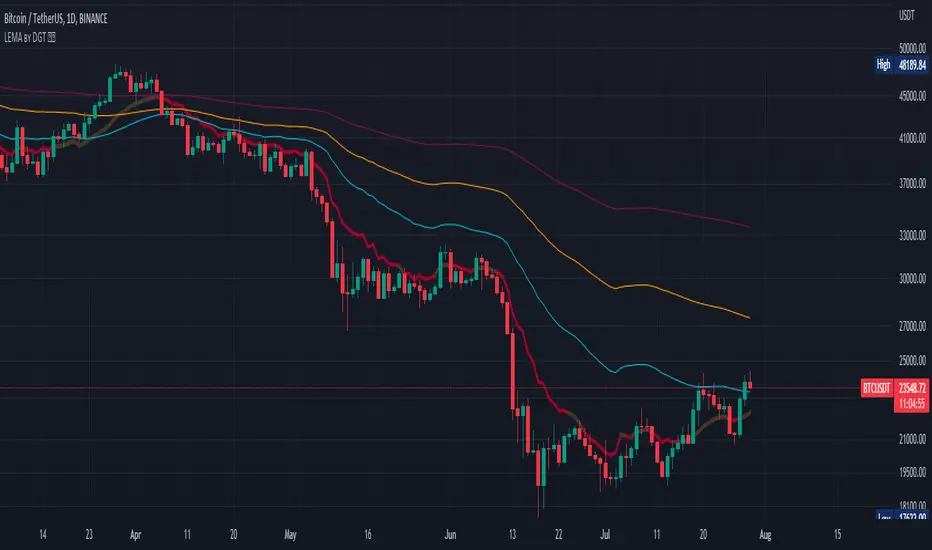
Logistic EMA (LEMA) and LEMA COLORS
one line with user defined periods of length, where the colors of the line will change automatically depending where the value is compared to 50-100-200 moving average
Multiple LEMAs : optional – three fixed lenght of 50-100-200 period lines
LEMA Signals
Various signals are added by using LEMA and applying some common market approaches. Use with caution and with conjunction of other indicators
Thanks to @allanster for the idea
A fascinating YouTube video explaining the logistic map - “This equation will change how you see the world (the logistic map)”
Disclaimer:
Trading success is all about following your trading strategy and the indicators should fit within your trading strategy, and not to be traded upon solely
The script is for informational and educational purposes only. Use of the script does not constitute professional and/or financial advice. You alone have the sole responsibility of evaluating the script output and risks associated with the use of the script. In exchange for using the script, you agree not to hold dgtrd TradingView user liable for any possible claim for damages arising from any decision you make based on use of the script
CCI & EMA_CROSS_PaydarCCI & EMA_CROSS_Paydar
Hello everyone
This indicator is actually a very efficient oscillator,
This system is a unique combination of indicators CCI and EMA, which of course has special settings, these settings are adjusted as much as possible due to signaling.
As you can see in the picture:
CCI: the two colors line, green and red, are actually the same indicator CCI that I set to 20.
*Note that in index CCI I have set the lines +100 and -100 to +75 and -75 for less error and a stronger signal to sell or buy.
EMA: The white line, which is in the form of steps, is in fact the same indicator of EMA, which I have considered as a value of 9.
_________________________________________________________________________________________________________
Instructions
-> areas:
Zone +75 to +200 = positive range or incremental price or bullish
Zone +75 to -75 = Neutral range or almost constant price (no fluctuations or very wet fluctuations)
Zone -75 to -200 = single range or discount price or bearish
->How to use:
Buy = In the bearish range, if line CCI intersects line EMA upwards and goes to the neutral zone.
None = if the index (or index lines) collide in the neutral zone
Sell = In the bullish range, if line CCI intersects line EMA down and goes to the neutral zone.
-> Please comment on this system or if you have a good experience in changing the values of the indicators or it seems to you, please share.
With great respect to:
Who had published the main idea of this system.

ADOL_Scouter(아돌 스카우터)/////////////////////////////////////////////////////////////////////////////////////////////////////////////////////////
ADOL_Scouter(아돌 스카우터)
current version : signal ver1.5
history))
// 2020.09.13.ver1.0 Long / Short / Branch signal
// 2020.09.16.ver1.1 or higher transaction volume detector banker function added
// 2020.09.18.ver1.2 Addition of trend indication button of multi time frame
// 2020.09.27.ver1.21 Changed the breakpoint -> minutes to improve readability
// 2020.09.28.ver1.3 Auto support / resistance line added
// 2020.09.29.ver1.4 Auto trend line added, core manual (trading method standard included) significantly added
// 2020.09.30.ver1.41 Long / short signal readability improvement code added, branch point color (orange -> purple) changed
// 2020.09.31.ver1.5 setup rule added
// Scheduled to be updated continuously
this is trading tool. This is a continuous update possible version.
It is not provided for free. This is a pro version. A tool made for trainees.
The pro version and the general version are updated at a time difference.
Pro features may not be reflected in the general version.
Please use ver1.0 (updated to ver1.21) for the general version.
(Access rights for the free version are required. Available immediately upon request)
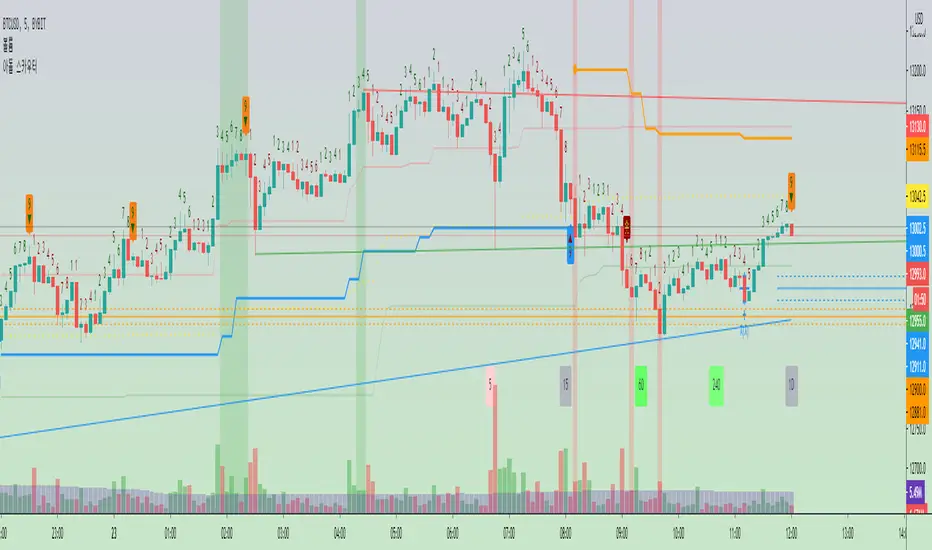
- indicated long/short position
- Inflection point(ornge square) you need to study about loss cut and lnflection point.
- yellow is trend middle line
- upper line/under line : option
- add to alert condition.
★ Basic Signal Rules Guide)
-"Signal recommendation time frame: 5-15 minute bar = single hit, 1 hour bar (or more) = swing"
-"Long: Long Signal // Short: Short Signal // Minute: Branch // Signal Enter after closing price"
-"General rule: Long-minute-short-minute-long-minute-short-minute-long-minute-short // Follow'basic use'."
-"Special rule: Cross-appearance of long shots without a branch point // Swipe or a strong trend."
-"Long/Short'Basic Use': Enters according to basic signals.
In the overbought/oversold section, the entry of the opposite position signal is approached as a rebalancing strategy.
The fingertips go against the flow of the candle and catch it at the starting end of the wave."
-"Branch Point'Basic Use': Use as a liquidation (recommended) spot when a branch appears after entering a long/short position.
A fork indicates the possibility that the direction of the trend can change.
Thus, the location of the fork may be near the (short-term) high/low."
- Partial disclosure
trading method 1) Trend line synthesis strategy (filtering 1)
: 1. Draw up and down trend lines. 2. Signals that occur before/after the trend line act strongly.
This allows you to select pass or entry.
trading method 2) focus 70 strategy
Pro version access code: When sending a PM message. If acquiring access key, it is provided permanently indefinitely.
/////////////////////////////////////////////////////////////////////////////////////////////////////////////////////////
ADOL_Scouter(아돌 스카우터)
현재버전 : 시그널 ver1.5
history))
// 2020.09.13.ver1.0 롱/숏/분기점 시그널
// 2020.09.16.ver1.1 이상 거래량 감지기 뱅커기능 추가
// 2020.09.18.ver1.2 멀티타임프레임의 추세표기 버튼 추가
// 2020.09.27.ver1.21 가독성 향상을 위해 분기점->분 표기변경
// 2020.09.28.ver1.3 오토 지지/저항선 추가
// 2020.09.29.ver1.4 오토 추세선 추가, 설명서(매매법 기준 수록)기능 대폭 추가
// 2020.09.30.ver1.41 롱/숏 시그널의 가독성 향상 코드 추가, 분기점 컬러 (오렌지->퍼플) 변경
// 2020.09.31.ver1.5 셋업 규칙 추가
// 지속업데이트 예정
이것은 매매도구입니다. 이것은 지속 업데이트가 가능한
프로버전으로 무료 제공되지 않습니다. 교육생을 위해 만든 도구입니다.
프로버전과 일반버전은 시간차를 두고 버전 업데이트가 이루어집니다.
프로기능이 일반버전에 반영되지 않을 수 있습니다.
공개된 일반버전은 ver1.0(ver1.21까지 업데이트)을 사용하십시오.
(무료버전의 엑세스 권한이 필요합니다. 요청시 즉시 사용가능)
- 롱/숏의 진입점을 표시합니다.
- 차트의 방향을 결정짓는 변곡점에 대한 분기점을 설정합니다.
- 손절가 및 분기점의 사용법에 대해서는 강화된 학습이 필요합니다.
- 트렌드의 중심선을 구현하였습니다.)
- 상/하단선은 옵션으로 사용할 수 있습니다.
- 얼러트 기능이 추가되었습니다.
★ 기본 시그널 규칙 가이드)
- "시그널 추천 타임프레임 : 5-15분봉 = 단타, 1시간봉(이상) = 스윙"
- "롱 : 롱시그널 // 숏 : 숏시그널 // 분 : 분기점 // 시그널 종가확정후 진입"
- "일반규칙 : 롱-분-숏-분-롱-분-숏-분-롱-분-숏 // '기본활용'을 따릅니다."
- "특수규칙 : 분기점없이 롱숏의 교차출현 // 휩쏘나 강한추세를 뜻합니다."
- "롱/숏 '기본활용' : 기본적인 시그널에 따라 진입합니다.
과매수/과매도 구간에서 반대포지션 시그널의 진입은 리벨런싱 전략으로 접근합니다.
손절가는 캔들의 흐름을 거슬러 눌림목, 파동의 시작끝점에 잡습니다."
- "분기점 '기본활용' : 롱/숏 포지션 진입 후 분기점 출현시 청산(추천)자리로 활용합니다.
분기점은 추세방향이 바뀔 수 있는 가능성을 의미합니다.
따라서, 분기점 위치는 (단기)고점/저점 부근이 될 수 있습니다."
- 일부공개
매매법1) 추세선 합성 전략(필터링1)
: 1. 상승,하락 추세선을 그리십시오. 2. 추세선 전/후에 발생하는 시그널은 강력하게 작용합니다.
이를 통해 진입을 선택/패스 할 수 있습니다.
매매법2) focus70 전략과 함께 사용하십시오.
프로버전 접근코드 : ↓↓↓↓↓ PM 메시지 보내기, 엑세스키 획득시 무기한 영구제공 됩니다.
Pro version access code: When sending a PM message. If acquiring access key, it is provided permanently indefinitely.
/////////////////////////////////////////////////////////////////////////////////////////////////////////////////////////
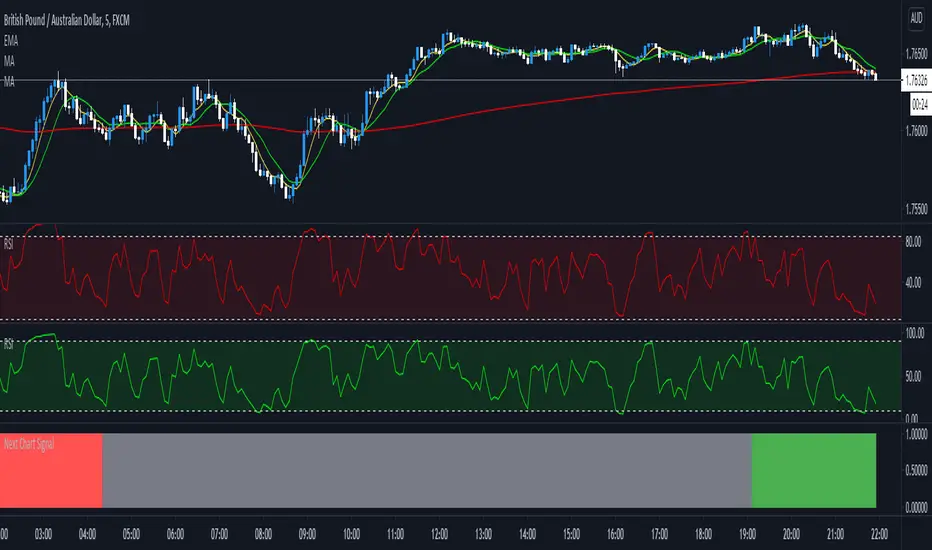
Next Chart SignalGives you the signal when 3 MA's are crossing from the higher time frame above the current chart.
PT Buy Sell IndicatorVersion 1.0 of our Buy & Sell indicator helps determine when a time-frame is ready for a possible reversal. The indicator is primarily based on the movement & behavior of the RSI. We recommend using the indicator on Binance exchange (USDT) with H1, H2, H3 & H4 time frames. We have put together a video with a strategy on how to take the signals best. Please watch the video to understand how to use it. You can also ask us questions in our discord to better understand the indicator.
There are currently two different settings that come with the indicator. Our aggressive & standard toggle each offer various set of signals.
- Aggressive toggle: more signals throughout multiple time-frames. Recommended for the more advanced traders that can combine technical analysis with their setups. Best time-frame H3, H4 & H12. (Use Reduce Signal Threshold input #7+)
- Standard toggle: fewer signals with a bit less risk. Recommended for traders that are just starting. Best time-frame 15m, 30m, H1, H2, 3D & 5D (Use Reduce Signal Threshold input #4)
The buys & sells are not in-sync with each other. They tend to fire independently when the specified time-frame is ready for a possible reversal.
The most successful method we structured for the buy/sell indicator is combining the PT STx & the PT Top/Bottom Bands (both included in our library). The PT Top/Bottom Bands helps you gauge the closest trouble area. When signals fire, we look at our top/bottom band indicator to find an entry as close to support/resistance as possible. The bands are isolated & color-coordinated.
Red Band - Overbought zone
Gray Bands - Within the range
Orange Band - Our EQ (middle of the range)
Green Band - Oversold zone
This eliminates the guessing game that invalidates your trade setup. The best risk to reward is taking sell signals (shorts) as close to the red band while targeting the orange band (eq) & taking buy signals as close to the green band while targeting the orange band (eq).
There are four different inputs that you can tweak to cater to your trading style. Each input is customizable based on the time frame. We get into detail about this in our video. Watch the video & do not take signals blind!
The secret sauce to having the highest success rate is to take the signals only when the PT STx (included in our library) has fired its algorithm.
This is an invite-only script. Please message us for access to our whole library.
As we keep making progress with our indicators, you will be granted access to each of them as long as you are a Pattern Trader member!
There will be limited access to our library until version 2.0 is released.

OnePunch Swinging Buy and SellPersonal use only
Script Combination of
- Determining High and Lows
- Buy and Sell signal

Rockstar Long Take profit flagFlag to indicate a good time to consider taking profit if you are in a long position.
The indicator will show a green diamond in an uptrend where the price is overbought and could pull back.
Conditions for flag:
Price above 20MA
20MA above 50MA
50MA above 200MA
RSI > 70
Close price is far from 20MA (about to pull back and overbought)
All inputs configurable in the settings for the indicator.
Please do not trade based on indicators alone. Use your strategy and be careful!

Bull/Bear Probability [Anan]Hello Friends,,,
===================================
This indicator is based on Bayes' Theorem and is fully based on probabilities.
===================================
Formula For Bayes' Theorem:
P(Bull|Bear) = P(Bear∣Bull) * P(Bull) / P(Bear)
where:
Bull and Bear are events and P is probability
P(Bull|Bear) is the posterior probability, the probability of Bull after taking into account Bear
P(Bear∣Bull) is the conditional probability or likelihood, the degree of belief in Bear given that proposition of Bull belief (Bull true)
P(Bull) is the prior probability, the probability of Bull belief
P(Bear) is the prior probability, the probability of Bear belief
===================================
The indicator output 2 trend lines and (Bull/Bear) Signal :
Bull/Bear Probability Trend :
when the price is above it = Up Trend
when the price is below it = Down Trend
Bull/Bear Probability Trend Moving Average :
when the price is above it = Up Trend
when the price is below it = Down Trend
(Bull/Bear) Signal :
when Probability Trend Moving Average crossover Probability Trend = Bull Signal
when Probability Trend Moving Average crossunder Probability Trend = Bear Signal
===================================
Disclaimer:
This script is for informational and educational purposes only.
Use of the script does not constitutes professional and/or financial advice.
You alone the sole responsibility of evaluating the script output and risks associated with the use of the script.
===================================
Thanks to my friends dgtrd because he inspired me about probability, take a look at his scripts.
===================================

EARNING FANDA TRADING SIGNALThis Indicator will give buy and sell signal based on modified trend analysis.
This Indicator is Modified and Better Version of trading signal, which will give you less but better signals
Buy and Sell only on bar / candle close.

Candlestick Pattern IdentifierMy script builds upon another user-submitted script by rebuilding the logic used to identify candlestick patterns. The logic in my script is a mix of strict and lax guidelines to mitigate false flags and present valid buy and sell signals.
-To use this indicator, simply add it to any chart. It will identify trends on any time frame although the lower you go, the more signals you'll see and the higher probability of those signals being false flags. You can also disable any candlestick patterns that you feel are not as useful.
- This indicator works best with Stocks and also with Forex markets to a lesser extent.
- This indicator works the best on the Daily chart and also works (with varying degrees of success) on any timeframe at or above 1 hour. I've found that this indicator works the best when used in tandem with the Daily and Hourly charts with the Hourly chart being used to determine an entry point while the Daily chart is used for long term trend analysis.

Smart Forex Buy Sell Signal by LukasHi again!
So, this is BUY and SELL signal base on Price action, RSI, and Correlation between Forex Major Pairs.
It's only work for Forex Major Pairs because I only took their data.
Included alert : Spec, Buy, Strong
Recommended to wait for double signal :
Spec Buy > Buy or Spec Sell > Sell
Buy > Strong Buy or Sell > Strong Sell
So execute after the second signal triggered.
It's indicate the trend.
Looking forward for your feedback to improve the script.
Thank you.
It's better combine it with Moving average indicator to indicate direction, I use Moving Average Adaptive Q from cheatcountry to help me make decision.

Forex Trend Buy Sell Signal by LukasHello,
This is Forex Buy and Sell indicator, Signal line cross up blue line = Buy, cross down = Sell
Above Yellow line = Uptrend, Looking for Buy only, vice versa.
Only works on Major Pairs.
Calculate price strength and momentum.
Hope you guys like it.
Cheers
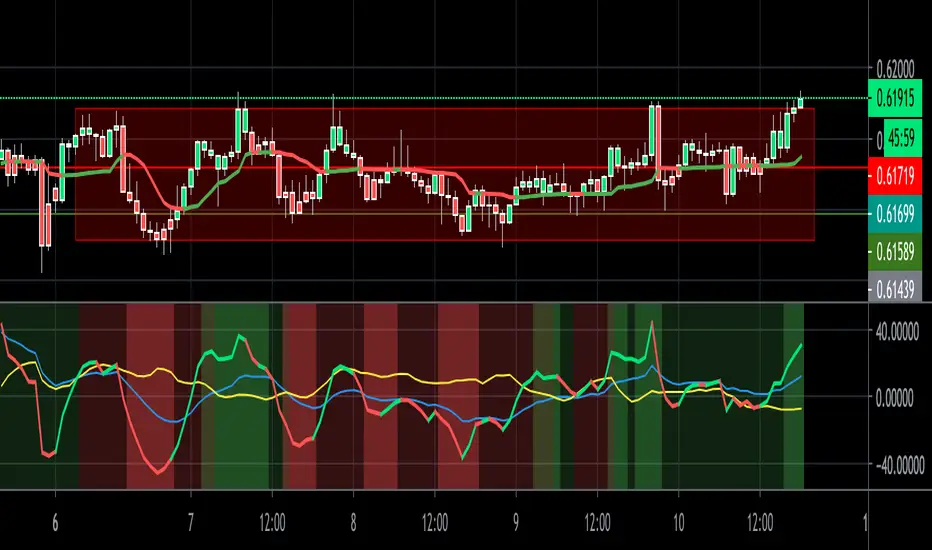
RSI with Bollinger Bands Binary system by Hashtag_binaryRSI with Bollinger Bands is binary options high/low trading system based on the volatility.
- Time frame 30min - 1H
- Expiry time 2 candles
- Markets: Forex currency pairs majors: EUR/USD, USD/CHF, GBP/USD, AUD/USD, NZD/USD, EUR/JPY, USD/JPY, AUD/JPY
Rules for RSI with Bollinger Bands Binary system
- Do not start before the economic news
- We wait for the price to eitherhit the lower bollinger band or the upper bollinger band and the moment this happens we take the trade immediatly.
Buy Put:
If the price touches the lower Bollinger band we and RSI is below the 30 we take a put.
Buy Call:
If the price touches the upper Bollinger band we and RSI is above the 70 we take a call.

MACD Binary Strategy by Hashtag_binary MACD Binary Options Strategy is an trend momentum system, It's based on the double MACD in the sub window below the chart.
- Markets: Stocks, Indicies, Metals, Forex. This binary strategy works good on the Indicies ( S&P 500, DAX, FTSE, ).
- MACD Binary System il also good as trading system for to trade.
- Time Frame 30 min or higher ( best 4H).
- Expires Time 3 bars after. (90 min, 180 min, 720 min, 3 daily).
Rules MACD Binary Options Strategy
Buy Call:
- EMA 6 over EMA 13;
- MACD ( 5, 15, 1) crosses upward MACD ( 12,26,1 );
- MACD (5,15, 1) over level 0.
Buy Put:
- EMA 6 under EMA 13;
- MACD ( 5, 15, 1) crosses downward MACD ( 12,26,1 );
- MACD (5,15, 1) under level 0.
The same conditions for entry trade.
Exit position options:
- When MACD (5, 15, 1,) crosses in opposite direction MACD (12,26,1);
- When exponential moving average crosses in opposite direction;
- Make profit with ratio 1:3 stop loss.
- Initial stop loss at the previous swing.

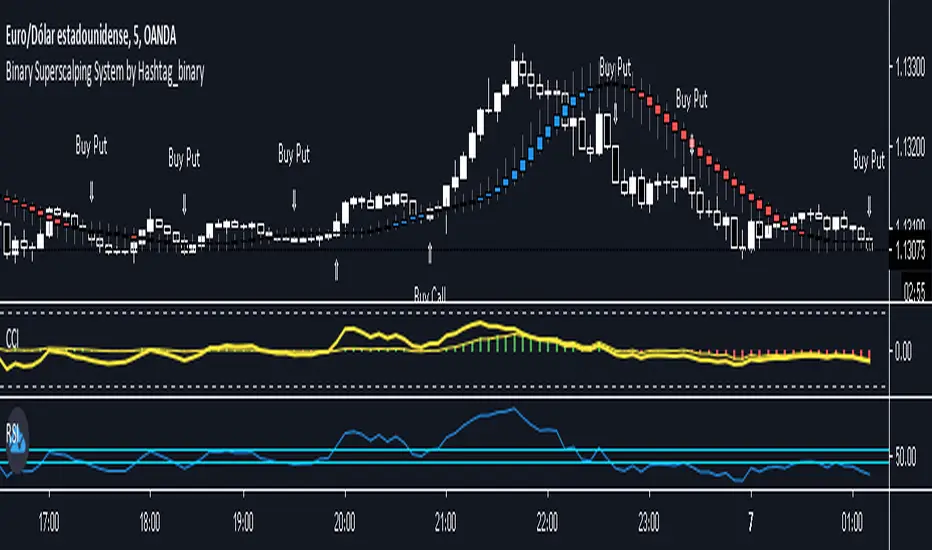
Binary Superscalping System by Hashtag_binaryBinary Superscalping Systyemis a trend momentum strategy designed for scalping and trading with binary options. This trading system is very accurate with the 80% profitable trades.
- Markets: Forex (EUR/USD, GBP/USD, AUD/USD, USD/CHF, USD/CAD, NZF/USD, USD/JPY,) Indicies (S&P500, Dow Jones, DAX, FTSE100) and Gold.
- Time Frame 5 min, 15min, 30min.
- Expiry Time (4-6 candles).
Buy Call or Buy:
- Trend CCI (170) crossed the zero line upwards (green bar >0);
- Entry CCI (34) crosses upward the zero line ;
- RSI (Relative Strength Index) indicator value is greater than 55 level;
- Heiken Ashi Smoothed indicator is color blue (optional).
Buy Put or Sell
- Trend CCI (170) crossed the zero line downwards (red bar <0);
- Entry CCI (34) crosses downward the zero line ;
- RSI indicator value is lower than 45 level;
- Heiken Ashi Smoothed indicator is color red (optiona).
Exit position for Scalping options:
- Entry CCI (34) crosses in opposite direction trend CCI (170),
- Profit Target:5 min time frame 7-10 pips, 15 min time frame (9-14 pips), 30 min time frame (15- 18 pips).
- Make Profit at fibopivot levels.
- Initial stop loss on the previous swing.
ADX signal Binary Options System by Hashtag_binary ADX signal Binary Options System is amanual trading system trend-momentum high/low. This system is still really interesting to use for binary options and trading without binary.
- Time Frame 15 min or higher.
- Expiry time 2-4 candles.
- Markets: Forex (Currency pairs: Majors; Index: S&P 500, Dow Jones, DAX, FTSE).
Trading rules ADX signal Binary Options System
Buy call:
1. The Moving Average line (14) is above others two Moving Averages (60 and 100 red and magenta line).
2. The TrendSignal Bar first subwindow indicator with bar green.
3. Stochastic is above 50 level.
4 If the previous conditions are agree when appear ADX green arrow you can enter buy call.
Buy Put:
1. The Moving Average line (14) is below others two Moving Averages (60 and 100 red and magenta line).
2. The TrendSignal Bar first subwindow indicator with bar red.
3. Stochastic is below 50 level.
4. If the previous conditions are agree when appear ADX red arrow you can enter buy put.
Exit position for trading without binary
Time Frame H1 and 30 min place trailing stop 15 or 20 pips, 4H time frame place trailing stop 30-40 pips depends by currency pairs.
Initial stop loss on the previous swing High/Low.

Directional Movement IndexThis is a standard ADX DMI indicator with Background colour and the option to draw the Background colour of the next higher timeframe.

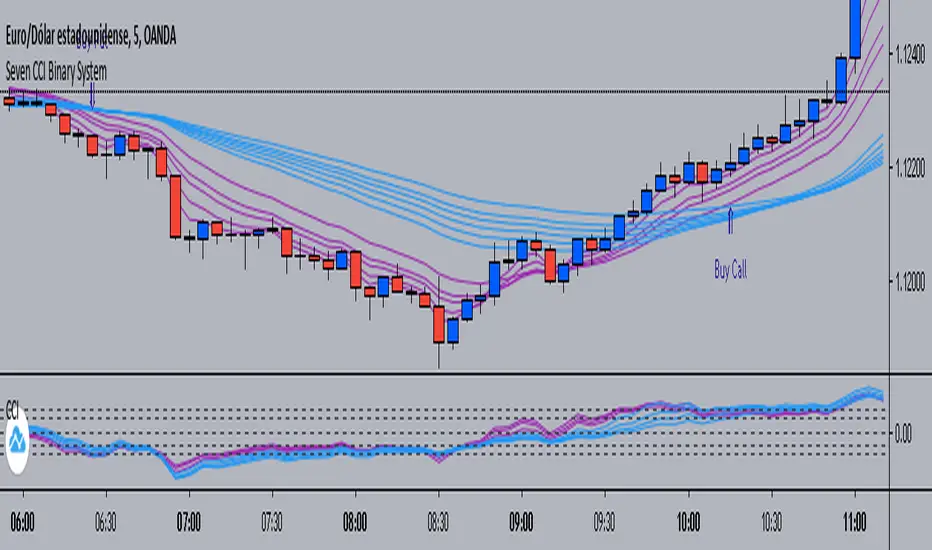
Seven CCI Binary System by Hashtag_binarySeven CCI binary system is trend-momentum strategy based on CCI and exponential moving averages. This trading system is also good for scalping and intraday trading.
Rules for Binary Options:
- Time Frame 5 min or 15 min.
- Expiry time 4-5 candles.
- Trades only in trend.
Buy Call:
- EMA's lines color magenta above EMA's lines color blue;
- CCI lines color magenta are above CCI lines color blue and zero level.
- When thes conditions are agree buy call at opening of the next bar.
Buy Put:
- EMA's lines color magenta below EMA's lines color blue;
- CCI lines color magenta are below CCI lines color blue and zero level.
- When thes conditions are agree buy put at opening of the next bar.
Scalping:
-Time Frame 5 min, 15min.
- Currency Pairs: EUR/USD, GBP/USD, AUD/USD, USD/CHF, USD/JPY.
- The rules for buy and sell are the same.
- When the price is within the bundle of the moving averages do not trade.
Exit position
- Make Profit on the pivot points levels or with fast profit target.
- Initial stop loss on the previous swing price.