ORB Pro - NY Opening Range Breakout [Elev8+]**ORB Pro - NY Opening Range Breakout ** is a comprehensive, professional-grade toolkit designed for intraday traders who rely on the **Opening Range Breakout (ORB)** strategy.
Unlike standard ORB indicators that simply draw lines, this suite offers a complete dashboard-driven system that monitors **four distinct sessions** simultaneously, providing real-time status updates and precision alerts.
### 🎯 What is the Opening Range Breakout (ORB)?
The Opening Range is the price range established during the first period of the trading session (e.g., the first 15 or 30 minutes). This period represents the initial balance between buyers and sellers. A breakout from this range often signals the likely trend direction for the remainder of the session.
### 🚀 Key Features
**1. Multi-ORB Monitoring**
Stop switching settings constantly. This suite monitors four key ranges at once:
* **Pre-Market 15m** (08:00 – 08:15 ET)
* **Pre-Market 30m** (08:00 – 08:30 ET)
* **NY Cash Open 15m** (09:30 – 09:45 ET)
* **NY Cash Open 30m** (09:30 – 10:00 ET)
**2. Smart Status Dashboard**
A compact panel in the bottom-right corner gives you the live state of every session:
* **⏳ Waiting:** The session has not started yet.
* **⚡ Forming:** The range is currently being built.
* **↔️ Range:** The range has formed, but price is still contained within the range.
* **🚀 BULL / 📉 BEAR:** A confirmed breakout has occurred.
* **⛔ OFF:** The session is disabled in settings.
**3. "Dynamic Resolution" Technology**
This is a unique pro feature.
* **Precision:** The script *always* calculates the High/Low levels using 1-minute data, ensuring your support/resistance lines are pixel-perfect regardless of your chart timeframe.
* **Flexibility:** Breakout signals (Alerts/Labels) are triggered based on your *current* chart timeframe. This allows you to trade a 5m or 15m breakout strategy while keeping 1m-level precision on your levels.
**4. Visual Clarity**
* **Breakout Labels:** Automatically plots "BULL" or "BEAR" labels on the exact candle that confirms a breakout.
* **Profit Targets:** Optional toggle to show 1x and 2x profit targets projected from the breakout level.
* **Time-Bound Signals:** Signals are strictly time-bound to the active window to prevent late, low-quality alerts.
### 🛠️ How to Use
1. **Add to Chart:** Works best on intraday timeframes (1m, 5m, 15m).
2. **Configure:** Enable the sessions you trade (e.g., NY 15m) in the settings.
3. **Wait for Forming:** Watch the box form live. The dashboard will show "⚡ Forming".
4. **Trade the Break:** Wait for a candle **Close** outside the range. The dashboard will flip to "BULL" or "BEAR" and a label will appear.
5. **Manage Risk:** Use the opposite side of the range or the midline as your stop loss.
### ⚙️ Settings Overview
* **Global Settings:** Toggle forming boxes, dashboard, and label visibility.
* **Breakout Method:** Choose between **Close** (safer) or **Wick** (aggressive) for signal triggers.
* **Session Groups:** Individually enable/disable the 4 distinct sessions and customize their colors/styles.
---
*Disclaimer: This tool is for educational and analytical purposes only. Past performance of a strategy does not guarantee future results. Always manage your risk.*
Orb

SNIPER ORB V3# 🎯 SNIPER ORB TRADING CHEAT SHEET
## Quick Reference Guide for Live Trading
---
## 📊 VISUAL IDENTIFICATION GUIDE
```
═══════════════════════════════════════════════════════════════════
YOUR CHART AT A GLANCE
═══════════════════════════════════════════════════════════════════
🔵 BRIGHT BLUE LINES (3px) → 5min ORB High/Low
🔷 CYAN LINES (2px) → 15min ORB High/Low
🟣 PURPLE LINES (2px) → 30min ORB High/Low (PRIMARY)
🟢 GREEN DASHED LINES (1px) → Upside targets (1x, 2x, 3x from 30min ORB)
🔴 RED DASHED LINES (1px) → Downside targets (1x, 2x, 3x from 30min ORB)
🟡 GOLD LINE (2px) → Anchored VWAP (9:30 AM anchor for NY, 3:00 AM for London)
📋 INFO TABLE (top-right) → Shows live ORB ranges, VWAP price, status
═══════════════════════════════════════════════════════════════════
```
**KEY DIFFERENCE FROM OTHER ORB INDICATORS:**
- You see **ALL 3 ORB PERIODS SIMULTANEOUSLY** (5min, 15min, 30min)
- Targets calculated from **30min ORB ONLY** (not 5min or 15min)
- **NO BOX FILLS** - clean line-only display for sniper precision
- Auto-disappears at session end (no clutter from old sessions)
---
## 🔘 NEW FEATURE: ORB DISPLAY TOGGLES
**You now have FULL CONTROL over which ORB periods to display!**
```
In indicator settings → "ORB Display" section:
☑ Show 5min ORB → Toggle blue lines ON/OFF
☑ Show 15min ORB → Toggle cyan lines ON/OFF
☑ Show 30min ORB → Toggle purple lines ON/OFF
USE CASES:
━━━━━━━━━━━━━━━━━━━━━━━━━━━━━━━━━━━━━━━━━━━━━━━
1. FOCUS MODE (30min only)
☐ 5min ☐ 15min ☑ 30min
→ Clean chart, just your primary trading range
→ Best for beginners or minimalist traders
2. EARLY WARNING MODE (5min + 30min)
☑ 5min ☐ 15min ☑ 30min
→ See early breaks with 5min, trade 30min confirmation
→ Reduces visual noise from 15min
3. CONFLUENCE MODE (all 3 ORBs)
☑ 5min ☑ 15min ☑ 30min
→ Maximum information, all alignment signals
→ For advanced traders seeking highest probability
4. INTRADAY SCALP MODE (5min only)
☑ 5min ☐ 15min ☐ 30min
→ Ultra-fast entries on 5min breaks
→ High-risk, high-frequency approach
━━━━━━━━━━━━━━━━━━━━━━━━━━━━━━━━━━━━━━━━━━━━━━━
💡 PRO TIP: Start with 30min only, then add 5min/15min as you gain experience
```
---
## 🎯 FIXED: ANCHORED VWAP (TIMESTAMP-BASED)
**The VWAP now anchors with SURGICAL PRECISION to the exact session start candle!**
```
LONDON SESSION:
• Anchors at the EXACT 3:00 AM ET candle
• Uses timestamp checking: hour == 3 AND minute == 0
• Resets every morning at London Open
NEW YORK SESSION:
• Anchors at the EXACT 9:30 AM ET candle
• Uses timestamp checking: hour == 9 AND minute == 30
• Resets every day at NY Open
WHAT THIS MEANS:
✅ VWAP starts accumulating from the first tick of the session
✅ No more "off by one bar" errors
✅ Institutional-grade VWAP anchoring
✅ Perfect alignment with your ORB start times
HOW TO VERIFY IT'S WORKING:
1. Load indicator on 1min or 5min chart
2. Find the exact 9:30 AM candle (NY) or 3:00 AM candle (London)
3. VWAP should START appearing from that exact bar
4. Not the bar before, not the bar after - THAT EXACT BAR
```
---
## ⏰ SESSION TIMING MATRIX
| Session | Start Time | 5min Complete | 15min Complete | 30min Complete | Session End |
|---------|-----------|---------------|----------------|----------------|-------------|
| **London** | 3:00 AM ET | 3:05 AM | 3:15 AM | 3:30 AM | 9:30 AM ET (disappears) |
| **New York** | 9:30 AM ET | 9:35 AM | 9:45 AM | 10:00 AM | 5:00 PM ET (disappears) |
**💡 GOLDEN RULES:**
1. **WAIT FOR 30MIN ORB TO COMPLETE** before trading targets (10:00 AM NY / 3:30 AM London)
2. Use 5min and 15min ORBs as **early warning signals** only
3. All ORB lines + VWAP **auto-delete** at session end (clean chart)
---
## 🎯 THE 3-ORB SYSTEM: HOW IT WORKS
### **Hierarchical ORB Structure**
```
TIME: 9:30 AM ─────────────────────────────────> 10:00 AM ──────> 5:00 PM
↓ ↓
SESSION START 30min ORB COMPLETE
(all 3 ORBs begin forming) (targets appear)
📍 5min ORB (9:30-9:35 AM): ━━━━━━━━━━━━━━━━━━━━━━━━━━━━━━━━━━━━━>
Purpose: EARLY breakout signal, fastest-moving boundary
📍 15min ORB (9:30-9:45 AM): ━━━━━━━━━━━━━━━━━━━━━━━━━━━━━━━━━━━━━>
Purpose: MID-TERM institutional reference level
📍 30min ORB (9:30-10:00 AM): ━━━━━━━━━━━━━━━━━━━━━━━━━━━━━━━━━━━━━>
Purpose: PRIMARY TRADING RANGE - all targets calculated from this
🎯 TARGETS (10:00 AM onward): ▪ ▪ ▪ ▪ ▪ (1x, 2x, 3x from 30min ORB)
Purpose: Profit-taking levels based on 30min range
```
**Why 3 ORBs Instead of 1?**
- **5min ORB**: Captures early institutional positioning (first 5 minutes)
- **15min ORB**: Confirms directional bias (more stable than 5min)
- **30min ORB**: Full market digestion of overnight news + opening orders
- **Confluence = Higher Win Rate**: When all 3 align, breakouts are extremely reliable
---
## 🎯 THE 5 HIGH-PROBABILITY SETUPS
### **SETUP #1: TRIPLE ORB BREAKOUT CONFLUENCE** ⭐⭐⭐⭐⭐
```
CONDITIONS:
✅ 30min ORB complete (10:00 AM NY / 3:30 AM London)
✅ Price breaks ALL 3 ORBs simultaneously:
• 5min high/low (blue line)
• 15min high/low (cyan line)
• 30min high/low (purple line)
✅ VWAP confirms direction (below price = bullish, above = bearish)
✅ Volume spike on breakout candle
ENTRY: Close of breakout candle (must close beyond ALL 3 ORBs)
STOP: Inside 30min ORB at 30m low (long) or 30m high (short)
TARGET 1: First green/red dashed line (0.5x 30m range)
TARGET 2: Second target (1x 30m range)
TARGET 3: Third target (1.5x 30m range)
WIN RATE: 75-85% | R:R = 1:2.5 minimum
NOTES: When all 3 ORBs align, institutional order flow is unanimous
```
---
### **SETUP #2: 5MIN EARLY BREAKOUT → 30MIN CONFIRMATION** ⭐⭐⭐⭐
```
CONDITIONS:
✅ Price breaks 5min ORB first (blue line crossed)
✅ 15min ORB holds initially (cyan line not crossed yet)
✅ After 30min ORB completes, price breaks 30min boundary (purple)
✅ VWAP alignment confirms direction
✅ All 3 ORBs now broken in same direction
ENTRY: When 30min ORB breaks (purple line) + 5min/15min already broken
STOP: 30min ORB opposite boundary
TARGET 1-3: Standard targets from 30min ORB
WIN RATE: 70-80% | R:R = 1:2+
NOTES: 5min gave early warning, 30min confirms institutional commitment
```
---
### **SETUP #3: FALSE 5MIN BREAKOUT → 30MIN REVERSAL** ⭐⭐⭐⭐⭐
```
CONDITIONS:
✅ Price breaks 5min ORB (blue line)
✅ Fails to break 15min or 30min ORBs (cyan/purple lines hold)
✅ Price reverses back inside 5min ORB
✅ Then breaks OPPOSITE side of 30min ORB (purple line)
✅ VWAP flips to confirm new direction
ENTRY: When 30min ORB breaks in OPPOSITE direction of failed 5min break
STOP: Failed 5min breakout high/low (now a liquidity grab zone)
TARGET 1-3: Standard targets
WIN RATE: 80-90% | R:R = 1:3+ (trapped traders forced to exit)
NOTES: Most profitable setup - 5min breakout was liquidity hunt
```
---
### **SETUP #4: TIGHT COMPRESSION → EXPLOSION** ⭐⭐⭐⭐
```
CONDITIONS:
✅ All 3 ORBs tightly overlapping (5m, 15m, 30m within 50 points on YM)
✅ Range < 0.3% of price (very tight consolidation)
✅ VWAP sitting in middle of compression
✅ 30min ORB complete, price still inside all 3
ENTRY: Simultaneous break of ALL 3 ORBs + VWAP cross
STOP: Middle of compression zone
TARGET: 2x-4x normal targets (volatility expansion)
WIN RATE: 65-75% | R:R = 1:5+ (explosive breakout)
NOTES: Low volatility → high volatility shift, institutions coiling spring
```
---
### **SETUP #5: VWAP BOUNCE WITHIN 30MIN ORB** ⭐⭐⭐⭐
```
CONDITIONS:
✅ Price stayed inside 30min ORB for 1+ hours post-formation
✅ VWAP acting as dynamic support (long) or resistance (short)
✅ Price bouncing between VWAP and 30min ORB boundaries
✅ Clear rejection candles at VWAP
ENTRY: When price bounces off VWAP toward 30min ORB boundary
• Long: VWAP bounce up toward 30m high (purple)
• Short: VWAP rejection down toward 30m low (purple)
STOP: Beyond VWAP by 20 points
TARGET: 30min ORB opposite boundary
WIN RATE: 70-80% | R:R = 1:1.5-2
NOTES: Range-bound play, NOT for breakout traders
```
---
## 🛡️ RISK MANAGEMENT RULES
### **Position Sizing by ORB Range**
```
30min ORB Range | Stop Distance | Risk $500 (1%) | YM Contracts
-----------------|------------------|-----------------|-------------
< 50 points | 50 pts | $500 ÷ $250 = | 2 contracts
50-100 points | 100 pts | $500 ÷ $500 = | 1 contract
100-150 points | 150 pts | $500 ÷ $750 = | 0.66 (use 1)
150-200 points | 200 pts | $500 ÷ $1000 = | 0.5 (use 1)
> 200 points | Don't trade | Too wide | Skip setup
Formula: Risk $ ÷ (Stop Distance × $5 per YM point) = Max Contracts
```
### **The 3-Strike Rule (MANDATORY)**
```
✅ Trade 1: Full position size (based on 30m ORB range)
❌ Stop hit → Trade 2: HALF position size
❌ Stop hit → Trade 3: QUARTER position size
❌ Stop hit → DONE FOR THE DAY (no exceptions)
```
### **Profit Taking Ladder**
```
TARGET 1 (0.5x 30m range): Take 50% off, move stop to breakeven
TARGET 2 (1.0x 30m range): Take 30% off, trail stop by 25 points
TARGET 3 (1.5x 30m range): Take 15% off, let 5% run with 50pt trail
```
---
## ⚠️ DO NOT TRADE IF...
```
🚫 30min ORB incomplete (< 10:00 AM NY / < 3:30 AM London)
🚫 30min ORB range < 40 points YM (too tight, likely chop)
🚫 30min ORB range > 250 points YM (too wide, unpredictable)
🚫 All 3 ORBs wildly divergent (5m=100pts, 15m=180pts, 30m=240pts)
🚫 Major news release within 30 minutes (wait for ORB to reform)
🚫 You've hit 3 losses in the session (3-strike rule)
🚫 You're tired, emotional, revenge trading, or distracted
🚫 Time > 12:00 PM ET (lunch, avoid until 1:00 PM)
🚫 Time > 3:00 PM ET unless Power Hour (3:00-4:00 PM) momentum
```
---
## 🔍 PRE-SESSION CHECKLIST
**15 Minutes Before London (2:45 AM ET) or NY (9:15 AM ET):**
```
□ Check economic calendar (FOMC? NFP? CPI? → extra caution)
□ Review previous session's ORB ranges (context for today's volatility)
□ Load SNIPER ORB on 1min or 5min chart
□ Select correct session: "London" or "New York"
□ Verify indicator settings:
• Number of Targets: 3
• Target % of 30min Range: 50%
• Show Anchored VWAP: ON
□ Set TradingView alerts:
• 30min ORB complete (10:00 AM or 3:30 AM)
• Price crossing 30min high/low
• VWAP crosses
□ Prepare bracket orders mentally (entry, stop, 3 targets)
□ Review yesterday's P&L and lessons learned
□ Set phone to "Do Not Disturb" mode
```
---
## 🎨 INDICATOR SETTINGS GUIDE
### **Core Settings (Updated with Toggles)**
```
SESSION SETTINGS:
━━━━━━━━━━━━━━━━━━━━━━━━━━━━━━━━━━━━━━━━
• Active Session: "London" or "New York"
ORB DISPLAY (NEW!):
━━━━━━━━━━━━━━━━━━━━━━━━━━━━━━━━━━━━━━━━
☑ Show 5min ORB (toggle blue lines)
☑ Show 15min ORB (toggle cyan lines)
☑ Show 30min ORB (toggle purple lines)
💡 Turn OFF any ORB to declutter your chart!
TARGET SETTINGS:
━━━━━━━━━━━━━━━━━━━━━━━━━━━━━━━━━━━━━━━━
• Number of Targets: 3 (default)
• Target % of 30min Range: 50% (default)
VWAP SETTINGS:
━━━━━━━━━━━━━━━━━━━━━━━━━━━━━━━━━━━━━━━━
☑ Show Anchored VWAP
• VWAP Color: Gold (#FFC107)
• VWAP Width: 2px
```
### **Color Customization (Optimized for Dark Charts)**
```
DEFAULT COLORS:
━━━━━━━━━━━━━━━━━━━━━━━━━━━━━━━━━━━━━━━━
5min ORB: Bright Blue (#2196F3) - 3px wide
15min ORB: Cyan (#00BCD4) - 2px wide
30min ORB: Purple (#9C27B0) - 2px wide
Upside Targets: Green (#4CAF50) - 1px dashed
Downside Targets: Red (#F44336) - 1px dashed
VWAP: Gold (#FFC107) - 2px solid
━━━━━━━━━━━━━━━━━━━━━━━━━━━━━━━━━━━━━━━━
WHY THESE COLORS?
• Blue family (5m/15m) = short-term, high-frequency
• Purple (30m) = primary, institutional level
• Green/Red = universal up/down
• Gold VWAP = fair value anchor (stands out)
```
### **Settings by Trading Style**
**BEGINNER (Clean & Simple):**
```
ORB Display:
☐ Show 5min ORB
☐ Show 15min ORB
☑ Show 30min ORB (30min only - focus mode)
Number of Targets: 2-3
Target % of 30min Range: 50%
Chart Timeframe: 5-minute
```
**SCALPER (5-15 min holds):**
```
ORB Display:
☑ Show 5min ORB (early signals)
☐ Show 15min ORB
☑ Show 30min ORB (confirmation)
Number of Targets: 5
Target % of 30min Range: 30-40%
Label Size: Tiny
Chart Timeframe: 1-minute
```
**DAY TRADER (30-90 min holds):**
```
ORB Display:
☑ Show 5min ORB
☑ Show 15min ORB
☑ Show 30min ORB (all 3 - confluence mode)
Number of Targets: 3
Target % of 30min Range: 50%
Label Size: Small
Chart Timeframe: 5-minute (RECOMMENDED)
```
**SWING TRADER (2-4 hour holds):**
```
ORB Display:
☐ Show 5min ORB (too noisy for swings)
☑ Show 15min ORB
☑ Show 30min ORB
Number of Targets: 2-3
Target % of 30min Range: 75-100%
Label Size: Normal
Chart Timeframe: 15-minute
```
---
## 📈 TIMEFRAME SELECTION GUIDE
| Your Timeframe | What You See | Best For |
|---------------|--------------|----------|
| **1-minute** | Every tick, high noise | Scalping, precision entries |
| **5-minute** | Balanced clarity | Day trading (RECOMMENDED) |
| **15-minute** | Clean structure | Swing positions |
| **30-minute** | Too compressed | Not recommended (can't see ORB form) |
**💡 PRO TIP:**
- **Primary chart: 5-minute** (for entries and monitoring)
- **Secondary chart: 1-minute** (for precise timing)
- **Never go above 15-minute** (ORBs won't form properly)
---
## 🧠 READING THE 3-ORB STRUCTURE
### **Bullish Alignment Patterns**
```
PATTERN 1: "Staircase Expansion"
5min: ━━━━ (tight, 60 pts)
15min: ━━━━━━ (wider, 90 pts)
30min: ━━━━━━━━ (widest, 120 pts)
→ Bullish expansion, expect upside breakout
PATTERN 2: "Nested Compression"
5min: ━━ (30 pts)
15min: ━━━ (35 pts)
30min: ━━━━ (40 pts)
→ All tight, explosive breakout likely
PATTERN 3: "Early Commitment"
5min: ━━━━━━ (100 pts, already broken up)
15min: ━━━━━ (80 pts, holding)
30min: ━━━━━ (110 pts, about to break)
→ 5min led the way, 30min confirmation coming
```
### **Bearish Alignment Patterns**
```
PATTERN 1: "Waterfall Setup"
5min: ━━━━ (50 pts, broke down)
15min: ━━━━━ (70 pts, broke down)
30min: ━━━━━━ (90 pts, about to break)
→ Sequential breakdown, strong bearish momentum
PATTERN 2: "Failed Highs"
5min: ━━━━━━ (upper wick rejections)
15min: ━━━━━━ (couldn't break)
30min: ━━━━━━━ (topped out)
→ All 3 rejecting highs, bearish reversal likely
```
### **Neutral/Chop Patterns (AVOID TRADING)**
```
PATTERN 1: "Wide Divergence"
5min: ━━ (30 pts)
15min: ━━━━━━━ (120 pts)
30min: ━━━━━━━━━━━ (200 pts)
→ No consensus, unpredictable, skip
PATTERN 2: "Whipsaw City"
• Price breaking 5min up, then down, then up again
• 15min and 30min not aligned
• VWAP getting crossed every 5 minutes
→ Chop day, step aside, wait for clarity
```
---
## 📊 INTEGRATION WITH YM ULTIMATE SNIPER v8.1
**The 2-System Confluence Method:**
```
┌─────────────────────────────────────────────────────────────┐
│ STEP 1: SNIPER ORB → Defines "Zones That Matter" │
│ • 30min ORB = primary institutional range │
│ • VWAP = fair value anchor │
│ • Targets = profit zones │
│ • 5min/15min = early warning signals │
└─────────────────────────────────────────────────────────────┘
↓
┌─────────────────────────────────────────────────────────────┐
│ STEP 2: YM ULTIMATE SNIPER → Triggers precise entry │
│ • Wait for GOD MODE signal AT 30min ORB boundary │
│ • 6-gate filter: Score ≥9, fat body ≥70%, delta ≥70% │
│ • Candle Dominance Index (CDI) ≥7 │
│ • Intrabar pressure consistent throughout formation │
└─────────────────────────────────────────────────────────────┘
↓
┌─────────────────────────────────────────────────────────────┐
│ STEP 3: EXECUTE TRADE │
│ • ORB breakout + GOD MODE = MAXIMUM PROBABILITY │
│ • Enter ONLY when BOTH systems align │
│ • This is TRUE "sniper" trading (2-5 trades/day max) │
└─────────────────────────────────────────────────────────────┘
```
**Confluence Scoring for Combined System:**
```
SNIPER ORB Criteria:
□ 30min ORB complete (10:00 AM+) +2 points
□ All 3 ORBs broken in same direction +2 points
□ VWAP alignment (below=bull, above=bear) +1 point
□ Volume spike on breakout candle +1 point
□ Tight 3-ORB compression (<100pt divergence) +1 point
YM ULTIMATE SNIPER Criteria:
□ GOD MODE signal at ORB boundary +3 points
□ Score ≥9.0 (tier classification) +1 point
□ Candle Dominance Index (CDI) ≥8 +1 point
TOTAL POSSIBLE: 12 points
TRADE EXECUTION RULES:
• 10-12 points = MAX SIZE (this is the holy grail setup)
• 8-9 points = FULL SIZE (high probability)
• 6-7 points = HALF SIZE (moderate probability)
• <6 points = NO TRADE (wait for better alignment)
```
---
## 💡 COMMON MISTAKES & FIXES
```
❌ MISTAKE: Trading before 30min ORB completes
✅ FIX: Wait until 10:00 AM (NY) or 3:30 AM (London), NO EXCEPTIONS
❌ MISTAKE: Ignoring 5min and 15min ORBs (only watching 30min)
✅ FIX: Use all 3 for confluence - they're your early warning system
❌ MISTAKE: Chasing breakouts 100+ points beyond 30min ORB
✅ FIX: Wait for pullback to VWAP or 30min boundary for re-entry
❌ MISTAKE: Not adjusting target % for market conditions
✅ FIX: Volatile day (ORB >200pts)? Use 75-100% targets
Calm day (ORB <80pts)? Use 30-40% targets
❌ MISTAKE: Trading when all 3 ORBs are wildly different sizes
✅ FIX: Skip the day if 5m/15m/30m diverge by >100pts - no consensus
❌ MISTAKE: Forgetting VWAP position
✅ FIX: VWAP MUST confirm bias:
• Long: price > VWAP
• Short: price < VWAP
• If VWAP contradicts, skip the trade
❌ MISTAKE: Not respecting the 3-strike rule
✅ FIX: 3 losses = DONE for the session, no rationalization
❌ MISTAKE: Trading during lunch (12:00-1:00 PM ET)
✅ FIX: Volume dies, ORBs lose relevance, false signals increase
```
---
## 🔔 ALERT SETUP (ESSENTIAL)
**TradingView Alerts You MUST Set:**
```
ALERT 1: "30min ORB Complete"
• Type: Time-based
• Trigger: 10:00 AM ET (NY) or 3:30 AM ET (London)
• Message: "🎯 30min ORB complete - targets now active"
ALERT 2: "30min ORB High Breakout"
• Type: Crossing Up
• Value 1: Close
• Value 2: 30min ORB High (purple line)
• Message: "🚀 30m ORB HIGH broken - check for long setup"
ALERT 3: "30min ORB Low Breakdown"
• Type: Crossing Down
• Value 1: Close
• Value 2: 30min ORB Low (purple line)
• Message: "📉 30m ORB LOW broken - check for short setup"
ALERT 4: "VWAP Cross"
• Type: Crossing
• Value 1: Close
• Value 2: VWAP
• Message: "⚡ VWAP crossed - check institutional bias shift"
ALERT 5: "Target 1 Hit"
• Type: Crossing
• Value 1: High (for longs) or Low (for shorts)
• Value 2: First target line
• Message: "🎯 Target 1 hit - take 50% off, move stop to BE"
```
---
## 📱 MOBILE TRADING WORKFLOW
**TradingView Mobile App Setup:**
```
1. SAVE LAYOUT
• Chart: 5-minute timeframe
• SNIPER ORB indicator loaded
• YM Ultimate SNIPER v8.1 loaded (if using)
• Save as "SNIPER ORB - YM"
2. ENABLE NOTIFICATIONS
• Settings → Notifications → Push Alerts: ON
• All 5 alerts above configured
3. QUICK ACCESS
• Add YM futures to Watchlist: "MYM" or "YM1!"
• Pin SNIPER ORB layout to favorites
4. EXECUTION READY
• Broker app (TastyTrade, NinjaTrader, etc.) logged in
• Preset bracket orders:
- Entry: market order
- Stop: 30m ORB opposite boundary
- Targets: 3 levels (50%, 30%, 20% of position)
5. BATTERY & CONNECTIVITY
• Phone charged 100% before session
• Stable WiFi or LTE connection
• Backup power bank available
```
---
## 🎓 DAILY PERFORMANCE JOURNAL
**After Each Trading Session (MANDATORY):**
```
═══════════════════════════════════════════════════════════════
DATE: __________ SESSION: □ London □ New York
═══════════════════════════════════════════════════════════════
ORB DATA:
• 5min ORB Range: ______ points
• 15min ORB Range: ______ points
• 30min ORB Range: ______ points
• Alignment: □ Tight □ Moderate □ Wide (skip if wide)
VWAP BEHAVIOR:
• Opening position: □ Above price □ Below price □ Mixed
• Did VWAP act as support/resistance? □ Yes □ No
TRADES TAKEN:
Total Setups Identified: _____
Trades Executed: _____
Win/Loss Record: _____ W / _____ L
Win Rate: _____%
Gross P&L: $_______
Net P&L (after commissions): $_______
BEST TRADE:
• Setup: ____________________ (which of the 5 setups?)
• Entry Price: ______ Exit Price: ______
• Profit: $_______
• What went RIGHT: _________________________________
_________________________________________________
WORST TRADE:
• Setup: ____________________
• Entry Price: ______ Exit Price: ______
• Loss: $_______
• What went WRONG: _________________________________
_________________________________________________
• Lesson Learned: ___________________________________
3-STRIKE RULE STATUS:
□ No losses (great day)
□ 1 loss (still in game)
□ 2 losses (caution, half size)
□ 3 losses (stopped for day, as required)
TOMORROW'S ADJUSTMENTS:
□ _________________________________________________
□ _________________________________________________
□ _________________________________________________
EMOTIONAL STATE TODAY:
□ Calm & focused (optimal)
□ Anxious/rushed (need to work on patience)
□ Overconfident (dial back position size)
□ Fearful (review winning trades to build confidence)
═══════════════════════════════════════════════════════════════
```
---
## 🚀 YOUR FIRST LIVE TRADE WALKTHROUGH
**Step-by-Step for New York Session (Most Common):**
```
⏰ 9:15 AM ET - PREPARATION
□ Load SNIPER ORB on YM 5-minute chart
□ Select "New York" session in indicator settings
□ Verify VWAP is showing (gold line)
□ Check economic calendar (any big news at 9:30?)
□ Prepare mentally: "I will wait for 30min ORB to complete"
⏰ 9:30 AM ET - SESSION OPENS
□ Watch 3 ORBs begin forming:
• Blue lines (5min) will lock in at 9:35 AM
• Cyan lines (15min) will lock in at 9:45 AM
• Purple lines (30min) will lock in at 10:00 AM
□ Observe VWAP anchoring at 9:30 AM candle
□ DO NOT TRADE YET - just observe
⏰ 9:35 AM - 5MIN ORB COMPLETE
□ Note 5min high/low (blue lines locked)
□ Check info table: "5m Range = XX points"
□ If 5min ORB breaks early, note direction but DON'T ENTER
⏰ 9:45 AM - 15MIN ORB COMPLETE
□ Note 15min high/low (cyan lines locked)
□ Compare to 5min ORB: Aligned? Expanding?
□ Still waiting... patience pays
⏰ 10:00 AM - 30MIN ORB COMPLETE (TARGETS APPEAR!)
□ Purple lines locked (30m high/low)
□ Green/red dashed target lines appear automatically
□ Info table shows "Status: ✓ Complete"
□ NOW you can trade breakouts
⏰ 10:00 AM - 11:30 AM - TRADING WINDOW
□ Wait for price to break purple line (30m ORB high or low)
□ Confirm:
1. All 3 ORBs broken in same direction?
2. VWAP confirming (below=bullish, above=bearish)?
3. Volume spike visible?
4. YM SNIPER GOD MODE signal? (if using)
□ If all YES → ENTER TRADE:
• Market order at breakout close
• Stop at 30m ORB opposite boundary
• Targets at green/red dashed lines
⏰ TARGET MANAGEMENT
□ Price hits first target (1x) → Take 50% off, move stop to BE
□ Price hits second target (2x) → Take 30% off, trail stop
□ Price hits third target (3x) → Take 15% off, let 5% run
⏰ 12:00 PM - LUNCH (AVOID TRADING)
□ Volume dies down
□ ORBs become less relevant
□ Take a break, review morning trades
⏰ 1:00 PM - 3:00 PM - AFTERNOON SESSION
□ ORBs still valid but less reliable
□ Consider waiting for Power Hour (3:00-4:00 PM)
⏰ 5:00 PM - SESSION END
□ All ORB lines disappear automatically
□ VWAP disappears automatically
□ Chart cleans itself - ready for tomorrow
□ Fill out daily journal
```
---
## 🏆 WINNING MINDSET AFFIRMATIONS
Read these BEFORE each trading session:
```
"I trade ORBs, not chaos. Structure gives me edge."
"3 high-quality trades beat 20 mediocre ones."
"The 30min ORB is my anchor. I wait for it. Every. Single. Time."
"When all 3 ORBs align, institutions are unified. I follow."
"VWAP is my institutional compass. I respect its guidance."
"3 strikes and I'm out. Discipline > Ego."
"I am a SNIPER, not a machine gunner. Precision wins."
"My edge is patience. Let the ORBs complete."
"I don't predict. I react to proven structure."
"One perfect setup is worth waiting all morning."
```
---
## 📞 TROUBLESHOOTING
**"ORB lines not showing on chart!"**
→ Check timeframe: Must be 1min-30min (not daily/weekly)
→ Verify session time: Must be during London (3AM-9:30AM) or NY (9:30AM-5PM)
→ Check indicator status: Should say "⏳ Forming" or "✓ Complete" in table
**"Targets not appearing!"**
→ 30min ORB must be complete (10:00 AM NY / 3:30 AM London)
→ Check "Number of Targets" setting (must be ≥1)
→ Verify "Target % of 30min Range" is set (default 50%)
**"VWAP disappeared!"**
→ Normal behavior: VWAP auto-deletes at session end (5PM NY / 9:30AM London)
→ Toggle "Show Anchored VWAP" OFF then ON to reset
→ Check if you're viewing chart outside session hours
**"All 3 ORBs look the same!"**
→ This is actually GOOD - means tight alignment (high-probability setup)
→ If they're diverging wildly (>100pts difference), that's a skip signal
**"Info table blocking my view!"**
→ Info table is in top-right corner by default
→ Drag it to a different position (TradingView allows moving)
→ Or minimize it by clicking the small arrow
**"Colors are hard to see on my chart!"**
→ Go to indicator settings:
• "5min ORB", "15min ORB", "30min ORB" color pickers
• "Upside Targets", "Downside Targets" color pickers
• Recommended: Use contrasting colors vs your chart background
---
## 📚 ADVANCED INTEGRATION TECHNIQUES
### **Combining with Market Profile**
```
• Use Volume Profile to identify Value Area High (VAH) and Low (VAL)
• If 30min ORB aligns with VAH/VAL → extra confluence
• POC (Point of Control) acts similar to VWAP
```
### **Combining with Cumulative Delta**
```
• Check if delta is positive on 30min ORB high break (bullish confirmation)
• Negative delta on low break confirms bearish institutional flow
• Your YM SNIPER already tracks this - use together!
```
### **Combining with Options Flow**
```
• Large call buying near 30min ORB high? Institutions positioning for breakout
• Large put buying near 30min ORB low? Smart money hedging/shorting
• Tools: Unusual Whales, Cheddar Flow, OptionStrat
```
---
## 🎯 FINAL PRE-LIVE CHECKLIST
**DO NOT GO LIVE UNTIL ALL CHECKED:**
```
□ Practiced on TradingView Replay for 2+ weeks
□ Can identify all 5 setups by pattern recognition
□ Understand why targets come from 30min ORB only
□ Know difference between 5min/15min/30min roles
□ Risk management rules memorized (position sizing, 3-strike)
□ YM Ultimate SNIPER v8.1 loaded (optional but recommended)
□ All 5 TradingView alerts configured
□ Broker platform tested with demo account
□ Stop/target orders can be placed in <10 seconds
□ Daily journal template prepared
□ Emotional state: calm, patient, focused
□ Account size: Minimum $10,000 recommended
□ Understand auto-disappear behavior (ORBs delete at session end)
□ Know NOT to trade before 30min ORB complete
□ Comfortable with looking at chart and seeing 6+ lines (3 ORBs + targets)
IF ALL CHECKED → YOU'RE READY TO SNIPE! 🎯
IF ANY UNCHECKED → KEEP PRACTICING, DON'T RUSH
```
---
## 💎 THE CORE PRINCIPLE
```
╔═══════════════════════════════════════════════════════════╗
║ ║
║ "The ORB doesn't predict the market. ║
║ The ORB reveals where institutions are positioned. ║
║ ║
║ When you see all 3 ORBs align and break, ║
║ you're not guessing direction— ║
║ you're following the billion-dollar order flow." ║
║ ║
║ THAT'S YOUR EDGE. ║
║ ║
╚═══════════════════════════════════════════════════════════╝
```
**🎯 Good luck, stay patient, and happy sniping! 🎯**
═══════════════════════════════════════════════════════════════════
END OF SNIPER ORB TRADING CHEAT SHEET v3.0
═══════════════════════════════════════════════════════════════════

JAM ORB Algo⚡ ORB Strategy + Backtesting (Pine Script v5)
This script implements a complete Opening Range Breakout (ORB) strategy, featuring built-in backtesting, advanced TP/SL visualization, full style customization, and a performance dashboard. It is designed for traders who want to clearly evaluate breakout performance directly on the chart.
🕑 ORB Window Configuration
🔹 Session selection: choose between Market Timezone or Custom Session.
🔹 Timezone support: configurable from UTC-8 to UTC+12.
🔹 Daily limit: option to allow only one trade per day.
🔹 Risk/Reward (RR) settings:
Configurable TP1, TP2, and TP3 levels.
Stop Loss calculated dynamically from the ORB range.
📊 Backtesting Engine
🔹 Interactive dashboard showing trades, wins, losses, and win rate.
🔹 Adjustable partial exits for each TP (TP1, TP2, TP3).
🔹 Automatic calculation of percentage-based profit and loss.
🔹 Tracks total trades, total profit, and average profit per trade.
🎨 Visual Customization
🔹 Fully customizable colors:
ORB high/low lines and range fill.
Buy/Sell entry labels.
TP and SL lines with background zones.
🔹 Line style and thickness options (solid, dotted, dashed).
🔹 Visibility controls for each TP/SL level.
🔹 Clear profit and loss zones drawn directly on the chart.
🚀 Trading Logic
🔹 LONG entries: triggered when price breaks above the ORB high.
🔹 SHORT entries: triggered when price breaks below the ORB low.
🔹 Automatic calculation of Stop Loss and TP1, TP2, TP3 based on ORB range and RR.
🔹 Customizable BUY / SELL labels displayed at entry.
✅ TP / SL Detection
🔹 Real-time detection of TP1, TP2, TP3, and SL hits.
🔹 Prevents double counting of the same level.
🔹 Extended TP/SL lines with shaded zones for better clarity.
📈 Backtesting Dashboard
🔹 Displayed in the top-right corner of the chart.
🔹 Shows:
Total trades
Wins / Losses
Win rate (%)
Total profit (%)
Average profit per trade
🔹 Fully customizable panel color.
✨ Summary
This script combines:
Opening Range detection
Breakout trading logic with advanced risk management
Professional-grade visualizations
Integrated historical performance tracking
High customization for sessions, styles, and colors
💡 Ideal for traders who want to trade ORB setups with clarity, structure, and measurable results.

Open Range BreakoutOpen Range Breakout (ORB)
The Open Range Breakout (ORB) is a classic intraday strategy used across stocks, indices, FX and futures. It focuses on how price behaves during the first minutes of a major session, when liquidity and volatility are highest.
This indicator fully automates the ORB process with session detection, box drawing, breakout & retest logic, and final Buy/Sell signals.
Multi-Session Support
Choose between the three most important global opens:
Asia (Tokyo) – JPY pairs, Asian indices, gold, crypto
London – FX majors, European indices, strong volatility
New York – US indices, USD pairs, gold, oil, highest volume
The Opening Range is calculated only during the selected session.
ORB Range (5 / 15 / 30 min)
The indicator builds the ORB High/Low from the first X minutes of the session, draws the box, and waits for price action once the range is complete.
How It Works
ORB Window → High/Low of the opening minutes are recorded.
Breakout → Price closes above/below the ORB → “BREAKOUT” label.
Retest → Price returns to the ORB box → “RETEST” label.
Confirmation Levels Freeze → Upper/lower structure set.
Final Signal
Close above frozen upper level → BUY
Close below frozen lower level → SELL
This filters out false breakouts and provides structured continuation signals.
Alerts
Includes built-in alert conditions for:
ORB BUY Signal
ORB SELL Signal
Alerts trigger exactly when the Buy or Sell label appears.
Works On
Stocks & indices
Forex
Futures

Vib ORB Range (Free)Vib ORB Range (Free) plots the Opening Range High and Low for the session based on a user-defined start time and duration.
This tool is designed for traders who want a clean, no-noise display of the ORB zone without extra indicators or automation.
Features:
Customizable Opening Range start time
Customizable Opening Range duration
Automatically resets daily
Plots ORB High, ORB Low, and optional ORB Midline
Shaded range zone for improved clarity
Works on all timeframes and markets
How to Use:
Set the ORB start time (default 9:30 New York)
Set the ORB duration (default 15 minutes)
The indicator will draw the ORB zone once the range completes
Use the outlines or shaded zone to visually identify potential breakout areas
This free tool is intended as a simple, reliable ORB visualizer without alerts, filters, or strategy logic.

Levels v14 BetaCombination of all the important levels that you could possibly need.
Vwap
Daily / Weekly / Monthly - Settlements
Daily / Weekly / Monthly - Openings
Lows / Highs
Pivot Points
ORB
EMA
Recommended to turn off labels to avoid having too many price labels and keeping it clean.
In the settings - style turn off :
Labels on price scale
Values in status line
Inputs in status line
For the ORB setting change the UTC value depending on your time zone

Multi Session ORBs 2.0Multi Session ORBs 2.0 is an intraday tool for session-based traders who rely on Opening Range Breakout and Initial Balance structures to frame trades around the Tokyo, London, and New York sessions. It automatically detects the main sessions in New York time and plots each session’s opening-range high, low, and optional mid, with shaded boxes that highlight the active range and clean horizontal levels that extend across the session for precise breakout, rejection, and rotation analysis.
The script also builds a dedicated New York Initial Balance from 09:30 to 10:30 ET and then projects those IB levels forward from 10:30 through the rest of the NY session, helping intraday traders track first-hour value, monitor when price accepts or rejects that area, and structure trades around range breaks or mean reversion. Optional labels and vertical markers print 15 minutes before the London and New York opens, making it easier to anticipate volatility windows and align entries with key session transitions.
This indicator is designed to be used preferably in confluence with the separate Multi VWAPs tool, which plots multiple VWAPs across different time horizons so that traders can combine session ORB/IB levels with VWAP-based dynamic support and resistance for stronger intraday bias and higher-quality trade locations.
ORB Algo - BitcoinGENERAL SUMMARY
We present our new ORB Algo indicator! ORB stands for "Opening Range Breakout," a common trading strategy. The indicator can analyze the market trend in the current session and generate Buy/Sell, Take Profit, and Stop Loss signals. For more information about the indicator's analysis process, you can read the “How Does It Work?” section of the description.
Features of the new ORB Algo indicator:
Buy/Sell Signals
Up to 3 Take Profit Signals
Stop Loss Signals
Buy/Sell, Take Profit, and Stop Loss Alerts
Fully Customizable Algorithm
Session Control Panel
Backtesting Control Panel
HOW DOES IT WORK?
This indicator works best on the 1-minute timeframe. The idea is that the trend of the current session can be predicted by analyzing the market for a period of time after the session begins. However, each market has its own dynamics, and the algorithm will require fine-tuning to achieve the best possible performance. For this reason, we implemented a Backtesting Panel that shows the past performance of the algorithm on the current ticker with your current settings. Always remember that past performance does not guarantee future results.
Here are the steps of the algorithm explained briefly:
The algorithm follows and analyzes the first 30 minutes (adjustable) of the session.
Then, it checks for breakouts above or below the opening range high or low.
If a breakout occurs in either direction, the algorithm will look for retests of the breakout. Depending on the sensitivity setting, there must be 0 / 1 / 2 / 3 failed retests for the breakout to be considered reliable.
If the breakout is reliable, the algorithm will issue an entry signal.
After entering the position, the algorithm will wait for the Take-Profit or Stop-Loss zones to be reached and send a signal if any of them occur.
If you wonder how the indicator determines the Take-Profit and Stop-Loss zones, you can check the Settings section of the description.
UNIQUENESS
Although some indicators display the opening range of the session, they often fall short in features such as indicating breakouts, entries, and Take-Profit & Stop-Loss zones. We are also aware that different markets have different dynamics, and tuning the algorithm for each market is crucial for better results. That is why we decided to make the algorithm fully customizable.
In addition to this, our indicator includes a detailed backtesting panel so you can see the past performance of the algorithm on the current ticker. While past performance does not guarantee future results, we believe that a backtesting panel is necessary to fine-tune the algorithm. Another strength of the indicator is that it offers multiple options for detecting Take-Profit and Stop-Loss zones, allowing traders to choose the one that fits their style best.
⚙️ SETTINGS
Keep in mind that the best timeframe for this indicator is the 1-minute timeframe.
TP = Take-Profit
SL = Stop-Loss
EMA = Exponential Moving Average
OR = Opening Range
ATR = Average True Range
1. Algorithm
ORB Timeframe → This setting determines how long the algorithm will analyze the market after a new session begins before issuing signals. It is important to experiment with this option and find the optimal setting for the current ticker. More volatile stocks will require a higher value, while more stable stocks can use a shorter one.
Sensitivity → Determines how many failed retests are required before taking an entry. Higher sensitivity means fewer retests are needed to consider the breakout reliable.
If you believe the ticker makes strong moves after breaking out, use high sensitivity.
If the ticker doesn’t define the trend immediately after a breakout, use low sensitivity.
(High = 0 Retests, Medium = 1 Retest, Low = 2 Retests, Lowest = 3 Retests)
Breakout Condition → Determines how the algorithm detects breakouts.
Close = The bar must close above OR High for bullish breakouts or below OR Low for bearish breakouts.
EMA = The bar’s EMA must be above/below the OR Lines instead of relying on the closing price.
TP Method → Method used to determine TP zones.
Dynamic = Searches for the bar where price stops following the current trend and reverses. It uses an EMA, and when the bar’s close crosses the EMA, a TP is placed.
ATR = Determines TP zones before the trade happens, using the ATR of the entry bar. This option also displays the TP zones on the ORB panel.
→ The Dynamic method generally performs better, while the ATR method is safer and more conservative.
EMA Length → Sets the length of the EMA used in both the Dynamic TP method and the “EMA Breakout Condition.” The default value usually performs well, but you can experiment to find the optimal length for the current ticker.
Stop-Loss → Defines where the SL zone will be placed.
Safer = SL is placed closer to OR High in bullish entries and closer to OR Low in bearish entries.
Balanced = SL is placed in the middle of OR High & OR Low.
Risky = SL is placed farther away, giving more room for movement.
Adaptive SL → Activates only if the first TP zone is reached.
Enabled = After the 1st TP hits, SL moves to the entry price, making the position risk-free.
Disabled = SL never changes.

ORB_RDORB_RD - Opening Range Box (Ryan DeBraal)
This indicator automatically draws a high/low box for the first portion of
each trading day, automatically stepping the range window from 15, 30, 45,
up to 60 minutes after the session starts. The box updates live as the range
forms, then optionally extends across the rest of the session.
FEATURES
-----------------------------------------------------------------------------
• Opening Range Detection
- Automatically ladders the range window: 0–15, 0–30, 0–45, 0–60 minutes
- Automatic reset at each new trading day
- Live high/low updates while inside the 0–60 minute window
• Auto-Drawing Range Box
- Draws a dynamic rectangle as the range forms
- Top and bottom update with every new high/low
- Extends sideways in real time during formation
- Optional full-day extension after the 60-minute range finalizes
• Customizable Visuals
- Adjustable fill transparency
- Mild green tint by default for clarity
PURPOSE
-----------------------------------------------------------------------------
This tool highlights the evolving opening range, a widely used intraday
reference for breakout traders, mean-reversion setups, and session structure
analysis. Ideal for:
• Identifying early support and resistance
• Framing breakout and pullback decisions
• Tracking intraday trend bias after the morning range

Nova Trades | Opening Range IndicatorNova Trades | Opening Range With Confluences
Overview
The Nova Trades ORB Simple indicator is a clean, educational implementation of Opening Range Breakout (ORB) methodology combined with Exponential Moving Average (EMA) trend filtering. This script is designed to help traders visualize market structure during the critical opening session and identify high-probability breakout opportunities.
What Makes This Implementation Unique
1. Real-Time Dynamic ORB Tracking
Unlike static ORB indicators that plot fixed levels, this script:
Updates ORB high/low levels in real-time during the opening range period
Dynamically adjusts line positions as new highs/lows form within the ORB window
Uses line.set_y1() and line.set_y2() to provide smooth, live updates without cluttering the chart
Automatically extends ORB levels into the future for easy visual reference
2. Integrated Status Dashboard
The script includes a comprehensive real-time status table that shows:
Current ORB period status (ACTIVE vs COMPLETE)
Calculated ORB range size (useful for volatility assessment)
Current price position relative to ORB levels (ABOVE/BELOW/INSIDE)
Price position relative to EMA (trend context)
First breakout direction detection (BULLISH/BEARISH/PENDING)
This dashboard eliminates the need to manually assess market conditions and provides instant decision-making information.
3. Breakout Detection Logic
The script employs a first-breakout-only tracking system that:
Waits for the ORB period to complete before flagging breakouts
Records only the first directional break after ORB completion
Prevents false signals from intraday price whipsaws
Maintains breakout status throughout the trading session for consistency
4. EMA Confluence Filter
While many ORB scripts exist and EMA is a standard indicator, this script's value lies in how they work together:
Trading Edge: The combination provides a two-factor confirmation system:
ORB Breakout = Short-term momentum shift (microstructure)
EMA Position = Intermediate trend alignment (macrostructure)
Why This Matters:
ORB breakouts above ORB high + price above EMA = Aligned bullish momentum (highest probability long setups)
ORB breakouts below ORB low + price below EMA = Aligned bearish momentum (highest probability short setups)
Conflicting signals (e.g., ORB breakout up but price below EMA) = Lower probability, potential reversal zones
5. Customizable Time Periods
Supports multiple ORB timeframes (5m, 15m, 30m, 45m, 60m) because:
Different securities have different volatility profiles
Intraday traders may prefer shorter ORB periods (5-15m)
Position traders may prefer longer ORB periods (45-60m)
Allows optimization for specific trading styles and instruments
6. Clean Visual Design
Market open line clearly marks session start
Color-coded ORB levels (customizable) for instant visual recognition
Minimal chart clutter with toggle options for each component
Data window plots for programmatic strategy access
How It Works
Opening Range Breakout (ORB) Calculation
Initialization: At 9:30 AM NY time (market open), the script begins tracking
Range Formation: During the selected timeframe (default 30 minutes):
Continuously updates the highest high → ORB High
Continuously updates the lowest low → ORB Low
Range Completion: After the ORB period ends, levels are locked
Breakout Detection: Price breaking above ORB High (bullish) or below ORB Low (bearish) triggers the breakout flag
EMA Trend Filter
Calculates exponential moving average (default 50-period, customizable 1-500)
Provides trend context: Price > EMA = uptrend, Price < EMA = downtrend
Acts as dynamic support/resistance level
Combined Strategy Logic
Why Open Source?
This script is published as open source to:
Provide educational value to the trading community
Demonstrate clean coding practices for ORB implementations
Allow traders to customize and adapt to their specific needs
Serve as a foundation for more complex strategy development
The code uses standard Pine Script functions (ta.ema(), line.new(), table.new()) intentionally to maintain transparency and educational value.
Disclaimer
This indicator is for educational and informational purposes. It does not constitute financial advice. Past performance does not guarantee future results. Always practice proper risk management.

AMS Adaptive Supertrend - v1.0The ATMOS MARKET SUITE (AMS) Adaptive Supertrend is a volatility-responsive trend framework designed to keep structural context clear across changing market conditions. It expands on the traditional Supertrend by incorporating ATR percentiles, regime detection, and optional higher-timeframe and VWAP overlays.
Instead of issuing buy/sell signals, this tool helps traders understand trend direction, structural stability, volatility environment, and potential transitions. Its adaptive architecture allows the Supertrend to remain steady during chop while responding more dynamically during strong expansions.
Best Uses
• Identifying clear structural trend during intraday trading
• Filtering for aligned conditions before trend continuation setups
• Understanding volatility regimes (compressed vs expanding)
• Monitoring HTF structural influence on lower-timeframe trades
• Using as a standalone trend backbone or as part of the full ATMOS MARKET SUITE suite
This indicator provides context, not predictions. It is fully functional on its own and also integrates naturally with the Momentum Engine, Consensus Strip, and Cx3 ORB system.

SCOTTGO ORB V1SCOTTGO ORB (Opening Range Breakout) Indicator
The ORB Indicator is a powerful tool for day traders and scalpers, designed to automatically identify and project key price levels based on the market's initial trading activity—the Opening Range (OR).
It helps you quickly visualize the market structure, potential breakout zones, and price targets for the day.
🔑 Key Features & Customization
1. Dynamic Opening Range Calculation
Flexible Time Periods: Easily define your Opening Range using preset times of 5, 15, or 30 minutes. You can also use the International Overrides to set a custom start and end time with a specified timezone.
Visual Range: The indicator automatically calculates and shades the range between the ORB High and ORB Low prices. The Opacity of this shaded box is fully adjustable.
2. Comprehensive Price Targets
The indicator projects multiple levels of price targets (PTs) based on the size of the initial Opening Range, enabling you to set profit targets and manage risk. Targets are grouped for easy toggling:
Default Targets (50%): Visualize the immediate $50\%$ price extension above and below the ORB.
Extended Targets (75%, 100%): View the $75\%$ and full $100\%$ extension levels.
Further Targets (150%, 200%): Explore extended targets for volatile or trending days.
Mid Point: Optional line to display the $50\%$ retracement/midpoint of the ORB itself.
3. Fibonacci Extensions
Access highly relevant price projections using classic Fibonacci ratios:27.2% and 61.8% Extensions: These provide additional high-probability price targets for breakout scenarios.
4. Breakout & Retest Signaling
Entry Signals: Displays on-chart labels for potential ORB Breakouts and subsequent
Retests (BRB), helping you identify high-probability entry points.
Alert Options: Set alerts for simple ORB level crosses or restrict alerts only to confirmed breakout scenarios (Alert only on ORB breakouts).
🎨 Style Customization
All main ORB lines, target levels, and Fibonacci lines can be individually styled (color, thickness, line type) directly within the TradingView Style tab for a personalized chart experience. Dedicated inputs are available for setting colors for 50%, 75%, 100%, and Fibonacci 27.2% / 61.8% levels.
💡 How to Use
1. Set Your ORB Period: Choose the time frame that best suits your market (e.g., 15 minutes is common for US indices).
2. Monitor the Breakout: Once the ORB session ends, wait for the price to break above the ORB High or below the ORB Low.
3. Target and Risk: Use the projected Price Targets to define your potential profit zones, and place stop-losses just inside the ORB range.
SCOTTGO

OG INDICATORTrade Legacy All-in-One Institutional Indicator
Unlock institutional-grade trading with this comprehensive Pine Script indicator. Seamlessly integrates multiple EMAs, SMAs, VWAPs, and ORB displays into one effortless panel—mimicking pro standards for quick, intuitive analysis.
Per Trade Legacy (Jackie): "This is the only indicator you need for profitability." Pair it with your strategy for powerful confluence, boosting edge and profits.
Simple setup, zero clutter. Premium access via invite-only.
Session Open Range, Breakout & Trap Framework - TrendPredator OBSession Open Range, Breakout & Trap Framework — TrendPredator Open Box
Stacey Burke’s trading approach combines concepts from George Douglas Taylor, Tony Crabel, Steve Mauro, and Robert Schabacker. His framework focuses on reading price behaviour across daily templates and identifying how markets move through recurring cycles of expansion, contraction, and reversal. While effective, much of this analysis requires real-time interpretation of session-based behaviour, which can be demanding for traders working on lower intraday timeframes.
The TrendPredator indicators formalize parts of this methodology by introducing mechanical rules for multi-timeframe bias tracking and session structure analysis. They aim to present the key elements of the system—bias, breakouts, fakeouts, and range behaviour—in a consistent and objective way that reduces discretionary interpretation.
The Open Box indicator focuses specifically on the opening behaviour of major trading sessions. It builds on principles found in classical Open Range Breakout (ORB) techniques described by Tony Crabel, where a defined time window around the session open forms a structural reference range. Price behaviour relative to this range—breaking out, failing back inside, or expanding—can highlight developing session bias, potential trap formation, and directional conviction.
This indicator applies these concepts throughout the major equity sessions. It automatically maps the session’s initial range (“Open Box”) and tracks how price interacts with it as liquidity and volatility increase. It also incorporates related structural references such as:
* the first-hour high and low of the futures session
* the exact session open level
* an anchored VWAP starting at the session open
* automated expansion levels projected from the Open Box
In combination, these components provide a unified view of early session activity, including breakout attempts, fakeouts, VWAP reactions, and liquidity targeting. The Open Box offers a structured lens for observing how price transitions through the major sessions (Asia → London → New York) and how these behaviours relate to higher-timeframe bias defined in the broader TrendPredator framework.
Core Features
Open Box (Session Structure)
The indicator defines an initial session range beginning at the selected session open. This “Open Box” represents a fixed time window—commonly the first 30 minutes, or any user-defined duration—that serves as a structural reference for analysing early session behaviour.
The range highlights whether price remains inside the box, breaks out, or rejects the boundaries, providing a consistent foundation for interpreting early directional tendencies and recognising breakout, continuation, or fakeout characteristics.
How it works:
* At the session open, the indicator calculates the high and low over the specified time window.
* This range is plotted as the initial structure of the session.
* Price behaviour at the boundaries can illustrate emerging bias or potential trap formation.
* An optional secondary range (e.g., 15-minute high/low) can be enabled to capture early volatility with additional precision.
Inputs / Options:
* Session specifications (Tokyo, London, New York)
* Open Box start and end times (e.g., equity open + first 30 minutes, or any custom length)
* Open Box colour and label settings
* Formatting options for Open Box high and low lines
* Optional secondary range per session (e.g., 15-minute high/low)
* Forward extension of Open Box high/low lines
* Number of historic Open Boxes to display
Session VWAPs
The indicator plots VWAPs for each major trading session—Asia, London, and New York—anchored to their respective session opens. These session-specific VWAPs assist in tracking how value develops through the day and how price interacts with session-based volume distributions.
How it works:
* At each session open, a VWAP is anchored to the open price.
* The VWAP updates throughout the session as new volume and price data arrive.
* Deviations above or below the VWAP may indicate balance, imbalance, or directional control.
* Viewed together, session VWAPs help identify transitions in value across sessions.
Inputs / Options:
* Enable or disable VWAP per session
* Adjustable anchor and end times (optionally to end of day)
* Line styling and label settings
* Number of historic VWAPs to draw
First Hour High/Low Extensions
The indicator marks the high and low formed during the first hour of each session. These reference points often function as early control levels and provide context for assessing whether the session is establishing bias, consolidating, or exhibiting reversal behaviour.
How it works:
* After the session starts, the indicator records the highest and lowest prices during the first hour.
* These levels are plotted and extended across the session.
* They provide a visual reference for observing reactions, targets, or rejection zones.
Inputs / Options:
* Enable or disable for each session
* Line style, colour, and label visibility
* Number of historic sessions displayed
EQO Levels (Equity Open)
The indicator plots the opening price of each configured session. These “Equity Open” levels represent short-term reference points that can attract price early in the session.
Once the level is revisited after the Open Box has formed, it is automatically cut to avoid clutter. If not revisited, the line remains as an untested reference, similar to a naked point of control.
How it works:
* At session open, the open price is recorded.
* The level is plotted as a local reference.
* If price interacts with the level after the Open Box completes, the line is cut.
* Untested EQOs extend forward until interacted with.
Inputs / Options:
* Enable/disable per session
* Line style and label settings
* Optional extension into the next day
* Option for cutting vs. hiding on revisit
* Number of historic sessions displayed
OB Range Expansions (Automatic)
Range expansions are calculated from the height of the Open Box. These levels provide structured reference zones for identifying potential continuation or exhaustion areas within a session.
How it works:
* After the Open Box is formed, multiples of the range (e.g., 1×, 2×, 3×) are projected.
* These expansion levels are plotted above and below the range.
* Price reactions near these areas can illustrate continuation, hesitation, or potential reversal.
Inputs / Options:
* Enable or disable per session
* Select number of multiples
* Line style, colour, and label settings
* Extension length into the session
Stacey Burke 12-Candle Window Marker
The indicator can highlight the 12-candle window often referenced in Stacey Burke’s session methodology. This window represents the key active period of each session where breakout attempts, volatility shifts, and reversal signatures often occur.
How it works:
* A configurable window (default 12 candles) is highlighted from each session open.
* This window acts as a guide for observing active session behaviour.
* It remains visible throughout the session for structural context.
Inputs / Options:
* Enable/disable per session
* Configurable window duration (default: 3 hours)
* Colour and transparency controls
Concept and Integration
The Open Box is built around the same multi-timeframe logic that underpins the broader TrendPredator framework.
While higher-timeframe tools track bias and setups across the H8–D–W–M levels, the Open Box focuses on the H1–M30 domain to define session structure and observe how early intraday behaviour aligns with higher-timeframe conditions.
The indicator integrates with the TrendPredator FO (Breakout, Fakeout & Trend Switch Detector), which highlights microstructure signals on lower timeframes (M15/M5). Together they form a layered workflow:
* Higher timeframes: context, bias, and developing setups
* TrendPredator OB: intraday and intra-session structure
* TrendPredator FO: microstructure confirmation (e.g., FOL/FOH, switches)
This alignment provides a structured way to observe how daily directional context interacts with intraday behaviour.
See the public open source indicator TP FO here (click on it for access):
Practical Application
Before Session Open
* Review previous session Open Box, Open level, and VWAPs
* Assess how higher-timeframe bias aligns with potential intraday continuation or reversal
* Note untested EQO levels or VWAPs that may function as liquidity attractors
During Session Open
* Observe behaviour around the first-hour high/low and higher-timeframe reference levels
* Monitor how the M15 and 30-minute ranges close
* Track reactions relative to the session open level and the session VWAP
After the Open Box completes
* Assess price interaction with Open Box boundaries and first-hour levels
* Use microstructure signals (e.g., FOH/FOL, switches) for potential confirmation
* Refer to expansion levels as reference zones for management or target setting
After Session
* Review how price behaved relative to the Open Box, EQO levels, VWAPs, and expansion zones
* Analyse breakout attempts, fakeouts, and whether intraday structure aligned with the broader daily move
Example Workflow and Trade
1. Higher-timeframe analysis signals a Daily Fakeout Low Continuation (bullish context).
2. The New York session forms an Open Box; price breaks above and holds above the first-hour high.
3. A Fakeout Low + Switch Bar appears on M5 (via FO), after retesting the session VWAP triggering the entry.
4. 1x expansion level serves as reference targets for take profit.
Relation to the TrendPredator Ecosystem
The Open Box is part of the TrendPredator Indicator Family, designed to apply multi-timeframe logic consistently across:
* higher-timeframe context and setups
* intraday and session structure (OB)
* microstructure confirmation (FO)
Together, these modules offer a unified structure for analysing how daily and intraday cycles interact.
Disclaimer
This indicator is for educational purposes only and does not guarantee profits.
It does not provide buy or sell signals but highlights structural and behavioural areas for analysis.
Users are solely responsible for their trading decisions and outcomes.

GardFx - Fusion - ORBFusion ORB & Bias Monitor
This indicator is a comprehensive toolkit designed for session-based traders. It combines an Opening Range Breakout (ORB) visualizer with a Multi-Timeframe (MTF) trend bias dashboard. It is designed to help traders identify key session levels while keeping track of the broader market trend.
How it Works
1. Opening Range Breakout (ORB) Lines The script identifies the High and Low prices established during the first 15 minutes of a specific session or a manually defined start time.
Calculation: The script tracks the high and low values of candles occurring within the 15-minute window defined by the user settings. It then projects these levels forward using line.new.
Reset Logic: The lines automatically reset at the start of a new session (London or New York) or at specific reset times to ensure the chart remains clean for the next trading opportunity.
2. Multi-Timeframe Bias Dashboard The dashboard provides a quick "Bullish" or "Bearish" sentiment check across four timeframes: Daily, 4-Hour, 1-Hour, and 15-Minute.
Methodology: The script uses request.security to fetch the closing price and a 50-period Exponential Moving Average (EMA) for each timeframe.
Signal:
Bullish: Current Close > 50 EMA
Bearish: Current Close < 50 EMA
3. Exchange Clock & Session Tracker A built-in clock displays the current Exchange Time and identifies the active trading session (Asia, London, or New York). This uses timenow and timezone-specific checks to account for Daylight Savings Time shifts between London and New York.
Settings
Automate Session Times: Toggles between automatic detection of London (08:00) and NY (09:30) opens, or a manual user-defined start time.
Manual Start Hour/Minute: Defines the start of the ORB calculation if automation is disabled.
Bias EMA Length: Adjustable length for the trend detection EMA (Default: 50).
Visuals: Users can customize line colors, width, and toggle the mid-line display.
Usage This tool is best used on lower timeframes (e.g., 1-minute or 5-minute) to visualize the 15-minute opening range boundaries. Traders often observe price action around these high/low lines to determine potential breakouts or reversals, using the MTF Dashboard to align trades with the higher timeframe momentum.

Arkham ORB Indicator 3.815-Minute ORB Breakout Indicator with Volume Confirmation & Dynamic Risk Management
This closed-source indicator identifies high-probability breakout opportunities during the New York session open (8:30-9:30 AM ET) using a systematic Opening Range Breakout methodology combined with volume validation and adaptive volatility-based risk management.
Core Methodology - How It Works
Opening Range Framework
The indicator establishes the Opening Range by tracking the high and low of the first 15 minutes of the trading session (8:30-8:45 AM ET). This range represents the initial price discovery zone where early participants establish equilibrium. Breakouts above the high or below the low signal potential directional moves as liquidity enters the market during the full NY session.
Volume-Based Breakout Validation
To distinguish genuine breakouts from false moves, the indicator employs a rolling volume analysis system. It calculates a 12-period median of volume and applies a 1.2x threshold multiplier. Only price movements accompanied by volume exceeding this threshold are flagged as valid breakout signals. This approach filters out low-conviction breakouts that often occur in choppy, low-participation conditions and significantly reduces false signals at ORB levels.
Adaptive Volatility-Based Stop Loss Calculation
Unlike fixed-point stop losses, this indicator uses a dynamic calculation based on a 10-day lookback of historical ORB ranges. The stop loss is derived by analyzing recent Opening Range sizes and applying a 0.5x multiplier to the average. This creates three key advantages:
Compression adaptation: When recent ORBs shrink (low volatility), stops automatically tighten to reduce risk exposure
Expansion adaptation: When recent ORBs expand (high volatility), stops widen to prevent premature exits on legitimate moves
Hybrid intelligence: The system detects outlier volatility days by comparing current ORB size to the 10-day average. When divergence exceeds 50%, it recognizes abnormal conditions and adjusts stop placement accordingly rather than blindly using historical averages
Multi-Entry Risk Framework
The indicator recognizes that different traders enter at different points relative to the ORB level. It provides simultaneous risk calculations for three entry strategies:
Direct ORB Entry (0-point offset): Immediate breakout entries at the ORB high/low
Pullback Entry 1 (default 5.5 points): Conservative entries waiting for initial retracements
Pullback Entry 2 (default 11.0 points): Deeper retest entries for very conservative approaches
Each entry type displays independently calculated metrics (stop loss distance, contract sizing, take profit levels) that account for the actual entry point's distance from the ORB level. This ensures accurate position sizing and risk/reward ratios regardless of which entry method you use.
Smart Volatility Detection & Alerts
The indicator continuously compares the current day's ORB size against the 10-day historical average. When divergence exceeds a configurable threshold (default 50%), it alerts you to abnormal market conditions:
Compression warnings: When today's ORB is 50%+ smaller than average (potential low-volatility trap)
Expansion warnings: When today's ORB is 50%+ larger than average (potential news event or unusual volatility)
This allows you to adjust expectations and position sizing based on whether current conditions match your backtested historical environment.
Risk Management Safeguards
Min/Max Stop Loss Caps
To prevent extreme stop placements in unusual conditions:
Minimum stop: 35 points (prevents overly tight stops that get hit by noise)
Maximum stop: 75 points (caps risk exposure during extreme volatility events)
Both caps are fully adjustable and can be toggled on/off
Contract Rounding & Risk Display
The indicator automatically rounds to whole contracts and displays real-time risk metrics including:
Suggested stop loss level (adjusted for entry offset + volatility)
Number of contracts (sized to your account risk parameters)
Suggested take profit level (maintains your configured risk/reward ratio)
Dollar risk and potential profit for each entry type
What Makes This Original
This indicator combines several methodological elements that work together as a cohesive risk management system:
Volume confirmation prevents trading every ORB breakout indiscriminately
Adaptive volatility stops ensure your risk scales with current market conditions, not fixed assumptions
Multi-entry framework provides accurate calculations for various entry styles without requiring separate indicators
Outlier detection warns when today's conditions deviate significantly from your backtested norms
Integrated position sizing removes the mental math from determining contracts and risk/reward
Rather than simply plotting ORB levels or using fixed stops, this system adapts to changing volatility while validating breakouts with participation metrics.
How to Use It
Apply to a 5-minute chart of futures instruments (optimized for MNQ/NQ)
Set your account risk parameters in settings (account size, risk per trade %)
Monitor the ORB formation period (8:30-8:45 AM ET) - levels will be drawn
Watch for breakout signals during 8:45-9:30 AM ET with volume confirmation
Choose your entry style from the three displayed options based on your risk tolerance
Use the suggested stops and targets from the real-time risk table
Pay attention to volatility warnings - adjust position sizing if conditions are abnormal
Fully Customizable Settings
All parameters used in the indicator's calculations are user-adjustable, allowing you to adapt the system to your trading style and risk tolerance:
ORB Configuration
ORB formation period start/end times
Entry offset distances (Entry 1 and Entry 2 point values)
Display toggles for each entry type
Volume Analysis
Volume lookback period (default: 12)
Volume multiplier threshold (default: 1.2x)
Toggle volume filtering on/off
Stop Loss Calculation
Historical lookback period (default: 10 days)
Stop loss multiplier (default: 0.5x)
Calculation method: Historical Average, Current Day ORB, or Hybrid
Minimum stop cap (default: 35 points)
Maximum stop cap (default: 75 points)
Toggle min/max caps on/off
Volatility Alerts
Divergence threshold for outlier detection (default: 50%)
Alert display toggles
Risk Management
Account size
Risk percentage per trade
Risk/reward ratio for take profit calculations
Display Options
Table positions and sizes (compact mode)
Color schemes
Show/hide individual components
This flexibility allows you to backtest different parameter combinations and optimize the indicator for current market conditions or your specific trading approach. You are in full control of the calculations - the indicator simply automates the math based on your inputs.
Ideal For
Futures traders (MNQ/NQ) seeking a systematic, rule-based approach to NY session open breakouts with pre-calculated risk parameters that automatically adapt to changing market volatility. Particularly useful for traders who want to eliminate emotional decision-making around stop placement and position sizing.
Important Disclaimers
No Financial Advice
This indicator is provided for educational and informational purposes only. It does not constitute financial advice, investment advice, trading advice, or any other sort of advice. You should not treat any of the indicator's content, outputs, or signals as such. The author is not a licensed financial advisor.
Risk Warning
Trading futures and derivatives involves substantial risk of loss and is not suitable for all investors. Past performance of any trading system or methodology is not necessarily indicative of future results. You should carefully consider whether trading is appropriate for you in light of your experience, objectives, financial resources, and other relevant circumstances.
No Performance Guarantees
While this indicator is designed to identify high-probability setups based on historical analysis, there is no guarantee of profitable results. Market conditions change, and what worked in backtesting may not work in live trading. Due to the leveraged nature of futures trading, losses can significantly exceed your initial investment.
Use at Your Own Risk
All trading decisions made based on this indicator are your sole responsibility. The author assumes no responsibility for your trading results, losses, or any damages resulting from the use of this indicator. Always use proper risk management and never risk more than you can afford to lose.
Backtesting vs. Live Trading
Results generated from backtesting may not reflect actual trading performance due to factors including but not limited to: slippage, commissions, market liquidity, emotional decision-making, and differences between historical and real-time data.
Not a Guarantee of Accuracy
While efforts have been made to ensure the indicator functions as described, no software is perfect. You are responsible for verifying the indicator's calculations and outputs before making any trading decisions.

Opening Range Box, 2 SessionsOpening Range & Session Box Indicator
This indicator automatically draws Opening Range (OR) boxes and Session Boxes based on specific time zone settings, helping you visualize key trading periods across different global markets.
Key Features:
Custom Sessions: Define two independent trading sessions (e.g., New York and London).
Time Zone Selection: Choose the exact time zone for each session from a simple dropdown menu, ensuring accurate session mapping regardless of your chart's time zone.
Opening Range Definition: The initial portion of each session (defined by the Opening Range Minutes input) establishes the high and low of the box.
Offset Lines: Automatically draws two percentage offset lines inside the box, allowing you to easily track price movement relative to the Opening Range high and low (e.g., 10% retracement levels).
How to Use the Inputs:
Session A/B Timezone - Select the time zone for Session A (e.g., America/New_York).
Session A/B Time - Define the start and end time for Session A (e.g., 0930-1600).
Opening Range Minutes - Set how long the initial opening range period lasts (e.g., 30 minutes).
Percent from High/Low for Line - Set the percentage distance for the inner offset lines (e.g., 10.0 for 10% retracement).
Number of Boxes to Show - Controls the number of historical session boxes and lines that remain visible on the chart.
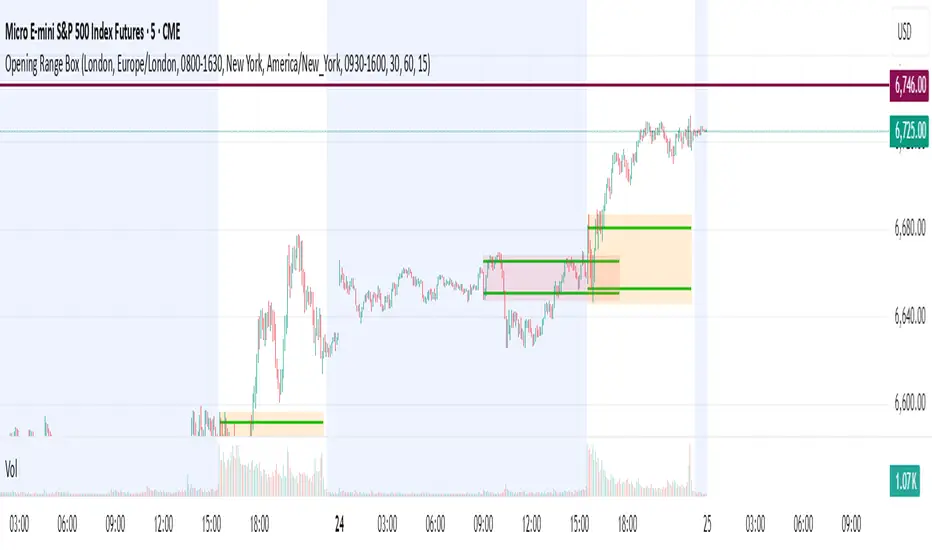
DPPSI A+ FINDPPSI is a precision-driven ORB-based confirmation indicator built from the DPPS Framework (Databased Probable Profitable System) — a rule-based trading process backed by real data, real backtests, and real forward results.
DPPSI helps traders identify A-grade breakouts using three core pillars:
Opening Range Logic (ORB)
Automatically detects your morning OR window and plots OR High, Low, and EQ.
Volume Confirmation
Filters breakouts using relative volume strength (customizable).
Smart Retest Logic
Signals only when price breaks the OR and pulls back with clean retest structure.
Optional filters include Fair Value Gaps, signal limits per session, and adjustable sensitivity.
Designed for traders who want clean, rule-based setups without clutter or random noise.
DPPSI doesn’t replace your strategy it confirms the highest-probability moments inside it.

Sessions & ORB Pro | Bifrost InstituteSessions & ORB Pro | BI
Professional Session Analysis and Opening Range Breakout Tracker
This advanced indicator provides comprehensive session tracking and Opening Range Breakout (ORB) analysis across multiple global trading sessions. Designed for intraday traders, this tool helps identify key support and resistance levels, session volatility patterns, and potential breakout opportunities.
Overview
Session-based trading is crucial for understanding market behavior, as different global sessions (US, European, Asian) exhibit distinct characteristics in terms of volatility, volume, and price action. This indicator allows traders to:
Identify Session Highs and Lows: Track the boundaries of each trading session to spot key support/resistance levels
Monitor Opening Range Breakouts: Capture the first 5, 15, or 30 minutes of major exchange openings to identify early directional bias
Analyze Multi-Session Patterns: View up to 4 concurrent or sequential sessions with full historical data
Customize Visual Analysis: Tailor colors, styles, and overlays for each session independently
Key Features
Multi-Session Support
Configure up to 4 independent trading sessions (US, Europe, Asia, Custom)
Fully customizable session times with timezone support (UTC offset, Chart timezone, or Exchange timezone)
Daylight Savings Time adjustment for accurate session timing
Session range boxes with adjustable transparency and outline styles
Historical session tracking (1-20 previous sessions)
Opening Range Breakout (ORB)
Track Opening Range for major exchanges: NYSE, LSE, TSE, TSX, ASX, HKEX, SSE
Configurable ORB periods: 5-minute, 15-minute, or 30-minute ranges
Visual ORB boxes with customizable colors and outline styles
ORB High/Low lines with optional extension beyond session close
Individual color control for each session's ORB
Session Analytics
Session High/Low: Horizontal lines marking the session's price extremes
Trendline: Linear regression trendline showing session directional bias
Mean: Session average price for mean reversion analysis
VWAP: Volume-weighted average price for institutional level analysis
Range Boxes: Visual representation of each session's price range
Advanced Customization
Individual Color Pickers: Set unique colors for each overlay type per session
Line Styles: Choose between Solid, Dashed, or Dotted for all line types
Label Options: Customize labels to show Date (d/M), Day of Week (ddd), and/or Price
Extend Options: Extend Session H/L and ORB lines beyond current bar
Outline Styles: Independent control of Range and ORB outline appearance
Information Dashboard
Optional real-time dashboard displaying:
Session Status: Open/Closed indicator for each session
Trend: R² correlation coefficient showing directional strength
Volume: Cumulative session volume
σ (Sigma): Session standard deviation for volatility analysis
Range: Session High, Low, and Range in points
ORB: Opening Range High, Low, and Range in points
Dashboard is fully customizable with toggleable columns and adjustable size/position.
Flexible Configuration
Time Zone Management: Three modes for precise session timing
Historical Display: Show/hide previous sessions for cleaner charts
Label Customization: Independent label size and content options for Session H/L vs ORB
Range Settings: Adjustable transparency, outlines, and label positioning
Use Cases
Session Traders: Identify when specific markets are most active and volatile
ORB Traders: Capture early session momentum and breakout opportunities
Support/Resistance: Use session highs/lows as key price levels
VWAP Strategies: Track institutional activity through session VWAP
Multi-Market Analysis: Monitor overlap between global trading sessions
Default Configuration
The indicator comes pre-configured with US (NYSE), Europe (LSE), and Asia (TSE) sessions, making it immediately useful for forex, indices, and global equity traders. Session D is available for custom session requirements.
Perfect for day traders, scalpers, and swing traders who rely on session-based analysis and institutional order flow.

NeuraEdge ORB Professional Opening Range Breakout Indicator-15m🚀 NeuraEdge ORB - Professional Opening Range Breakout Indicator
We're excited to release this clean, effective Opening Range Breakout (ORB) indicator for the trading community. The 15-minute ORB is one of the most time-tested intraday strategies, and we've built this tool to make it simple and actionable.
━━━━━━━━━━━━━━━━━━━━━━━━━━━━━━━━━━━━━━━━━━━━━━━━━━━━
📖 WHAT IS THE 15-MINUTE ORB STRATEGY?
The Opening Range Breakout strategy captures the initial price range established in the first 15 minutes of market open (9:30-9:45 AM ET). This range often sets the tone for the trading day, as institutional order flow and overnight gap reactions play out during this window.
The concept is simple:
- Mark the HIGH and LOW of the first 15 minutes
- Trade the breakout when price breaks above or below this range
- Use the opposite side of the range as your stop loss
━━━━━━━━━━━━━━━━━━━━━━━━━━━━━━━━━━━━━━━━━━━━━━━━━━━━
⚙️ HOW TO USE THIS INDICATOR
1️⃣ SETUP
• Apply to SPY, QQQ, IWM, or any liquid stock/ETF
• Recommended timeframes: 1-minute or 5-minute charts
• The indicator automatically detects the 9:30-9:45 AM ET session
2️⃣ WAIT FOR THE RANGE
• A blue box will form showing the Opening Range
• Wait for the 15-minute period to complete (marked "✅ COMPLETE" in dashboard)
• Note the range size - larger ranges often mean stronger moves
3️⃣ TRADE THE BREAKOUT
• 🟢 LONG: When price closes above the Opening Range High
• 🔴 SHORT: When price closes below the Opening Range Low
• Signals appear automatically with entry, stop loss (SL), and take profit (TP) levels
4️⃣ MANAGE YOUR TRADE
• Stop Loss: Placed at opposite side of range (default) or midpoint
• Take Profit: Based on your selected Risk:Reward ratio
• The indicator tracks win rate automatically
━━━━━━━━━━━━━━━━━━━━━━━━━━━━━━━━━━━━━━━━━━━━━━━━━━━━
🎯 ENTRY TYPES
BREAKOUT MODE (Default)
- Enters immediately when price breaks the range
- More signals, catches the initial move
- Best for: Trending days, high momentum
RETEST MODE
- Waits for price to break out, then pull back to the range
- Fewer signals, better entry price
- Best for: Choppy days, tighter stops
━━━━━━━━━━━━━━━━━━━━━━━━━━━━━━━━━━━━━━━━━━━━━━━━━━━━
📊 SETTINGS EXPLAINED
Display Settings:
- Show Signals - Toggle buy/sell signals
- Show Opening Range Box - Visual box around the 15-min range
- Show Dashboard - Information panel with status and stats
Opening Range Settings:
- Opening Range Minutes - Default 15, adjustable 5-60
- Stop Trading After - Prevents late-day trades (default 3PM ET)
Entry Settings:
- Entry Type - Breakout or Retest
- Require Volume Confirmation - Only signals on above-average volume
- Require FVG Confluence - Adds Fair Value Gap filter for extra confirmation
Risk Management:
- Stop Loss Placement - Opposite Side / Midpoint / ATR Based
- Risk:Reward Ratio - Set your target (1.5 recommended)
━━━━━━━━━━━━━━━━━━━━━━━━━━━━━━━━━━━━━━━━━━━━━━━━━━━━
💡 TIPS FOR BEST RESULTS
✅ DO:
- Trade liquid instruments (SPY, QQQ, major stocks)
- Use 1-5 minute charts for better entry precision
- Respect the stop loss - the range defines your risk
- Pay attention to range size (0.5-1.5x ATR is ideal)
- Be patient - only 1-2 setups per day
❌ AVOID:
- Trading both directions on the same day
- Taking trades after 2-3 PM ET
- Very small ranges (likely to get chopped out)
- Low volume breakouts (often fail)
━━━━━━━━━━━━━━━━━━━━━━━━━━━━━━━━━━━━━━━━━━━━━━━━━━━━
📈 DASHBOARD INFORMATION
The dashboard shows:
- OR Status - Forming / Complete / Waiting
- OR High/Low - The range levels
- Range Size - In points and ATR multiples
- Breakout Direction - Long / Short / None
- Volume Status - High or Normal
- Win Rate - Tracked automatically
- W/L Record - Wins and losses count
━━━━━━━━━━━━━━━━━━━━━━━━━━━━━━━━━━━━━━━━━━━━━━━━━━━━
🔔 ALERTS INCLUDED
- Opening Range Complete - Notifies when the 15-min range is set
- ORB Long Signal - Buy signal triggered
- ORB Short Signal - Sell signal triggered
- Breakout Up/Down - Range broken (even without signal)
━━━━━━━━━━━━━━━━━━━━━━━━━━━━━━━━━━━━━━━━━━━━━━━━━━━━
⚠️ DISCLAIMER
This indicator is for educational and informational purposes only. Past performance does not guarantee future results. Always use proper risk management and never risk more than you can afford to lose. This is not financial advice.
━━━━━━━━━━━━━━━━━━━━━━━━━━━━━━━━━━━━━━━━━━━━━━━━━━━━
━━━━━━━━━━━━━━━━━━━━━━━━━━━━━━━━━━━━━━━━━━━━━━━━━━━━
We hope you find this indicator valuable in your trading journey!
💬 Questions or feedback? Leave a comment below.
🌐 Check out our full Indicator Suite: www.neura-edge.com
📧 Support: support@neura-edge.com
Happy Trading!

SuperMegaIndicator5000SuperMegaIndicator5000
key levels
ema
volume on price High Vol LowV and chop on price
London open close
vwap
orb
and maybe a couple other indicators

WJ STS Session SniperA precision-built indicator designed to support the STS (Session Trading System) framework taught by Jay and customized by Willy.
This tool acts as a decision engine, risk module, and session filter, helping you execute session-based scalps with strict discipline and clean rules.
The STS Companion does not replace TV Blast — it enhances it.
This indicator helps you follow the strategy exactly as intended:
• Only trade key session opens
• Only take trades where multi-timeframe momentum aligns
• Only take trades where volume delta confirms direction
• Only take trades when the session is producing a clean impulse
• Use swing-based stop-loss logic
• Automatically calculate the correct micro contract size
• Only take setups when all conditions match your trading plan
⸻
🎯 The Core Principles Behind the Indicator
The STS strategy is built around a simple philosophy:
“Trade only when the market is moving with force, and avoid 99% of chop.”
This companion implements that philosophy with:
⸻
🕒 High-Volume Session Targeting
The indicator highlights and focuses on the first minutes of major global opens:
• Shanghai / Asia Open
• Frankfurt Open
• London Open
• New York (08:20 futures open)
Each session has a defined “trade window” (default 20 minutes) where institutional liquidity and momentum typically enter the market.
This is where the STS edge lives.
⸻
📊 Multi-Timeframe Sentiment Engine (MTF Bias)
The indicator monitors up to four custom timeframes simultaneously and categorizes momentum as:
• Strong Buy
• Strong Sell
• Buy
• Sell
• Mixed
When ALL selected timeframes agree, bars are highlighted for instant direction clarity:
• Blue bars = all bullish
• White bars = all bearish
⸻
🔥 Volume Delta Engine (Aggression Detection)
Tracks real-time buying/selling pressure using:
• Delta EMA
• Volume filters
• High-volume expansion events
High-volume spikes aligned with trend are marked:
• White dot = bullish high-volume impulse
• Gold dot = bearish high-volume impulse
This identifies when large players are stepping in.
⸻
⚡ Breakout-Based Impulse Filter (“Pseudo Blast”)
Uses a breakout and momentum model to identify:
• The first expansion move after a session open
• Directional commitment
• Low-risk, high-RR scalping opportunities
This is the core trigger that aligns with STS-style entries.
⸻
🧮 Structural Stop-Loss + Position Sizing
The indicator automatically calculates:
• Nearest 1-minute swing high/low
• Stop distance in ticks
• Micro contract size based on your dollar risk input
This ensures high consistency and discipline, perfect for:
• TopStep
• Apex
• FundedNext
• Any account with a daily loss limit or tight risk rules
Setup signals only print when risk, stop, and volatility conditions are all safe.
⸻
🟢 When a Valid Setup Appears
The indicator will show:
• A triangle (long/short candidate)
• A label with:
• Stop-loss in ticks
• Recommended micro contract size
This means the system has aligned:
1. Session window
2. MTF bias
3. Volume delta
4. Breakout impulse
5. Proper stop
6. Safe position size
Only then does the STS Companion mark a bar.
⸻
📌 How to Use This Indicator
1. Wait for a major session open
Focus especially on Shanghai, Frankfurt, London, and NY.
2. Check the MTF bias
Blue = all bullish
White = all bearish
Avoid mixed conditions.
3. Confirm volume delta
Look for white/gold high-volume dots aligned with direction.
4. Wait for an impulse breakout
A triangle marks the potential STS entry bar.
5. Use the provided micro size
Position sizing is based on swing stop + your risk per trade.
6. Execute your plan
The indicator supports discipline — it does not override your rules.
⸻
⭐ Designed For
• Gold futures traders (XAUUSD / GC / MGC)
• Session scalpers
• Prop firm traders
• Momentum + breakout scalpers
• Anyone wanting mechanical, rule-based setups
⸻
🔒 Important
This indicator does not auto-trade.
It does not duplicate TV Blast.
It provides a clean, rules-based system to support the STS session methodology with precision and consistency.

Hourly ORB Boxes v2 (5/15min/custom min)Draws ORB on 9.30am open and every hour from 11am to 3pm so you can enjoy multiple ORB entries throughout the day with a custom time
Choose 5 min or 10 min or 15 min for ORB.
All open source written from scratch with help of chatgpt lol
