Z TRAP_Range Indicator Name: Z TRAP_Range
Primary Function:
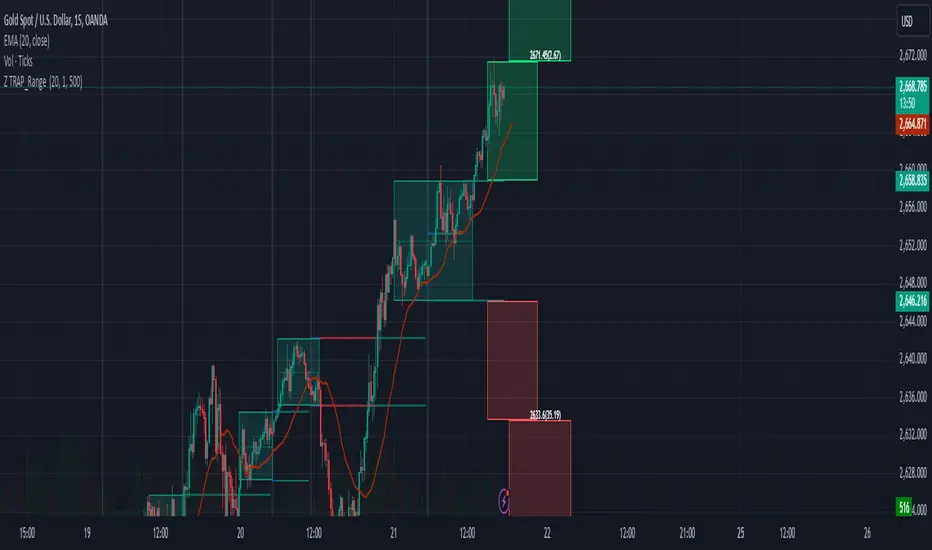
This indicator is designed to identify and highlight price ranges on a TradingView chart. It detects periods of consolidation (when price remains within a defined range) and marks these areas using dynamic boxes. It also visualizes range breakouts and provides additional extension levels for potential price targets.
Features Overview:
Dynamic Range Detection:
Identifies price ranges based on a moving average (ma) and ATR (atr) calculations.
Considers a customizable minimum range length (length) to detect valid consolidation zones.
Highlights the range's top and bottom boundaries with colored boxes.
Breakout Visualization:
Green Box (upCss): Indicates upward breakout from the detected range.
Red Box (dnCss): Indicates downward breakout from the detected range.
Blue Box (unbrokenCss): Indicates that price remains within the range (consolidation).
Extension Levels:
Projects two upward and two downward extension levels based on the height of the detected range.
Helps identify potential price targets after a breakout.
Customizable Style Settings:
Change colors for breakout upward, breakout downward, and unbroken ranges.
Adjust ATR multiplier (mult) and range detection sensitivity.
Annotations:
Displays labels showing key price levels, including range top, bottom, and extension levels.
Provides details like the difference between the close price and the range level for better context.
Historical Context:
Maintains a visual record of previous ranges and breakouts on the chart.
Can handle overlapping ranges and dynamically adjust boundaries.
How the Indicator Works:
Range Detection:
When the price remains close to the moving average for the defined length of bars, a new range is detected. The range top and bottom are calculated using the ATR-based width (ma ± atr).
Breakout Detection:
If the price moves above the range top, an upward breakout is marked.
If the price moves below the range bottom, a downward breakout is marked.
If the price stays within the range, the box color remains blue.
Dynamic Updates:
Existing ranges are adjusted dynamically for overlaps, and new ranges are created when necessary.
Visual Elements:
Boxes:
Highlight price ranges with colors indicating breakout or consolidation.
Box colors dynamically change based on price action.
Lines:
Draw horizontal levels for the range’s top and bottom.
Extension lines project potential targets based on range height.
Labels:
Display price levels and their differences from the close price.
Show the height of each extension level for additional insights.
Customization Options:
Minimum Range Length: Adjust the sensitivity of range detection.
Range Width: Change the ATR multiplier for wider or narrower ranges.
ATR Length: Modify the ATR period for fine-tuning volatility sensitivity.
Color Settings: Customize box colors for upward, downward, and unbroken ranges.
Use Cases:
Consolidation Zones:
Identify accumulation or distribution phases where price is consolidating.
Breakout Trading:
Detect potential breakout opportunities and visualize target levels using range extensions.
Support and Resistance:
Use historical ranges as support/resistance zones for future price action.
How to Use:
Copy and paste the script into TradingView (create a new Pine Script v5 indicator).
Add the indicator to your chart and observe the visualized ranges and breakouts.
Adjust the input parameters to align with your trading style or instrument volatility.
Use the extension levels to plan entry, exit, or stop-loss placement for breakout trades.
This indicator is highly versatile and suits traders looking for structured price action analysis. It provides a clear and visually appealing way to track consolidation zones and breakout potential.
Options
D_H_L_OIndicator Name: D_H_L_O
Primary Function:
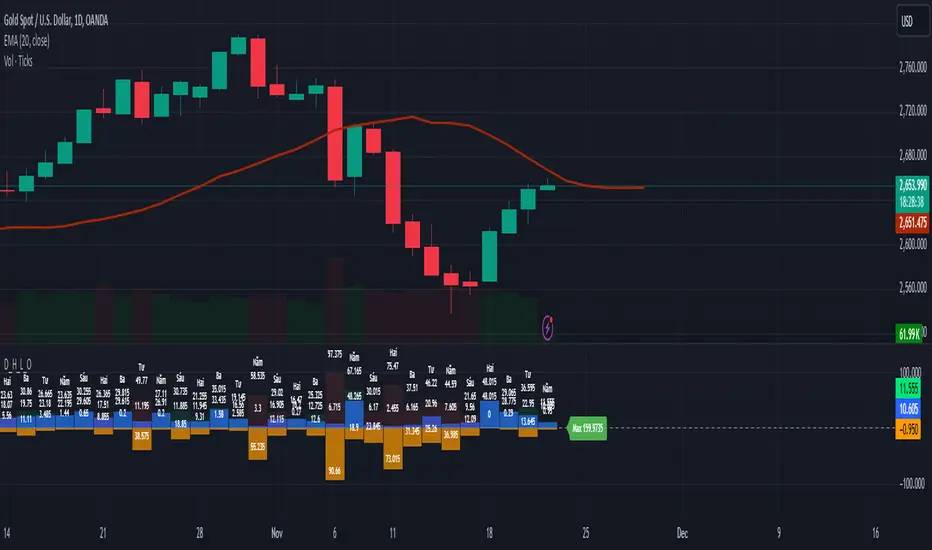
This indicator is designed to display buying pressure, selling pressure, and other key metrics derived from the daily candle on a TradingView chart. It helps you analyze market momentum, buying and selling forces, and price spreads.
Features Overview:
Basic Calculations from Daily Candle:
dailyHigh, dailyLow, dailyOpen, dailyClose: Represent the high, low, open, and close prices of the daily candle.
dailySpread: The difference between the high and low prices of the daily candle.
Buying and Selling Pressure:
Buying Pressure (high_open): The difference between the daily high and the open price.
Selling Pressure (low_open): The absolute difference between the daily low and the open price (displayed as a negative value).
deltaVolume: The net difference between buying and selling pressure.
Color and Visuals:
Blue (buyingColor): Indicates buying pressure for green (bullish) days.
Orange (sellingColor): Indicates selling pressure for red (bearish) days.
Displays bars with transparency to distinguish buying and selling forces.
Neutral Reference Line:
A horizontal line at 0 for quick visual comparison of buying and selling forces.
Labels for Key Information:
Displays values of buying pressure, selling pressure, and daily candle spread directly on the chart at corresponding bar positions.
Includes the weekday name (currentWeekday) for additional time context.
Historical Statistics:
Highest and lowest values of buying and selling pressure across the dataset.
Average buying and selling pressure.
Displays statistical summaries (like maximum pressure values) as labels on the last bar of the chart.
Benefits:
Detailed Market Pressure Visualization: Provides a clear view of the forces driving market movement each day.
Historical Context: Helps analyze historical trends in buying and selling pressures over time.
Decision-Making Support: Use pressure metrics to gauge market momentum and assess potential trends.
How to Use:
Copy and paste the script into TradingView (create a new indicator using Pine Script v5).
Add the indicator to your chart on any timeframe to observe daily candle metrics.
Customize colors, transparency, or other parameters to suit your trading style.
This indicator is ideal for traders who want to analyze price momentum and make decisions based on daily market behavior.
Timing KenhTradding The Timing KenhTradding indicator is a versatile and customizable tool designed to provide detailed insights into market sessions, daily price dynamics, and key levels. This indicator is especially helpful for traders aiming to track volatility, session-specific movements, and broader trends with additional tools like EMA and VWAP.
Key Features
Session Tracking:
Visualizes up to 8 customizable sessions using shaded boxes on the chart.
Sessions are defined by specific time intervals and are labeled with user-defined names and colors for easy identification.
EMA Integration:
Displays two critical exponential moving averages (EMA):
EMA200 (1-minute): Ideal for short-term trend analysis.
EMA200 (4-hour): Provides a broader perspective on market trends.
EMA smoothing options ensure clarity and reduce noise.
Daily High, Low, Open, and Close Levels:
Automatically draws horizontal lines to highlight the daily high, low, and open prices.
Displays these levels with annotations and customizable colors.
Price Movement Representation:
Visualizes daily price movements using boxes for the body, upper wick, and lower wick:
The body shows the range between the open and close.
The upper and lower wicks represent the highs and lows relative to the body.
Annotations display the exact pip/movement size of the wicks.
VWAP Overlay:
Plots the Volume Weighted Average Price (VWAP) to provide a weighted average of price levels based on volume, aiding in intraday decision-making.
Session-Based Background Highlighting:
Highlights specific hours (e.g., 2 AM) with a customizable background color for better visual segmentation.
Dynamic Data Updates:
Updates key levels and boxes dynamically as new price data becomes available.
Benefits for Traders
Session Analysis:
Easily identify and analyze the behavior of price action within specific trading sessions, such as high volatility around news events.
Trend and Momentum Tracking:
Use EMA and VWAP overlays to gauge the direction and strength of the market.
Daily Levels for Precision:
Incorporates high, low, and open levels to assist with setting entry, exit, and stop-loss points.
Visual Clarity:
Simplifies complex market data with clean and intuitive visualizations, enabling traders to make informed decisions quickly.
Customization Options
Sessions:
Define up to 8 custom sessions with personalized labels, time zones, and colors.
Visuals:
Adjust colors, transparency, and line styles for session boxes, EMAs, and daily levels.
Text Details:
Customize text size, alignment, and colors for annotations and labels.
EMA Display:
Toggle between short-term and long-term EMA views.
How to Use It
Track Daily Levels:
Watch for price reactions around daily high, low, and open levels for potential breakout or reversal opportunities.
Session-Based Strategies:
Focus on specific trading sessions for high-probability trades. Use session boxes to identify price ranges and key levels during those times.
Trend Confirmation:
Combine EMA200 and VWAP for a reliable trend-following strategy.
Volatility Assessment:
Observe the size of daily wicks and session ranges to understand market volatility and adjust your strategy accordingly.
This indicator is an essential tool for both intraday and swing traders, offering unparalleled insights into price action, session-specific volatility, and trend dynamics.

Straddle Charts - Live
Description :
This indicator is designed to display live prices for both call and put options of a straddle strategy, helping traders visualize the real-time performance of their options positions. The indicator allows users to select the symbols for specific call and put options and fetches their prices on a 1-minute timeframe, ensuring updated information.
Key Features :
Live Call and Put Option Prices: View individual prices for both call and put options of the straddle, plotted separately.
Straddle Price Calculation: The total price of the straddle (sum of call and put) is displayed, allowing for easy monitoring of the straddle’s combined movement.
Customizable Inputs: Easily change the call and put option symbols directly from the settings.
Use this indicator to stay on top of your straddle's value and make informed trading decisions based on real-time data.

Asset Correlation Prediction Table with EMA & RSI This indicator helps traders monitor short-term trends and predict the next 5-minute candle direction for two assets: USD/JPY and AUD/USD. The prediction is based on a combination of two Exponential Moving Averages (EMAs) and the Relative Strength Index (RSI), offering a simple yet effective method for forecasting price movements.
How the Script Works:
Trend Detection:
EMAs: The script uses two EMAs—one with a 9-period length and another with a 14-period length—to detect trends. A bullish trend is identified when the price is above both EMAs, while a bearish trend is indicated when the price is below both EMAs.
RSI: The script also utilizes the RSI with a 14-period length. An RSI value above 70 signals an overbought condition, and a value below 30 signals an oversold condition. This helps to confirm or reject the trend based on momentum and price conditions.
Next-Candle Prediction:
The script predicts the direction of the next 5-minute candle based on the relationship between the current price, the EMAs, and the RSI values. A bullish prediction is made if both EMAs are trending upwards and the RSI is not overbought. A bearish prediction occurs when both EMAs are trending downward, and the RSI is not oversold.
Table Display:
The script displays a real-time table at the top-right of the chart with the following columns:
Asset: The currency pair being analyzed (USD/JPY or AUD/USD).
EMA & RSI Trend Prediction: Indicates the current trend based on the EMAs and RSI.
Direction: Shows whether the current trend is up, down, or neutral.
Next Candle: A prediction of the likely direction of the next 5-minute candle (bullish, bearish, or neutral).
How to Use the Script:
Add the Indicator: Apply the script to any chart with a 5-minute timeframe. While optimized for USD/JPY and AUD/USD, the script can be adapted to other assets by adjusting the symbol.
Interpret the Table: The table displays the current trend direction and the predicted movement of the next candle. Traders can use these predictions to guide short-term entries and exits.
Customization: Traders can modify the EMA and RSI periods and RSI threshold values to adjust the script for different trading strategies or asset characteristics.
Key Concepts:
Trend Detection: Uses EMAs and RSI to identify the current market trend (bullish, bearish, or neutral).
Next-Candle Prediction: Provides a prediction for the next 5-minute candle’s direction based on trend analysis.
Simple and Effective: Combines well-known indicators (EMA and RSI) for a straightforward trading tool suitable for short-term traders and scalpers.

Stocks & Options P/L TrackerOverview:
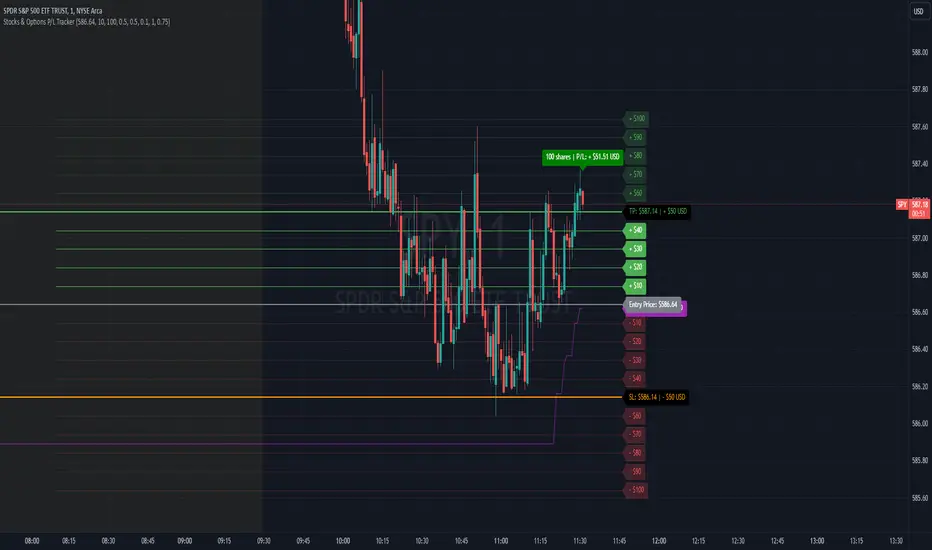
The Stocks & Options P/L Tracker is a custom TradingView indicator developed to offer traders precise tracking of stocks & options trades’ profit and loss in real-time. It features a detailed display of P/L intervals, stop-loss and take-profit levels, and an adaptable trailing stop mechanism to help traders manage risk and optimize their trading strategies. This tool is particularly useful for active traders who seek immediate visual feedback on their trades’ performance.
Key Features:
Real-Time P/L Display: Computes and displays the P/L per contract/share and total P/L dynamically on the chart based on the specified entry price, relative to the current market price, and number of contracts or shares.
Configurable Take Profit and Stop Loss: Users can set take-profit and stop-loss amounts, and the indicator will visually mark these levels with corresponding dollar amounts for easy reference.
Trailing Stop Functionality: Offers an option to enable a trailing stop that automatically adjusts based on price movements.
Interval-Based P/L Tracking: Uses customizable intervals to display projected P/L levels above and below the entry price, helping users understand potential profit or loss scenarios at a glance.
Dynamic Labeling and Alerts: Visual labels are used to mark P/L, take-profit, stop-loss, trailing stop, and entry levels. These labels update dynamically on each new price bar to provide immediate insights into trade performance. NOTE: Due to TradingView's limitations with server-side alerts on fixed prices, dynamic alerts (for Take Profit, Stop Loss, and Trailing Stop) that adjust with price changes are not yet available. Alerts must be manually reset to your desired price each time.
Clean and Responsive Design: Utilizes color-coded labels and lines for P/L intervals, making it easy to distinguish profit, loss, stop, and take-profit zones. Colors adjust automatically to the current price to maintain clarity.
User Input Validation: Ensures appropriate input values for items like entry price, contract/share size, and profit/loss intervals to prevent errors and optimize performance.
Efficient Object Management: Implements object reusability for lines and labels to stay within Pine Script's object limits, ensuring smooth operation and maximum accuracy in real-time tracking.
Automatic Adjustments Based on Market Changes: Calculates and adjusts trailing stop levels dynamically based on highest price movement, which provides traders flexibility while maintaining risk controls.
Trader Benefits:
This indicator empowers traders with a robust tool to manage their trades visually and strategically on TradingView. The real-time feedback and customization options help traders make informed decisions, minimize risks, and maximize potential profits.
Happy Trading! :)
GEX Profile [PRO] Real Auto-Updated Gamma Exposure Levels𝗥𝗲𝗮𝗹 𝗚𝗘𝗫 𝗟𝗲𝘃𝗲𝗹𝘀 𝘄𝗶𝘁𝗵 𝗦𝗲𝗮𝗺𝗹𝗲𝘀𝘀 𝗔𝘂𝘁𝗼-𝗨𝗽𝗱𝗮𝘁𝗲𝘀 𝗳𝗼𝗿 𝗼𝘃𝗲𝗿 𝟭𝟲𝟱+ 𝗼𝗳 𝘁𝗵𝗲 𝗠𝗼𝘀𝘁 𝗟𝗶𝗾𝘂𝗶𝗱 𝗨.𝗦. 𝗠𝗮𝗿𝗸𝗲𝘁 𝗦𝘆𝗺𝗯𝗼𝗹𝘀 (including 𝟬𝗗𝗧𝗘 𝗳𝗼𝗿 𝗦𝗣𝗫, SPY, QQQ, TLT, IWM, etc...)
🔃 Dynamic Updates : Receive precise GEX levels with auto-updating metrics up to 5 times a day throughout the trading session—no manual refresh needed!
🍒 Strategically Developed : Built by experienced options traders to meet the needs of serious options market participants.
🕒 0DTE? No Problem! : Designed with 0DTE traders in mind, our indicator keeps you updated with GEX levels and seamless auto-refresh to capture every crucial market shift.
📈 Optimized for Option Traders : See accurate GEX and NETGEX profiles for multiple expirations to maximize strategic potential.
🔶 Comprehensive GEX Levels
This indicator provides unparalleled insight into market dynamics with levels like Call/Put Support, Resistance, HVL (High Volatility Level), and Call/Put Walls. These levels are auto-updated based on live market movements and reflect gamma shifts and volatility signals essential for options traders.
🔶 Ideal for 0DTE and Multi-Leg Strategies
Track essential GEX levels across expirations with our unique Cumulative (⅀) and Selected Alone (⊙) calculation models. Customize your view to reveal high-impact levels across multiple expirations or focus on a specific expiration for a targeted strategy.
🔶 Coverage of 165+ Highly Liquid U.S. Symbols
Compatible with over 165 U.S. market symbols, including SP:SPX , AMEX:SPY , NASDAQ:QQQ , NASDAQ:TLT , AMEX:GLD , NASDAQ:NVDA , and more. The watchlist is expanding continuously to meet the needs of active traders. List of Compatible Symbols Available Here: www.tradingview.com
🔶How does the indicator work and why is it unique?
This is not just another GEX indicator. It incorporates 15min delayed option chain data from ORATS as data provider, processes and refines the delayed data package using pineseed, and sends it to TradingView, visualizing the key GEX levels using specific formulas (see detailed below). This method of incorporating options data into a visualization framework is unique and entirely innovative on TradingView.
Unlike other providers that only set GEX levels at market open, this indicator adjusts dynamically throughout the day, providing updated insights across the trading day and capturing gamma shifts as the market moves.
_________________________________
-----------------------------------------------
🌑 𝗗 𝗢 𝗖 𝗨 𝗠 𝗘 𝗡 𝗧 𝗔 𝗧 𝗜 𝗢 𝗡 🌑
-----------------------------------------------
_________________________________
🔶 Understanding GEX (Gamma Exposure) and Gamma Profiling
Gamma Exposure (GEX) is a crucial concept in options trading because it reveals how options market positions can influence the dynamics of asset prices. In essence, GEX measures the collective gamma exposure of options market participants, impacting overall market stability and price movements.
🔹 What is GEX?
At its core, GEX captures the aggregate impact of gamma, a key options Greek, which tells us how an option's delta changes in response to price movements in the underlying asset. Positive or negative GEX levels can reflect the collective bullish or bearish stance of the market:
Positive GEX (far above HVL) : Indicates a net bullish positioning by options holders. When GEX is strongly positive, it suggests that as the asset price increases, market participants might need to buy more of the asset to maintain their hedges. This behavior can fuel further upward momentum.
Negative GEX (far below HVL) : Implies a net bearish positioning. In a strongly negative GEX environment, declines in the asset's price might prompt participants to sell, potentially exacerbating the downward movement.
🔹 The Influence of GEX on Strike Prices and Expiration
A unique feature of GEX is its impact near expiration dates. As options approach expiration, GEX levels can “pin” the price to specific strike levels, where options positions are concentrated. This pinning effect arises as market makers adjust their hedging strategies, often causing the asset price to gravitate towards certain strike prices, where a large volume of options contracts sits.
🟨 Overview of our GEX Calculation Models for Options Traders 🟨
Our GEX indicator models were developed with serious options traders in mind, providing flexibility beyond typical GEX providers. We know that using GEX levels for multi-leg strategies, where the underlying doesn't need a strong trend to be profitable , calls for a nuanced approach that aligns with different trading horizons. Here’s a detailed breakdown of our GEX calculation models and how they support strategic trading across varying timeframes.
Thus, the HVL an orher CALL/PUT WALLS depends on the indicator's selected calculation mode and expiration. The NETGEX profile of the chosen expiration appears on the HVL line , which automatically updates five times during trading hours , except for 0DTE, which reflects the value set at market open.
🔶 Cumulative Expiration (⅀) Calculation Method
This method aggregates GEX data for all expirations up to the selected date , giving you a more comprehensive view of market dynamics. We recommend using this method, as it allows you to see how combined expirations impact GEX levels, which can be critical when setting up trades with a longer time horizon.
🔶 Selected Alone (⊙) Calculation Method
This option displays the GEX profile specific to only the chosen expiration , providing a unique, time-bound view. This approach is ideal for those seeking precise insight into how an individual expiration is performing without the broader context of other expirations.
🔶 Example of using calculation methods:
With options trading, especially for multi-leg strategies, choosing the right expiration and calculation model is crucial. Let’s break down an example:
Suppose you’re considering a Friday (4DTE) front-leg diagonal on the SPX at the start of the week. In this case, the focus isn’t strictly on any single expiration (like 0DTE or 4DTE individually), but rather on what might happen cumulatively by Friday across all expirations . Here, the Cumulative Expiration (⅀) model comes into play, as it shows you an aggregated view of the GEX profile, factoring in all strikes and legs for all expirations leading up to the selected date.
For most use cases, we recommend setting your indicator to the Cumulative (⅀) model , which provides a broad and insightful look at GEX levels across multiple expirations. However, you can always switch to Selected Alone (⊙) for targeted analysis of an individual expiration. Remember, 0DTE defaults to “Selected Alone”, and Every Expiry always shows a cumulative value by default.
_________________________________
-----------------------------------------------
🟦 HVL (High Volatility Level) 🟦
Also known as the Gamma FLIP level or Zero Gamma , it represents the price level at which the gamma environment transitions from positive to negative or vice versa. The High Volatility Level (HVL) is a critical point for understanding gamma shifts and anticipating volatility. This shift influences how market makers hedge their positions, potentially increasing or dampening market volatility.
🔷 Understanding the Gamma Flip and HVL
At its core, the gamma flip represents the point where market makers may transition from a net positive to a net negative gamma position, or the reverse. When prices move above HVL, gamma is positive, often leading to lower volatility due to the stabilizing effects of market makers’ hedging. Conversely, when prices drop below HVL, gamma flips negative, and hedging by market makers can amplify volatility as they trade with the direction of price movements.
The HVL (High Volatility Level) is particularly important as it signals a shift in the impact of price movements on the GEX profile. Using the cumulative calculation mode, GEX values are aggregated across all strikes and expirations up to the selected expiration, helping to pinpoint the point where the GEX curve's slope changes from negative to positive.
🔷 Implications for Traders and Market Makers
For market makers, crossing below HVL into a negative gamma zone means that they hedge in the same direction as price movements, potentially amplifying volatility. For traders, understanding HVL's role is essential to choosing strategies that align with the prevailing volatility regime:
Positive GEX 🟢:
Above HVL, where GEX is positive, market makers hedge by buying stocks as prices fall and selling as prices rise. This has a stabilizing effect, creating a lower-volatility environment.
Negative GEX 🔴:
Below HVL, where GEX is negative, market makers' hedging aligns with price movements, increasing volatility. Here, they buy as prices rise and sell as they fall, reinforcing price direction.
🔷 HVL as a Momentum and Volatility Indicator
The HVL offers traders insight into potential shifts in market momentum. For example, above HVL, if the price increases, Net GEX also rises, which stabilizes prices as market makers hedge in opposition to price direction. Below HVL, however, a price rise decreases Net GEX, creating conditions where market makers’ hedging amplifies price movements, resulting in a more volatile environment.
HVL also acts as a significant support level, often preceding put supports. If the price falls below this level, traders may expect heightened volatility and increased bearish sentiment.
Knowing the location of HVL is vital for positioning yourself on the right side of volatility. By monitoring the HVL, traders can better anticipate shifts in sentiment and align strategies with prevailing market dynamics.
_________________________________
-----------------------------------------------
🟩 Call Resistance and Call Wall Levels 🟩
In options trading, understanding GEX levels like Call Resistance and Call Wall levels is crucial for navigating potential price inflection points. Our indicator provides these levels directly on your chart, allowing you to customize and optimize your trading approach. Here’s a detailed guide to help you understand and use Call Resistance and additional Call Wall levels effectively.
🟢 Call Resistance Level
The Call Resistance Level is a key point where our model indicates heightened Call GEX concentration. This level serves as a potential resistance area where price movement may face a barrier, slowing or even reversing before a breakout. Here’s how the Call Resistance Level can influence market behavior:
Resistance and Price Reversal ⬇️ : Similar to the Put Support level, the Call Resistance acts as a "sticky" price level, where upward movement encounters resistance. When the price approaches this level, it’s common for market makers to begin shorting to maintain delta neutrality. This shorting activity, combined with the potential monetization of calls, introduces a technical bearish force in the short term, often causing the price to bounce downward.
Upside Acceleration Point ⬆️ : If investors reposition calls to higher strikes as the price reaches Call Resistance, this level can roll up, allowing the price to push upward and potentially accelerating the rally. This effect can drive the market to higher levels as market makers adjust their positions accordingly.
🟢 Additional Call Wall Levels
Our model identifies the second and third-highest Call GEX levels, known as additional Call Walls. These levels are often secondary resistance points but hold significance as they add layers of possible resistance or breakout points. They offer similar potential as the primary Call Resistance level, acting as either:
Resistance Zones: Slowing the price momentum as it approaches these levels.
Inflection Points for Upside Momentum: Allowing for a possible continuation of upward movement if prices break through.
🟢 How to Trade the Call Resistance Level
To use the Call Resistance level effectively, look for possible price rejections or consolidations as the price approaches this zone. Here are the main scenarios:
Bounce to Downside: As the price nears the Call Resistance level, market makers’ delta-hedging activity (through shorting) can turn this level into a short-term bearish force, leading to price pullbacks.
Rolling the Position: For bulls, a key objective at the Call Resistance level is to see investors roll their call positions higher, effectively moving the resistance up. This repositioning may lead to incremental price gains as the Call Resistance level rises with each roll.
_________________________________
-----------------------------------------------
🟥 Put Support and Put Wall Levels 🟥
In options trading, understanding GEX levels like Put Support and secondary Put Wall levels is essential for managing potential price support points and gauging downside risk. Our indicator places these levels directly on your chart, allowing for customization to enhance your trading strategy. Here’s a detailed guide to help you leverage the Put Support and additional Put Wall levels effectively.
🔴 Put Support Level
The Put Support Level is a key zone where our model shows the highest concentration of negative GEX, representing an area with substantial put option interest. This level functions as a potential support zone, where price may stabilize or bounce upward, or as an inflection point, signaling increased downside momentum. Here’s how the Put Support Level can affect market behavior:
Support and Price Reversal🔺 : Similar to how Call Resistance operates on the upside, the Put Support Level often acts as a "sticky" level on the downside, where price finds support. As the asset price moves closer to this level, market makers begin adjusting their positions, frequently buying to maintain delta neutrality. This activity can create a temporary short squeeze, pushing prices back up.
Downside Acceleration Point 🔻 : If the asset continues moving lower, triggering more hedging activity, this level can become a tipping point for accelerated downside momentum.
🔴 Additional Put Wall Levels
Our model also identifies the second and third-highest negative GEX levels, known as secondary Put Walls. These levels are often seen as secondary support points and hold significance by adding layers of support or potential downside inflection points. Like the primary Put Support Level, they can act in two ways:
Support Zones: Helping slow price declines as they approach these levels.
Downside Inflection Points: Allowing further price decline if the support fails.
🔴 How Investors Hedge with Put Options
Investors commonly use put options to hedge long positions and protect portfolios, especially during times of market stress when implied volatility rises. This demand for puts increases the Put Skew, as market makers short to remain delta hedged.
As prices approach the Put Support Level, the hedging activity often intensifies because more puts become At the Money (ATM) or In the Money (ITM). To realize the value of their hedges, investors typically monetize these puts at this level, triggering the closing of short positions by market makers and resulting in a price bounce.
🔴 The Role of Implied Volatility
Implied Volatility (IV) is also a critical factor since it directly influences market flows. If IV driving put flows decreases, market makers may buy back shorts, which contributes to the bounce at the Put Support Level. Additionally, another Greek, Vanna—representing changes in delta due to IV shifts—plays a vital role here. As IV changes, Vanna affects delta-hedging adjustments, adding a layer of complexity to understanding market makers' actions around these support levels.
🔴 Possible Price Scenarios at the Put Support Level
When the price reaches the Put Support Level, there are generally two scenarios:
Bounce to Upside🔺 : The Put Support Level is where substantial put hedging activity happens. As prices approach, market makers adjust their delta by buying, which can push prices back up.
Roll Positions🔻 : After monetizing puts, investors have two options: roll hedges to higher strikes if they expect a bullish move, or open new out-of-the-money puts at lower strikes. If new hedges are set at lower levels, the Put Support level may also shift lower, creating a new bearish force as market makers begin hedging these new positions.
🟨 Customizing Put Support/Call Resistance and Put/Call Wall Levels on Your Chart
Our indicator settings provide extensive customization options for displaying Put Support, Call Resistance, and Put/Call Wall levels.
You can:
adjust the depth to highlight the highest positive or negative NETGEX levels
choose to display relative data, show only the colored strike line
adjust the offset for enhanced visibility.
This flexibility helps you focus on the critical details that best align with your trading strategy, ensuring a clearer and more tailored view of the GEX levels on your chart.
Currently, we examine the top three levels with the highest positive and negative NETGEX values, allowing you to view seven key GEX levels on your chart (3 Call + 1 HVL + 3 Put). However, in the near future, we plan to expand this to seven levels per side, resulting in a total of up to 15 significant GEX levels on the chart instead of the current 7. This enhancement will cater to all needs, especially benefiting 0DTE traders.
_________________________________
-----------------------------------------------
🔶 ADDITIONAL IMPORTANT COMMENTS
🔹- Why is there a slight difference between the displayed data and other GEX provider's data like MenthorQ, GammaEdge, SpotGamma, GEXBot, etc?
There are two reasons for this, and one is beyond our control:
🔹 (1) Option-data update frequency:
According to TradingView's regulations and guidelines, we can update external data a maximum of 5 times per day. We strive to use these updates in the most optimal way:
(1st update) 15 minutes after U.S. market open
(2nd, 3rd, 4th updates) 1.5–3 hours during U.S. market open hours
(5th update) 10 minutes before U.S. market close.
You don’t need to refresh your window; our latest refreshed data pack is always automatically applied to your indicator. You can see the time elapsed since the last update by hovering over the HVL.
🔹 (2) GEX Levels with Intraday Updates Based on Price Movements
The TanukiTrade Options GEX Indicator for TradingView provides open interest data with a 15-minute delay after the market opens. Using this data, we calculate and update the relevant levels throughout the trading day, reflecting almost real-time price changes and gamma values. Unlike other GEX providers, who set their GEX levels solely at market open without further updates, we dynamically adjust our levels intraday to capture significant price shifts.
🔹 Automatic & Seamless Intraday Updates and Special Cases
For our indicator, the HVL (High Volatility Level) reflects the selected calculation mode and expiration. We update these NETGEX profiles five times throughout the trading day, with one exception: 0DTE data, which is set at market open and does not update intraday due to the rapid narrowing of gamma levels . Note that similar to other GEX providers, our 0DTE remains fixed at open, while cumulative values update during the day based on almost real-time market movements.
🔹Consistent SPX 0DTE GEX Levels with Morning Open Interest Updates Only
For SPX, the 0DTE (Zero Days to Expiration) options and GEX levels are calculated based on openinterest data provided by the clearinghouse at market open. Due to the exponential narrowing of gamma levels throughout the day, we do not update these levels intraday, unlike other expirations. Therefore, if you select the expiring contract on that day, you’ll see the exact morning level, as it was calculated at market open. This status is also published the previous evening, based on the data available then, so you can already view the levels for the following day’s 1DTE (next day’s 0DTE) before market close. After market open, around 15 minutes later, this level is updated with the latest open interest data and remains unchanged for the rest of the day. Other providers take a similar approach. We do not support intraday volume-based GEX calculations, as our benchmarks show this can produce misleading results.
Disclaimer:
Our option indicator uses approximately 15min-3 hour delayed option market snapshot data to calculate the main option metrics. Exact realtime option contract prices are never displayed; only derived GEX metrics are shown to ensure accurate and consistent visualization. Due to the above, this indicator can only be used for decision support; exclusive decisions cannot be made based on this indicator. We reserve the right to make errors.This indicator is designed for options traders who understand what they are doing. It assumes that they are familiar with options and can make well-informed, independent decisions. We work with paid delayed data and we are not a data provider; therefore, we do not bear any financial or other liability.

GEX Profile [Lite] Real Auto-Updated Gamma Exposure LevelsReal GEX Levels with Seamless Auto-updates for 5 U.S. market symbols (AAPL, TSLA, ORCL, DIA, AMZN)
🔃 Dynamic Updates : Receive precise GEX levels with auto-updating metrics up to 5 times a day throughout the trading session—no manual refresh needed!
🍒 Strategically Developed : Built by experienced options traders to meet the needs of serious options market participants.
🕒 0DTE? No Problem! : Designed with 0DTE traders in mind, our indicator keeps you updated with GEX levels and seamless auto-refresh to capture every crucial market shift.
📈 Optimized for Option Traders : See accurate NETGEX profile for multiple expirations to maximize strategic potential.
🔶 Comprehensive GEX Levels
This indicator provides unparalleled insight into market dynamics with levels like Call/Put Support, Resistance, HVL (High Volatility Level), and Call/Put Walls. These levels are auto-updated based on live market movements and reflect gamma shifts and volatility signals essential for options traders.
🔶 Ticker Information:
This 'Lite' indicator is currently only available for 5 liquid U.S. market smbols:
NASDAQ:TSLA NASDAQ:AAPL NASDAQ:AMZN AMEX:DIA and NYSE:ORCL
🔶 Ideal for 0DTE and Multi-Leg Strategies
Track essential GEX levels across expirations with our unique Cumulative (⅀) and Selected Alone (⊙) calculation models. Customize your view to reveal high-impact levels across multiple expirations or focus on a specific expiration for a targeted strategy.
🔶How does the indicator work and why is it unique?
This is not just another GEX indicator. It incorporates 15min delayed option chain data from ORATS as data provider, processes and refines the delayed data package using pineseed, and sends it to TradingView, visualizing the key GEX levels using specific formulas (see detailed below). This method of incorporating options data into a visualization framework is unique and entirely innovative on TradingView.
Unlike other providers that only set GEX levels at market open, this indicator adjusts dynamically throughout the day, providing updated insights across the trading day and capturing gamma shifts as the market moves.
_________________________________
-----------------------------------------------
🌑 𝗗 𝗢 𝗖 𝗨 𝗠 𝗘 𝗡 𝗧 𝗔 𝗧 𝗜 𝗢 𝗡 🌑
-----------------------------------------------
_________________________________
🔶 Understanding GEX (Gamma Exposure) and Gamma Profiling
Gamma Exposure (GEX) is a crucial concept in options trading because it reveals how options market positions can influence the dynamics of asset prices. In essence, GEX measures the collective gamma exposure of options market participants, impacting overall market stability and price movements.
🔹 What is GEX?
At its core, GEX captures the aggregate impact of gamma, a key options Greek, which tells us how an option's delta changes in response to price movements in the underlying asset. Positive or negative GEX levels can reflect the collective bullish or bearish stance of the market:
Positive GEX (far above HVL) : Indicates a net bullish positioning by options holders. When GEX is strongly positive, it suggests that as the asset price increases, market participants might need to buy more of the asset to maintain their hedges. This behavior can fuel further upward momentum.
Negative GEX (far below HVL) : Implies a net bearish positioning. In a strongly negative GEX environment, declines in the asset's price might prompt participants to sell, potentially exacerbating the downward movement.
🔹 The Influence of GEX on Strike Prices and Expiration
A unique feature of GEX is its impact near expiration dates. As options approach expiration, GEX levels can “pin” the price to specific strike levels, where options positions are concentrated. This pinning effect arises as market makers adjust their hedging strategies, often causing the asset price to gravitate towards certain strike prices, where a large volume of options contracts sits.
🟨 Overview of our GEX Calculation Models for Options Traders 🟨
Our GEX indicator models were developed with serious options traders in mind, providing flexibility beyond typical GEX providers. We know that using GEX levels for multi-leg strategies, where the underlying doesn't need a strong trend to be profitable , calls for a nuanced approach that aligns with different trading horizons. Here’s a detailed breakdown of our GEX calculation models and how they support strategic trading across varying timeframes.
Thus, the HVL an orher CALL/PUT WALLS depends on the indicator's selected calculation mode and expiration. The NETGEX profile of the chosen expiration appears on the HVL line , which automatically updates five times during trading hours , except for 0DTE, which reflects the value set at market open.
🔶 Cumulative Expiration (⅀) Calculation Method
This method aggregates GEX data for all expirations up to the selected date , giving you a more comprehensive view of market dynamics. We recommend using this method, as it allows you to see how combined expirations impact GEX levels, which can be critical when setting up trades with a longer time horizon.
🔶 Selected Alone (⊙) Calculation Method
This option displays the GEX profile specific to only the chosen expiration , providing a unique, time-bound view. This approach is ideal for those seeking precise insight into how an individual expiration is performing without the broader context of other expirations.
🔶 Example of using calculation methods:
With options trading, especially for multi-leg strategies, choosing the right expiration and calculation model is crucial. Let’s break down an example:
Suppose you’re considering a Friday (4DTE) front-leg diagonal on the SPX at the start of the week. In this case, the focus isn’t strictly on any single expiration (like 0DTE or 4DTE individually), but rather on what might happen cumulatively by Friday across all expirations . Here, the Cumulative Expiration (⅀) model comes into play, as it shows you an aggregated view of the GEX profile, factoring in all strikes and legs for all expirations leading up to the selected date.
For most use cases, we recommend setting your indicator to the Cumulative (⅀) model , which provides a broad and insightful look at GEX levels across multiple expirations. However, you can always switch to Selected Alone (⊙) for targeted analysis of an individual expiration. Remember, 0DTE defaults to “Selected Alone”, and Every Expiry always shows a cumulative value by default.
_________________________________
-----------------------------------------------
🟦 HVL (High Volatility Level) 🟦
Also known as the Gamma FLIP level or Zero Gamma , it represents the price level at which the gamma environment transitions from positive to negative or vice versa. The High Volatility Level (HVL) is a critical point for understanding gamma shifts and anticipating volatility. This shift influences how market makers hedge their positions, potentially increasing or dampening market volatility.
🔷 Understanding the Gamma Flip and HVL
At its core, the gamma flip represents the point where market makers may transition from a net positive to a net negative gamma position, or the reverse. When prices move above HVL, gamma is positive, often leading to lower volatility due to the stabilizing effects of market makers’ hedging. Conversely, when prices drop below HVL, gamma flips negative, and hedging by market makers can amplify volatility as they trade with the direction of price movements.
The HVL (High Volatility Level) is particularly important as it signals a shift in the impact of price movements on the GEX profile. Using the cumulative calculation mode, GEX values are aggregated across all strikes and expirations up to the selected expiration, helping to pinpoint the point where the GEX curve's slope changes from negative to positive.
🔷 Implications for Traders and Market Makers
For market makers, crossing below HVL into a negative gamma zone means that they hedge in the same direction as price movements, potentially amplifying volatility. For traders, understanding HVL's role is essential to choosing strategies that align with the prevailing volatility regime:
Positive GEX 🟢:
Above HVL, where GEX is positive, market makers hedge by buying stocks as prices fall and selling as prices rise. This has a stabilizing effect, creating a lower-volatility environment.
Negative GEX 🔴:
Below HVL, where GEX is negative, market makers' hedging aligns with price movements, increasing volatility. Here, they buy as prices rise and sell as they fall, reinforcing price direction.
🔷 HVL as a Momentum and Volatility Indicator
The HVL offers traders insight into potential shifts in market momentum. For example, above HVL, if the price increases, Net GEX also rises, which stabilizes prices as market makers hedge in opposition to price direction. Below HVL, however, a price rise decreases Net GEX, creating conditions where market makers’ hedging amplifies price movements, resulting in a more volatile environment.
HVL also acts as a significant support level, often preceding put supports. If the price falls below this level, traders may expect heightened volatility and increased bearish sentiment.
Knowing the location of HVL is vital for positioning yourself on the right side of volatility. By monitoring the HVL, traders can better anticipate shifts in sentiment and align strategies with prevailing market dynamics.
_________________________________
-----------------------------------------------
🟩 Call Resistance and Call Wall Levels 🟩
In options trading, understanding GEX levels like Call Resistance and Call Wall levels is crucial for navigating potential price inflection points. Our indicator provides these levels directly on your chart, allowing you to customize and optimize your trading approach. Here’s a detailed guide to help you understand and use Call Resistance and additional Call Wall levels effectively.
🟢 Call Resistance Level
The Call Resistance Level is a key point where our model indicates heightened Call GEX concentration. This level serves as a potential resistance area where price movement may face a barrier, slowing or even reversing before a breakout. Here’s how the Call Resistance Level can influence market behavior:
Resistance and Price Reversal ⬇️ : Similar to the Put Support level, the Call Resistance acts as a "sticky" price level, where upward movement encounters resistance. When the price approaches this level, it’s common for market makers to begin shorting to maintain delta neutrality. This shorting activity, combined with the potential monetization of calls, introduces a technical bearish force in the short term, often causing the price to bounce downward.
Upside Acceleration Point ⬆️ : If investors reposition calls to higher strikes as the price reaches Call Resistance, this level can roll up, allowing the price to push upward and potentially accelerating the rally. This effect can drive the market to higher levels as market makers adjust their positions accordingly.
🟢 Additional Call Wall Levels
Our model identifies the second and third-highest Call GEX levels, known as additional Call Walls. These levels are often secondary resistance points but hold significance as they add layers of possible resistance or breakout points. They offer similar potential as the primary Call Resistance level, acting as either:
Resistance Zones: Slowing the price momentum as it approaches these levels.
Inflection Points for Upside Momentum: Allowing for a possible continuation of upward movement if prices break through.
🟢 How to Trade the Call Resistance Level
To use the Call Resistance level effectively, look for possible price rejections or consolidations as the price approaches this zone. Here are the main scenarios:
Bounce to Downside: As the price nears the Call Resistance level, market makers’ delta-hedging activity (through shorting) can turn this level into a short-term bearish force, leading to price pullbacks.
Rolling the Position: For bulls, a key objective at the Call Resistance level is to see investors roll their call positions higher, effectively moving the resistance up. This repositioning may lead to incremental price gains as the Call Resistance level rises with each roll.
_________________________________
-----------------------------------------------
🟥 Put Support and Put Wall Levels 🟥
In options trading, understanding GEX levels like Put Support and secondary Put Wall levels is essential for managing potential price support points and gauging downside risk. Our indicator places these levels directly on your chart, allowing for customization to enhance your trading strategy. Here’s a detailed guide to help you leverage the Put Support and additional Put Wall levels effectively.
🔴 Put Support Level
The Put Support Level is a key zone where our model shows the highest concentration of negative GEX, representing an area with substantial put option interest. This level functions as a potential support zone, where price may stabilize or bounce upward, or as an inflection point, signaling increased downside momentum. Here’s how the Put Support Level can affect market behavior:
Support and Price Reversal🔺 : Similar to how Call Resistance operates on the upside, the Put Support Level often acts as a "sticky" level on the downside, where price finds support. As the asset price moves closer to this level, market makers begin adjusting their positions, frequently buying to maintain delta neutrality. This activity can create a temporary short squeeze, pushing prices back up.
Downside Acceleration Point 🔻 : If the asset continues moving lower, triggering more hedging activity, this level can become a tipping point for accelerated downside momentum.
🔴 Additional Put Wall Levels
Our model also identifies the second and third-highest negative GEX levels, known as secondary Put Walls. These levels are often seen as secondary support points and hold significance by adding layers of support or potential downside inflection points. Like the primary Put Support Level, they can act in two ways:
Support Zones: Helping slow price declines as they approach these levels.
Downside Inflection Points: Allowing further price decline if the support fails.
🔴 How Investors Hedge with Put Options
Investors commonly use put options to hedge long positions and protect portfolios, especially during times of market stress when implied volatility rises. This demand for puts increases the Put Skew, as market makers short to remain delta hedged.
As prices approach the Put Support Level, the hedging activity often intensifies because more puts become At the Money (ATM) or In the Money (ITM). To realize the value of their hedges, investors typically monetize these puts at this level, triggering the closing of short positions by market makers and resulting in a price bounce.
🔴 The Role of Implied Volatility
Implied Volatility (IV) is also a critical factor since it directly influences market flows. If IV driving put flows decreases, market makers may buy back shorts, which contributes to the bounce at the Put Support Level. Additionally, another Greek, Vanna—representing changes in delta due to IV shifts—plays a vital role here. As IV changes, Vanna affects delta-hedging adjustments, adding a layer of complexity to understanding market makers' actions around these support levels.
🔴 Possible Price Scenarios at the Put Support Level
When the price reaches the Put Support Level, there are generally two scenarios:
Bounce to Upside🔺 : The Put Support Level is where substantial put hedging activity happens. As prices approach, market makers adjust their delta by buying, which can push prices back up.
Roll Positions🔻 : After monetizing puts, investors have two options: roll hedges to higher strikes if they expect a bullish move, or open new out-of-the-money puts at lower strikes. If new hedges are set at lower levels, the Put Support level may also shift lower, creating a new bearish force as market makers begin hedging these new positions.
🟨 Customizing Put Support/Call Resistance and Put/Call Wall Levels on Your Chart
Our indicator settings provide extensive customization options for displaying Put Support, Call Resistance, and Put/Call Wall levels.
You can:
adjust the depth to highlight the highest positive or negative NETGEX levels
choose to display relative data, show only the colored strike line
adjust the offset for enhanced visibility.
This flexibility helps you focus on the critical details that best align with your trading strategy, ensuring a clearer and more tailored view of the GEX levels on your chart.
Currently, we examine the top three levels with the highest positive and negative NETGEX values, allowing you to view seven key GEX levels on your chart (3 Call + 1 HVL + 3 Put). However, in the near future, we plan to expand this to seven levels per side, resulting in a total of up to 15 significant GEX levels on the chart instead of the current 7. This enhancement will cater to all needs, especially benefiting 0DTE traders.
_________________________________
-----------------------------------------------
🔶 ADDITIONAL IMPORTANT COMMENTS
🔹- Why is there a slight difference between the displayed data and other GEX provider's data like MenthorQ, GammaEdge, SpotGamma, GEXBot, etc?
There are two reasons for this, and one is beyond our control:
🔹 (1) Option-data update frequency:
According to TradingView's regulations and guidelines, we can update external data a maximum of 5 times per day. We strive to use these updates in the most optimal way:
(1st update) 15 minutes after U.S. market open
(2nd, 3rd, 4th updates) 1.5–3 hours during U.S. market open hours
(5th update) 10 minutes before U.S. market close.
You don’t need to refresh your window; our latest refreshed data pack is always automatically applied to your indicator. You can see the time elapsed since the last update by hovering over the HVL.
🔹 (2) GEX Levels with Intraday Updates Based on Price Movements
The TanukiTrade Options GEX Indicator for TradingView provides open interest data with a 15-minute delay after the market opens. Using this data, we calculate and update the relevant levels throughout the trading day, reflecting almost real-time price changes and gamma values. Unlike other GEX providers, who set their GEX levels solely at market open without further updates, we dynamically adjust our levels intraday to capture significant price shifts.
🔹 Automatic & Seamless Intraday Updates and Special Cases
For our indicator, the HVL (High Volatility Level) reflects the selected calculation mode and expiration. We update these NETGEX profiles five times throughout the trading day, with one exception: 0DTE data, which is set at market open and does not update intraday due to the rapid narrowing of gamma levels . Note that similar to other GEX providers, our 0DTE remains fixed at open, while cumulative values update during the day based on almost real-time market movements.
Disclaimer:
Our option indicator uses approximately 15min-3 hour delayed option market snapshot data to calculate the main option metrics. Exact realtime option contract prices are never displayed; only derived GEX metrics are shown to ensure accurate and consistent visualization. Due to the above, this indicator can only be used for decision support; exclusive decisions cannot be made based on this indicator. We reserve the right to make errors.This indicator is designed for options traders who understand what they are doing. It assumes that they are familiar with options and can make well-informed, independent decisions. We work with paid delayed data and we are not a data provider; therefore, we do not bear any financial or other liability.

Trade Manager 2Hi Traders,
this manager will make it easier for you to enter lots into your trading platform. Just go to the indicator settings, set your trading account amount, RRR, % risk and then give ok. If you then know where you want to put the stop loss then reopen, enter the value and hit ok again. The chart will show you exactly the stop loss and take profit as you wanted. The stop loss will always stay where you enter it and the take profit will move with the lot size as the price goes further or closer to the stop loss.
This should help when entering the number of lots, TP, SL into the platform.

aPortfolioaPortfolio can be overlayed on any chart with any timeframe. It provides a way to keep track of your portfolio(s) real-time and dynamically. Tool tips provide information about each input item.
Up to 8 customizable assets can be defined using 2 exchanges. The amount owned, the exchange used and the amount spent (in Euro or US Dollar) can be entered per asset.
Furthermore, available Euros and US Dollars can be entered as part of your portfolio.
The output consists of a label and a table , which can both be configured or switched off.
The label is being displayed at the current bar and price on the chart. It can show various totals and a total profit percentage.
The table display position can be set to “AUTO” or to a fixed customizable position. Per used asset, it can show the amount, value in BTC, value in Euro, value in US Dollar and value in a customizable currency. Also, the profit percentage and the percentage of the total portfolio value of an asset can be shown.
The total line shows the values and the profit percentage of the whole portfolio.
In the VIEW options, on the bottom of the settings/inputs window, the coloring can be customized. The profit percentages provide dynamic coloring.
It is also possible to use the EU (#.###,#) format in stead of the US format for numbers.
Although it has its limitations, aPortfolio might be useful and conveniently provides real-time insight.
GuidoN - October 2024

High Volume Strikes - NovaTheMachineConverts your inputs into Horizontal Lines on a chart, Creates a table to indicate all known levels input & tell you how far away you are from each level.
This is a quality of life indicator, not a signal, or trend indicator.
In order for the indicator to plot the levels correctly, please use the following format (Where '$TICKER' is replaced by your instrument of choice such as ' AMEX:SPY ', and 'value' is a positive number with up to 2 decimal places, such as '123.45';
"$TICKER: Golden Strike:value, HVOL Upper:value, HVOL Lower:value, MVC:value, MVP:value, CVR Upper:value, CVR Lower:value, PVR Upper:value, PVR Lower:value, Block 1:value, Block 2:value, Block 3:value, Block 4:value, Block 5:value, Block 6:value"
These Key Levels described below, are values You must determine yourself via Options Chain Volume Analysis
MVC: Most Volume Call - Single Strike with Highest Volume Traded on Call Side
MVP: Most Volume Put - Single Strike with Highest Volume Traded on Put Side
Golden Strike: When MVC = MVP, otherwise = The Sum of (MVP + MVC)/2
HVOL Range: The Range in which Strikes are traded most on both Call & Put sides
PVR: The Total useful Range that is un-interrupted on both Call & Put sides
CVR: The Range of Strikes that is un-interrupted on both Call & Puts sides for the Next Expiry
Blocks: Individual Blocks that may be of significant Volume, on either Call or Put sides, outside the range of CVR & PVR

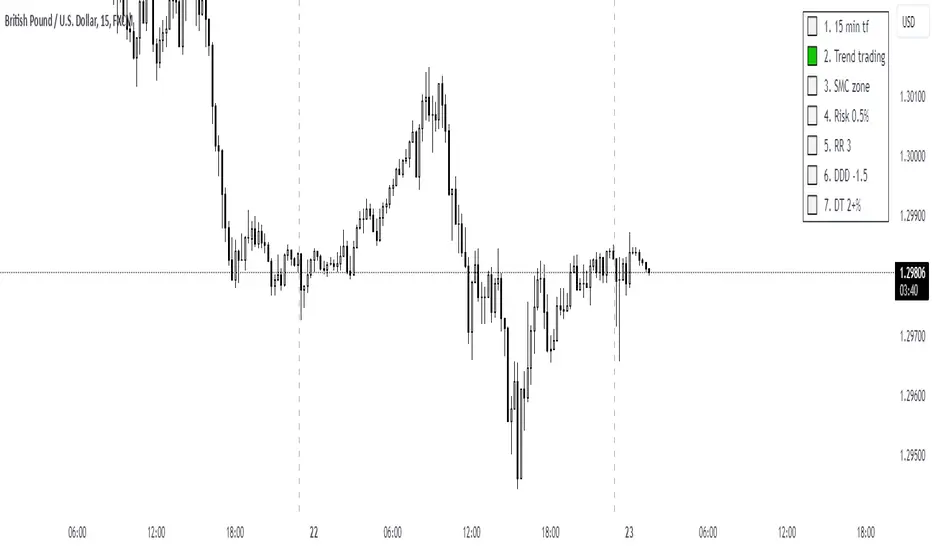
UTC Discipline TradingReminder for Disciplined Trading:
1.Trend Trading – We only open positions in the direction of the trend to take advantage of market momentum.
2.SMC Zones – We trade only within zones defined by the Smart Money Concept (SMC) indicator, identifying key market points.
3.Risk 0.5% – Each position carries a maximum risk of 0.5% of total capital, minimizing potential losses and maintaining risk control.
4.3RR – Every trade must have a risk-to-reward ratio (RR) of 3:1, meaning the potential reward should be three times greater than the risk.
5.DDD -1.5% – When the daily loss reaches -1.5%, trading for the day is closed to avoid further losses.
6.DW 2+% – When daily profit reaches 2%, trading for the day ends. However, if profit exceeds 2%, you may risk an additional amount, and in case of a loss, the day will close with at least 2% profit.
Option Delta Candles [Luxmi AI]Introduction
In the world of options trading, understanding how an option’s price changes with various factors is crucial. One of the key metrics traders use is **Delta**, which measures the sensitivity of an option’s price to changes in the price of the underlying asset. This blog explores an Option Delta Indicator with an Exponential Moving Average (EMA), including its uses, how it works, and its potential limitations.
What is the Option Delta Indicator?
Delta is one of the "Greeks" used in options trading to gauge the risk and behavior of options. It indicates how much an option's price is expected to change for a one-point move in the underlying asset's price. Specifically:
- Call Option Delta: A positive value indicating that the option's price increases as the underlying price increases.
- Put Option Delta: A negative value indicating that the option's price decreases as the underlying price increases.
Key Features of the Indicator
Delta Calculation
The Option Delta Indicator calculates the delta of a call option using the Black-Scholes model, a widely accepted method for pricing European-style options. The formula for delta in the context of a call option is:
Delta = N(d1)
Where:
d1 is calculated as:
d1 = (ln(S / K) + (r + (σ^2 / 2)) * T) / (σ * sqrt(T))
Here, S is the current market price of the option (used as the strike price in this case), K is the strike price, r is the risk-free interest rate, σ is the volatility, and T is the time to expiry in years.
EMA of Delta
The Exponential Moving Average (EMA) of the delta is also plotted. The EMA is a smoothing function that helps identify trends by giving more weight to recent data points. It is calculated as:
EMA = ta.ema(delta_call, emaLength)
Where `emaLength` is the user-defined period for the EMA.
Uses of the Option Delta Indicator
Trend Analysis
The EMA helps smooth out delta values, making it easier to identify trends in the delta over time. This can be useful for traders looking to understand whether the delta is increasing or decreasing, which may indicate how the option’s sensitivity to price changes is evolving.
Decision-Making Tool
By observing both delta and its EMA, traders can make more informed decisions. For instance, if the delta is rising and the EMA confirms this trend, it might indicate bullish momentum in the underlying asset. Conversely, a declining delta with a falling EMA could suggest bearish trends.
Risk Management
Understanding the delta can help traders manage their risk by assessing how sensitive their options positions are to movements in the underlying asset. By using the EMA of delta, traders can better gauge changes in sensitivity and adjust their positions accordingly.
Limitations and Disadvantages
Dependence on Model Assumptions
The Black-Scholes model, which is used to calculate delta, relies on several assumptions including constant volatility and interest rates, and the absence of dividends. These assumptions may not hold in real-world markets, potentially affecting the accuracy of delta calculations.
No Consideration of Market Conditions
The indicator does not account for broader market conditions or liquidity factors. Delta and its EMA are calculated based purely on price and time to expiry, without incorporating market news or events that might impact the option's price.
Lag in EMA
The EMA, while smoothing data, introduces a lag because it is based on past prices. This means that the EMA may not react immediately to sudden price changes, potentially causing delayed signals.
Simplified Strike Price
In this indicator, the strike price is set to the current market price of the option. This simplification might not be suitable for all trading strategies, particularly if a different strike price is more relevant to the trader's strategy.
Limited Scope
This indicator focuses solely on delta and its EMA. While useful, it does not provide a comprehensive view of an option’s overall risk profile. Traders should consider using additional indicators and analyses for a more complete understanding.
Conclusion
The Option Delta Indicator with EMA offers a useful tool for traders to analyze how the sensitivity of an option’s price to changes in the underlying asset’s price evolves over time. The inclusion of an EMA helps to smooth out the delta values and identify trends. However, traders should be aware of the limitations, including the model’s assumptions, potential lag in EMA signals, and the simplified approach to the strike price.
As with any trading tool, it's crucial to use this indicator as part of a broader trading strategy that includes other analyses and risk management practices. Understanding its strengths and limitations will help traders make more informed decisions and enhance their overall trading effectiveness.

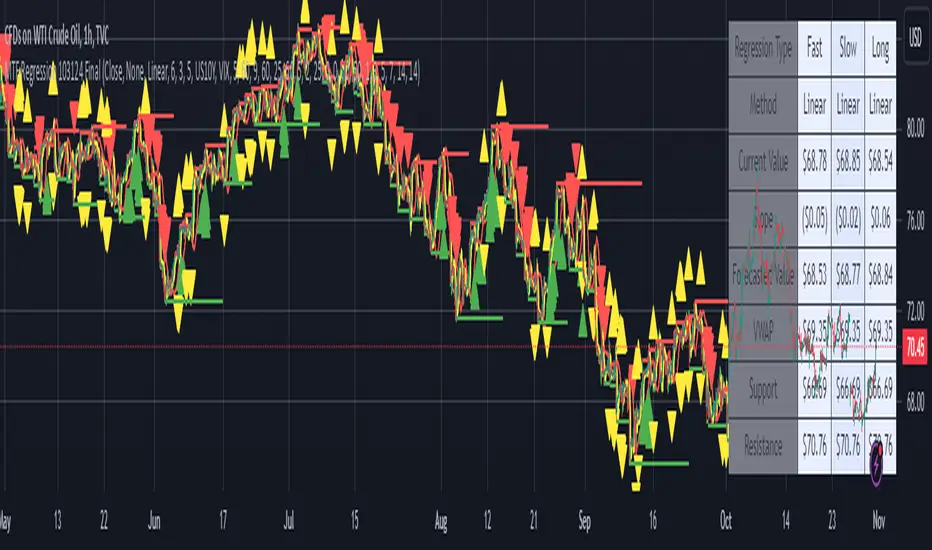
MTF Regression with Forecast### **MTF Regression with Forecast, Treasury Yield, Additional Variable & VWAP Filter - Enhanced with Long Regression**
Unlock advanced market insights with our **MTF Regression** indicator, meticulously designed for traders seeking comprehensive multi-timeframe analysis combined with powerful forecasting tools. Whether you're a seasoned trader or just starting out, this indicator offers a suite of features to enhance your trading strategy.
#### **🔍 Key Features:**
- **Multi-Timeframe (MTF) Regression:**
- **Fast, Slow, & Long Regressions:** Analyze price trends across multiple timeframes to capture both short-term movements and long-term trends.
- **Customizable Price Inputs:**
- **Flexible Price Selection:** Choose between Close, Open, High, or Low prices to suit your trading style.
- **Price Transformation:** Option to apply Exponential Moving Averages (EMA) for smoother trend analysis.
- **Diverse Regression Methods:**
- **Multiple Algorithms:** Select from Linear, Exponential, Hull Moving Average (HMA), Weighted Moving Average (WMA), or Spline regressions to best fit your analysis needs.
- **Integrated External Data:**
- **10-Year Treasury Yield:** Incorporate macroeconomic indicators to refine regression accuracy.
- **Additional Variables:** Enhance your analysis by integrating data from other tickers (e.g., NASDAQ:AAPL).
- **Advanced Filtering Options:**
- **VWAP Filter:** Align signals with the Volume Weighted Average Price for improved trade entries.
- **Price Action Filter:** Ensure price behavior supports the generated signals for higher reliability.
- **Enhanced Signal Generation:**
- **Bullish & Bearish Signals:** Identify potential trend reversals and continuations with clear visual cues.
- **Predictive Signals:** Forecast future price movements with forward-looking arrows based on regression slopes.
- **Slope & Acceleration Thresholds:** Customize minimum slope and acceleration levels to fine-tune signal sensitivity.
- **Forecasting Capabilities:**
- **Projection Lines:** Visualize future price trends by extending regression lines based on current slope data.
- **User-Friendly Interface:**
- **Organized Settings Groups:** Easily navigate through price inputs, regression settings, integration options, and more.
- **Customizable Alerts:** Stay informed with configurable alerts for bullish, bearish, and predictive signals.
#### **📈 Why Choose MTF Regression Indicator?**
- **Comprehensive Analysis:** Combines multiple regression techniques and external data sources for a well-rounded market view.
- **Flexibility:** Highly customizable to fit various trading strategies and preferences.
- **Enhanced Decision-Making:** Provides clear signals and forecasts to support informed trading decisions.
- **Efficiency:** Optimized to deliver reliable performance without overloading your trading platform.
Elevate your trading game with the **MTF Regression with Forecast, Treasury Yield, Additional Variable & VWAP Filter** indicator. Harness the power of multi-timeframe analysis and predictive forecasting to stay ahead in the dynamic markets.
---
*Feel free to reach out for more information or support. Happy Trading!*
Options Strategy Straddle StrangleThe "Options Strategy Straddle Strangle" indicator is designed to assist traders in identifying and executing optimal options trading strategies by leveraging the foundational principles of option greeks. This tool focuses on two prevalent strategies in options trading: straddles and strangles, providing a systematic approach to determining appropriate strike prices based on real-time market data.
At its core, the indicator calculates strike prices by analyzing key option greeks, including Delta, Gamma, Theta, and Vega. By evaluating these sensitivities, the tool assesses the potential risks and rewards associated with different strike prices, ensuring that the selected levels align with the trader's specified thresholds. Users can input their desired thresholds for each greek, allowing for a customized approach that reflects individual risk tolerance and market outlook.
Once the thresholds are set, the indicator applies its underlying logic to filter and identify the most suitable strike prices for both straddle and strangle strategies. A straddle involves purchasing both a call and a put option at the same strike price, benefiting from significant price movements in either direction. Conversely, a strangle involves buying a call and a put option at different strike prices, which can be more cost-effective while still capitalizing on substantial market shifts.
The output of the "Options Strategy Straddle Strangle" indicator is presented in a clear and organized table format. This table displays the recommended strike prices for implementing either a straddle or a strangle strategy, based on the current market conditions and the predefined greek thresholds. By providing this information in an accessible manner, the indicator enables traders to make informed decisions quickly, enhancing their ability to respond to market volatility effectively.
Note:
Used methodology of the following indicator:

Options Series - Index Analysis [MasterPiece]
Powerful Insights 🚀:
This script utilizes multiple technical indicators to provide a comprehensive view of stock trends, which increases the reliability of trading signals.
This script also designed to perform index and stock analysis by comparing price movements to moving averages (MA20) and volume-weighted average price (VWAP).
By analyzing a set of top-weighted stocks within an index, the script offers a macro-level view while also delivering stock-specific insights. This dual focus enhances its utility for traders who need to understand both individual stock movements and broader market dynamics.
⭐ Originality: The script presents a unique fusion of multiple indicators with a data-driven approach to analyzing top-weighted stocks in major indices like Nifty and BankNifty. The integration of widely-used technical analysis tools, such as exponential and simple moving averages (EMA, SMA), volume-weighted average price (VWAP), and volume-body size comparisons, offers a holistic framework for traders. By focusing on the top five stocks in the indices, it leverages weightage-based performance analysis, adding a strategic dimension to index trading. This approach not only evaluates individual stock performance but also synthesizes broader market trends.
⭐ Usefulness: This script serves traders who seek a multi-dimensional method for analyzing both index and stock performance. Its key features include:
Bullish and Bearish Signals: The relationship between price, moving averages (MA20), and VWAP identifies directional trends, generating buy/sell signals for both individual stocks and the overall index.
Volume and Candle Body Analysis: By comparing candle body size with volume, the script provides deeper insights into trend strength and market conviction. This allows traders to gauge whether price movements are supported by sufficient trading volume.
Customization: Users have the flexibility to input specific index and stock symbols, making the script adaptable for different markets and instruments beyond just Nifty and BankNifty.
Signal Overlay: The ability to overlay bar color and volume signals directly on the price chart ensures better trend visualization, offering clear and immediate visual cues for potential trading setups.
⭐ Justification for Mashup: The combination of multiple indicators is logical and complementary. Each component serves a distinct purpose that enhances the overall system:
Trend Identification: Moving averages and VWAP provide insights into short and long-term trends, giving traders a reliable baseline for price direction.
Conviction: The inclusion of volume and candle body size comparisons gives additional weight to price action, allowing traders to confirm whether a trend is backed by meaningful market activity.
⭐ Color Customization for Enhanced Visualization:
The script defines custom colors for various conditions and candles, improving clarity for bullish and bearish trends.
Green for Bullish: Dark green for regular bullish candles, and fluorescent green for stronger bullish signals.
Red for Bearish: Dark red for regular bearish candles, and fluorescent red for stronger bearish signals.
Neutral Conditions: Fluorescent yellow is used for neutral conditions.
⭐ Index and Top Stocks Analysis:
This section analyzes top-weighted stocks for indices ( NSE:NIFTY and NSE:BANKNIFTY ), with NSE:BANKNIFTY being used as the default.
Top Stocks for NSE:NIFTY : HDFCBANK, ICICIBANK, RELIANCE, INFY, ITC.
Top Stocks for NSE:BANKNIFTY : HDFCBANK, ICICIBANK, KOTAKBANK, AXISBANK, SBIN.
Customizable Input: Users can modify the index and stock symbols via input.symbol.
⭐ Signal Generation Based on MA20 and VWAP:
The conditions for bullish or bearish signals are based on the relationship between the stock's close price, MA20, and VWAP.
Bullish Signal: Close price greater than both MA20 and VWAP.
Bearish Signal: Close price less than both MA20 and VWAP.
⭐ Volume Bar Signal for Market Activity:
The script analyzes candle body size and volume to detect significant market movements.
Body Size and Volume Comparison: It checks if the current candle’s body size or volume is greater than the moving average of body size or volume over the past 74 bars.
Green Candle (GC) and Red Candle (RC): Boolean conditions to track whether the close price is higher or lower than the open price.
⭐ Average Signals for Strong Trends:
The script calculates average bullish or bearish signals based on the majority of candles being green or red and significant body size or volume.
Bullish Average Signal: At least 4 out of 6 stocks exhibit bullish conditions (green candles, large bodies, or high volume).
Bearish Average Signal: Similar logic for bearish signals with red candles.
⭐ Overlay of Volume Bar Signals:
The plotshape function overlays the bullish and bearish volume bar signals on the chart, using color and shape to indicate trend changes.
🚀 Conclusion:
This Pine Script code provides a robust framework for index analysis based on top 5 weighted stocks, using two primary indicators—MA20 (20-period Moving Average) and VWAP (Volume Weighted Average Price).
Market Bias Identification: The script identifies bullish and bearish conditions for each stock based on whether the close price is above or below MA20 and VWAP.
Volume and Body Size Comparison: It checks if the current candle’s body size or volume exceeds the average to determine significant market moves.
Visualization with Color & Signals: It overlays color signals for bullish (fluorescent green) and bearish (fluorescent red) markets and provides triangle markers for strong volume-based signals.
Top Stock Analysis: The script provides analysis of top five weighted stocks in the selected index, enhancing precision for broader index analysis.

ICT CheckListCredit to the owner of this script "TalesOfTrader"
The Awakening Checklist indicator is a tool designed to help traders evaluate certain key market conditions and elements before making trading decisions. It consists of a series of questions that the trader must answer using the options "Yes", "No" or "N/A" (not applicable).
“Has Asia Session ended?” : This question aims to determine if the Asian trading session has ended. The answer to this question can influence trading strategies depending on market conditions.
“Have you identified potential medium induction?” : This question concerns the identification of potential average inductions on the market. Recognizing these inductions can help traders anticipate future price movements.
"Have you identified potential PoI's": This question asks about the identification of potential points of interest on the market. These points of interest can indicate areas of significant support or resistance.
"Have you identified in which direction they are creating lQ?" : This question aims to determine in which direction market participants create liquidity (lQ). Understanding this dynamic can help make informed trade decisions.
“Have they induced Asia Range”: This question concerns the induction of the Asian range by market participants. Recognizing this induction can be important in assessing future price movements.
“Have you had a medium induction”: This question asks about the presence of a medium induction on the market. The answer to this question can influence trading prospects.
“Do you have a BoS away from the induction”: This question aims to find out if the trader has an offer (BoS) far from the identified induction. This can be a risk management strategy.
"Doas your induction PoI have imbalance": This question concerns the imbalance of points of interest (PoI) linked to induction. Recognizing this imbalance can help anticipate price movements.
“Do you have a valid target in mind”: This question aims to find out if the trader has a clear trading objective in mind. Having a goal can help guide trading decisions and manage risk.

Options Oscillator [Lite] IVRank, IVx, Call/Put Volatility Skew The first TradingView indicator that provides REAL IVRank, IVx, and CALL/PUT skew data based on REAL option chain for 5 U.S. market symbols.
🔃 Auto-Updating Option Metrics without refresh!
🍒 Developed and maintained by option traders for option traders.
📈 Specifically designed for TradingView users who trade options.
🔶 Ticker Information:
This 'Lite' indicator is currently only available for 5 liquid U.S. market smbols : NASDAQ:TSLA AMEX:DIA NASDAQ:AAPL NASDAQ:AMZN and NYSE:ORCL
🔶 How does the indicator work and why is it unique?
This Pine Script indicator is a complex tool designed to provide various option metrics and visualization tools for options market traders. The indicator extracts raw options data from an external data provider (ORATS), processes and refines the delayed data package using pineseed, and sends it to TradingView, visualizing the data using specific formulas (see detailed below) or interpolated values (e.g., delta distances). This method of incorporating options data into a visualization framework is unique and entirely innovative on TradingView.
The indicator aims to offer a comprehensive view of the current state of options for the implemented instruments, including implied volatility (IV), IV rank (IVR), options skew, and expected market movements, which are objectively measured as detailed below.
The options metrics we display may be familiar to options traders from various major brokerage platforms such as TastyTrade, IBKR, TOS, Tradier, TD Ameritrade, Schwab, etc.
🟨 The following data is displayed in the oscillator 🟨
We use Tastytrade formulas, so our numbers mostly align with theirs!
🔶 𝗜𝗩𝗥𝗮𝗻𝗸
The Implied Volatility Rank (IVR) helps options traders assess the current level of implied volatility (IV) in comparison to the past 52 weeks. IVR is a useful metric to determine whether options are relatively cheap or expensive. This can guide traders on whether to buy or sell options.
IV Rank formula = (current IV - 52 week IV low) / (52 week IV high - 52 week IV low)
IVRank is default blue and you can adjust their settings:
🔶 𝗜𝗩𝘅 𝗮𝘃𝗴
The implied volatility (IVx) shown in the option chain is calculated like the VIX. The Cboe uses standard and weekly SPX options to measure expected S&P 500 volatility. A similar method is used for calculating IVx for each expiration cycle.
We aggregate the IVx values for the 35-70 day monthly expiration cycle, and use that value in the oscillator and info panel.
We always display which expiration the IVx values are averaged for when you hover over the IVx cell.
IVx main color is purple, but you can change the settings:
🔹IVx 5 days change %
We are also displaying the five-day change of the IV Index (IVx value). The IV Index 5-Day Change column provides quick insight into recent expansions or decreases in implied volatility over the last five trading days.
Traders who expect the value of options to decrease might view a decrease in IVX as a positive signal. Strategies such as Strangle and Ratio Spread can benefit from this decrease.
On the other hand, traders anticipating further increases in IVX will focus on the rising IVX values. Strategies like Calendar Spread or Diagonal Spread can take advantage of increasing implied volatility.
This indicator helps traders quickly assess changes in implied volatility, enabling them to make informed decisions based on their trading strategies and market expectations.
Important Note:
The IVx value alone does not provide sufficient context. There are stocks that inherently exhibit high IVx values. Therefore, it is crucial to consider IVx in conjunction with the Implied Volatility Rank (IVR), which measures the IVx relative to its own historical values. This combined view helps in accurately assessing the significance of the IVx in relation to the specific stock's typical volatility behavior.
This indicator offers traders a comprehensive view of implied volatility, assisting them in making informed decisions by highlighting both the absolute and relative volatility measures.
🔶 𝗖𝗔𝗟𝗟/𝗣𝗨𝗧 𝗣𝗿𝗶𝗰𝗶𝗻𝗴 𝗦𝗸𝗲𝘄 𝗵𝗶𝘀𝘁𝗼𝗴𝗿𝗮𝗺
At TanukiTrade, Vertical Pricing Skew refers to the difference in pricing between put and call options with the same expiration date at the same distance (at tastytrade binary expected move). We analyze this skew to understand market sentiment. This is the same formula used by TastyTrade for calculations.
We calculate the interpolated strike price based on the expected move, taking into account the neighboring option prices and their distances. This allows us to accurately determine whether the CALL or PUT options are more expensive.
🔹 What Causes Pricing Skew? The Theory Behind It
The asymmetric pricing of PUT and CALL options is driven by the natural dynamics of the market. The theory is that when CALL options are more expensive than PUT options at the same distance from the current spot price, market participants are buying CALLs and selling PUTs, expecting a faster upward movement compared to a downward one .
In the case of PUT skew, it's the opposite: participants are buying PUTs and selling CALLs , as they expect a potential downward move to happen more quickly than an upward one.
An options trader can take advantage of this phenomenon by leveraging PUT pricing skew. For example, if they have a bullish outlook and both IVR and IVx are high and IV started decreasing, they can capitalize on this PUT skew with strategies like a jade lizard, broken wing butterfly, or short put.
🔴 PUT Skew 🔴
Put options are more expensive than call options, indicating the market expects a faster downward move (▽). This alone doesn't indicate which way the market will move (because nobody knows that), but the options chain pricing suggests that if the market moves downward, it could do so faster in velocity compared to a potential upward movement.
🔹 SPY PUT SKEW example:
If AMEX:SPY PUT option prices are 46% higher than CALLs at the same distance for the optimal next monthly expiry (DTE). This alone doesn't indicate which way the market will move (because nobody knows that), but the options chain pricing suggests that if the market moves downward, it could do so 46% faster in velocity compared to a potential upward movement
🟢 CALL Skew 🟢
Call options are more expensive than put options, indicating the market expects a faster upward move (△). This alone doesn't indicate which way the market will move (because nobody knows that), but the options chain pricing suggests that if the market moves upward, it could do so faster in velocity compared to a potential downward movement.
🔹 INTC CALL SKEW example:
If NASDAQ:INTC CALL option prices are 49% higher than PUTs at the same distance for the optimal next monthly expiry (DTE). This alone doesn't indicate which way the market will move (because nobody knows that), but the options chain pricing suggests that if the market moves upward, it could do so 49% faster in velocity compared to a potential downward movement .
🔶 USAGE example:
The script is compatible with our other options indicators.
For example: Since the main metrics are already available in this Options Oscillator, you can hide the main IVR panel of our Options Overlay indicator, freeing up more space on the chart. The following image shows this:
🔶 ADDITIONAL IMPORTANT COMMENTS
🔹 Historical Data:
Yes, we only using historical internal metrics dating back to 2024-07-01, when the TanukiTrade options brand launched. For now, we're using these, but we may expand the historical data in the future.
🔹 What distance does the indicator use to measure the call/put pricing skew?:
It is important to highlight that this oscillator displays the call/put pricing skew changes for the next optimal monthly expiration on a histogram.
The Binary Expected Move distance is calculated using the TastyTrade method for the next optimal monthly expiration: Formula = (ATM straddle price x 0.6) + (1st OTM strangle price x 0.3) + (2nd OTM strangle price x 0.1)
We interpolate the exact difference based on the neighboring strikes at the binary expected move distance using the TastyTrade method, and compare the interpolated call and put prices at this specific point.
🔹 - Why is there a slight difference between the displayed data and my live brokerage data?
There are two reasons for this, and one is beyond our control.
◎ Option-data update frequency:
According to TradingView's regulations and guidelines, we can update external data a maximum of 5 times per day. We strive to use these updates in the most optimal way:
(1st update) 15 minutes after U.S. market open
(2nd, 3rd, 4th updates) 1.5–3 hours during U.S. market open hours
(5th update) 10 minutes before U.S. market close.
You don’t need to refresh your window, our last refreshed data-pack is always automatically applied to your indicator, and you can see the time elapsed since the last update at the bottom of the corner on daily TF.
◎ Brokerage Calculation Differences:
Every brokerage has slight differences in how they calculate metrics like IV and IVx. If you open three windows for TOS, TastyTrade, and IBKR side by side, you will notice that the values are minimally different. We had to choose a standard, so we use the formulas and mathematical models described by TastyTrade when analyzing the options chain and drawing conclusions.
🔹 - EOD data:
The indicator always displays end-of-day (EOD) data for IVR, IV, and CALL/PUT pricing skew. During trading hours, it shows the current values for the ongoing day with each update, and at market close, these values become final. From that point on, the data is considered EOD, provided the day confirms as a closed daily candle.
🔹 - U.S. market only:
Since we only deal with liquid option chains: this option indicator only works for the USA options market and do not include future contracts; we have implemented each selected symbol individually.
Disclaimer:
Our option indicator uses approximately 15min-3 hour delayed option market snapshot data to calculate the main option metrics. Exact realtime option contract prices are never displayed; only derived metrics and interpolated delta are shown to ensure accurate and consistent visualization. Due to the above, this indicator can only be used for decision support; exclusive decisions cannot be made based on this indicator. We reserve the right to make errors.This indicator is designed for options traders who understand what they are doing. It assumes that they are familiar with options and can make well-informed, independent decisions. We work with public data and are not a data provider; therefore, we do not bear any financial or other liability.
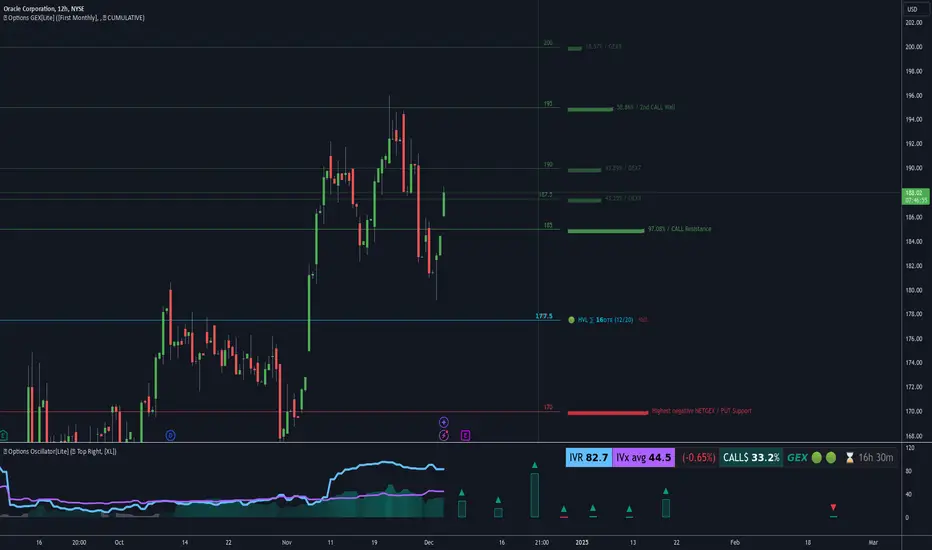
Options Oscillator [PRO] IVRank, IVx, Call/Put Volatility Skew𝗧𝗵𝗲 𝗳𝗶𝗿𝘀𝘁 𝗧𝗿𝗮𝗱𝗶𝗻𝗴𝗩𝗶𝗲𝘄 𝗶𝗻𝗱𝗶𝗰𝗮𝘁𝗼𝗿 𝘁𝗵𝗮𝘁 𝗽𝗿𝗼𝘃𝗶𝗱𝗲𝘀 𝗥𝗘𝗔𝗟 𝗜𝗩𝗥𝗮𝗻𝗸, 𝗜𝗩𝘅, 𝗮𝗻𝗱 𝗖𝗔𝗟𝗟/𝗣𝗨𝗧 𝘀𝗸𝗲𝘄 𝗱𝗮𝘁𝗮 𝗯𝗮𝘀𝗲𝗱 𝗼𝗻 𝗥𝗘𝗔𝗟 𝗼𝗽𝘁𝗶𝗼𝗻 𝗰𝗵𝗮𝗶𝗻 𝗳𝗼𝗿 𝗼𝘃𝗲𝗿 𝟭𝟲𝟱+ 𝗺𝗼𝘀𝘁 𝗹𝗶𝗾𝘂𝗶𝗱 𝗨.𝗦. 𝗺𝗮𝗿𝗸𝗲𝘁 𝘀𝘆𝗺𝗯𝗼𝗹𝘀
🔃 Auto-Updating Option Metrics without refresh!
🍒 Developed and maintained by option traders for option traders.
📈 Specifically designed for TradingView users who trade options.
🔶 Ticker Information:
This indicator is currently only available for over 165+ most liquid U.S. market symbols (eg. SP:SPX AMEX:SPY NASDAQ:QQQ NASDAQ:TLT NASDAQ:NVDA , etc.. ), and we are continuously expanding the compatible watchlist here: www.tradingview.com
🔶 How does the indicator work and why is it unique?
This Pine Script indicator is a complex tool designed to provide various option metrics and visualization tools for options market traders. The indicator extracts raw options data from an external data provider (ORATS), processes and refines the delayed data package using pineseed, and sends it to TradingView, visualizing the data using specific formulas (see detailed below) or interpolated values (e.g., delta distances). This method of incorporating options data into a visualization framework is unique and entirely innovative on TradingView.
The indicator aims to offer a comprehensive view of the current state of options for the implemented instruments, including implied volatility (IV), IV rank (IVR), options skew, and expected market movements, which are objectively measured as detailed below.
The options metrics we display may be familiar to options traders from various major brokerage platforms such as TastyTrade, IBKR, TOS, Tradier, TD Ameritrade, Schwab, etc.
🟨 The following data is displayed in the oscillator 🟨
We use Tastytrade formulas, so our numbers mostly align with theirs!
🔶 𝗜𝗩𝗥𝗮𝗻𝗸
The Implied Volatility Rank (IVR) helps options traders assess the current level of implied volatility (IV) in comparison to the past 52 weeks. IVR is a useful metric to determine whether options are relatively cheap or expensive. This can guide traders on whether to buy or sell options.
IV Rank formula = (current IV - 52 week IV low) / (52 week IV high - 52 week IV low)
IVRank is default blue and you can adjust their settings:
🔶 𝗜𝗩𝘅 𝗮𝘃𝗴
The implied volatility (IVx) shown in the option chain is calculated like the VIX. The Cboe uses standard and weekly SPX options to measure expected S&P 500 volatility. A similar method is used for calculating IVx for each expiration cycle.
We aggregate the IVx values for the 35-70 day monthly expiration cycle, and use that value in the oscillator and info panel.
We always display which expiration the IVx values are averaged for when you hover over the IVx cell.
IVx main color is purple, but you can change the settings:
🔹 IVx 5 days change %
We are also displaying the five-day change of the IV Index (IVx value). The IV Index 5-Day Change column provides quick insight into recent expansions or decreases in implied volatility over the last five trading days.
Traders who expect the value of options to decrease might view a decrease in IVX as a positive signal. Strategies such as Strangle and Ratio Spread can benefit from this decrease.
On the other hand, traders anticipating further increases in IVX will focus on the rising IVX values. Strategies like Calendar Spread or Diagonal Spread can take advantage of increasing implied volatility.
This indicator helps traders quickly assess changes in implied volatility, enabling them to make informed decisions based on their trading strategies and market expectations.
Important Note:
The IVx value alone does not provide sufficient context. There are stocks that inherently exhibit high IVx values. Therefore, it is crucial to consider IVx in conjunction with the Implied Volatility Rank (IVR), which measures the IVx relative to its own historical values. This combined view helps in accurately assessing the significance of the IVx in relation to the specific stock's typical volatility behavior.
This indicator offers traders a comprehensive view of implied volatility, assisting them in making informed decisions by highlighting both the absolute and relative volatility measures.
🔶 𝗖𝗔𝗟𝗟/𝗣𝗨𝗧 𝗣𝗿𝗶𝗰𝗶𝗻𝗴 𝗦𝗸𝗲𝘄 𝗵𝗶𝘀𝘁𝗼𝗴𝗿𝗮𝗺
At TanukiTrade, Vertical Pricing Skew refers to the difference in pricing between put and call options with the same expiration date at the same distance (at tastytrade binary expected move). We analyze this skew to understand market sentiment. This is the same formula used by TastyTrade for calculations.
We calculate the interpolated strike price based on the expected move, taking into account the neighboring option prices and their distances. This allows us to accurately determine whether the CALL or PUT options are more expensive.
🔹 What Causes Pricing Skew? The Theory Behind It
The asymmetric pricing of PUT and CALL options is driven by the natural dynamics of the market. The theory is that when CALL options are more expensive than PUT options at the same distance from the current spot price, market participants are buying CALLs and selling PUTs, expecting a faster upward movement compared to a downward one .
In the case of PUT skew, it's the opposite: participants are buying PUTs and selling CALLs , as they expect a potential downward move to happen more quickly than an upward one.
An options trader can take advantage of this phenomenon by leveraging PUT pricing skew. For example, if they have a bullish outlook and both IVR and IVx are high and IV started decreasing, they can capitalize on this PUT skew with strategies like a jade lizard, broken wing butterfly, or short put.
🔴 PUT Skew 🔴
Put options are more expensive than call options, indicating the market expects a faster downward move (▽). This alone doesn't indicate which way the market will move (because nobody knows that), but the options chain pricing suggests that if the market moves downward, it could do so faster in velocity compared to a potential upward movement.
🔹 SPY PUT SKEW example:
If AMEX:SPY PUT option prices are 46% higher than CALLs at the same distance for the optimal next monthly expiry (DTE). This alone doesn't indicate which way the market will move (because nobody knows that), but the options chain pricing suggests that if the market moves downward, it could do so 46% faster in velocity compared to a potential upward movement
🟢 CALL Skew 🟢
Call options are more expensive than put options, indicating the market expects a faster upward move (△). This alone doesn't indicate which way the market will move (because nobody knows that), but the options chain pricing suggests that if the market moves upward, it could do so faster in velocity compared to a potential downward movement.
🔹 INTC CALL SKEW example:
If NASDAQ:INTC CALL option prices are 49% higher than PUTs at the same distance for the optimal next monthly expiry (DTE). This alone doesn't indicate which way the market will move (because nobody knows that), but the options chain pricing suggests that if the market moves upward, it could do so 49% faster in velocity compared to a potential downward movement .
🔶 USAGE example:
The script is compatible with our other options indicators.
For example: Since the main metrics are already available in this Options Oscillator, you can hide the main IVR panel of our Options Overlay indicator, freeing up more space on the chart. The following image shows this:
🔶 ADDITIONAL IMPORTANT COMMENTS
🔹 Historical Data:
Yes, we only using historical internal metrics dating back to 2024-07-01, when the TanukiTrade options brand launched. For now, we're using these, but we may expand the historical data in the future.
🔹 What distance does the indicator use to measure the call/put pricing skew?:
It is important to highlight that this oscillator displays the call/put pricing skew changes for the next optimal monthly expiration on a histogram.
The Binary Expected Move distance is calculated using the TastyTrade method for the next optimal monthly expiration: Formula = (ATM straddle price x 0.6) + (1st OTM strangle price x 0.3) + (2nd OTM strangle price x 0.1)
We interpolate the exact difference based on the neighboring strikes at the binary expected move distance using the TastyTrade method, and compare the interpolated call and put prices at this specific point.
🔹 - Why is there a slight difference between the displayed data and my live brokerage data?
There are two reasons for this, and one is beyond our control.
◎ Option-data update frequency:
According to TradingView's regulations and guidelines, we can update external data a maximum of 5 times per day. We strive to use these updates in the most optimal way:
(1st update) 15 minutes after U.S. market open
(2nd, 3rd, 4th updates) 1.5–3 hours during U.S. market open hours
(5th update) 10 minutes before U.S. market close.
You don’t need to refresh your window, our last refreshed data-pack is always automatically applied to your indicator, and you can see the time elapsed since the last update at the bottom of the corner on daily TF.
◎ Brokerage Calculation Differences:
Every brokerage has slight differences in how they calculate metrics like IV and IVx. If you open three windows for TOS, TastyTrade, and IBKR side by side, you will notice that the values are minimally different. We had to choose a standard, so we use the formulas and mathematical models described by TastyTrade when analyzing the options chain and drawing conclusions.
🔹 - EOD data:
The indicator always displays end-of-day (EOD) data for IVR, IV, and CALL/PUT pricing skew. During trading hours, it shows the current values for the ongoing day with each update, and at market close, these values become final. From that point on, the data is considered EOD, provided the day confirms as a closed daily candle.
🔹 - U.S. market only:
Since we only deal with liquid option chains: this option indicator only works for the USA options market and do not include future contracts; we have implemented each selected symbol individually.
Disclaimer:
Our option indicator uses approximately 15min-3 hour delayed option market snapshot data to calculate the main option metrics. Exact realtime option contract prices are never displayed; only derived metrics and interpolated delta are shown to ensure accurate and consistent visualization. Due to the above, this indicator can only be used for decision support; exclusive decisions cannot be made based on this indicator. We reserve the right to make errors.This indicator is designed for options traders who understand what they are doing. It assumes that they are familiar with options and can make well-informed, independent decisions. We work with public data and are not a data provider; therefore, we do not bear any financial or other liability.

Rolling Straddle PremiumScript is Basically intended to provide insight's on the Rolling Straddle premium for the selected index based on the input settings.
Important thing to consider for the script to work seamlessly:
Specify the LTP in the input field (need not be very accurate)
Specify the Expiry Date for the Option Strike.
Ensure Profile matches to the chart script (Index Script)
Note: Zones marked in Blue, is the max level that indicator can track the option prices. beyond which it may fail to track, during such time consider reloading the indicator with Latest LTP .
Labels on the chart indicate that If i had shorted the Straddle, what would be my current position of that Straddle. however the rational behind shorting is only the pivot high points (not sure if this is right or wrong! )
Note On Labels: Labels are delayed basis the pivot point candles specified in the indicator settings.
EN: Entry Price (Straddle Premium) of the Strike Specified.
Cur: Current Price ( Current Straddle Premium ) of the Strike Specified.
SH: Max Straddle Premium ( Increase in Premium ) since position is active.
SL: Min Straddle Premium ( Premium Erosion ) since position is active.
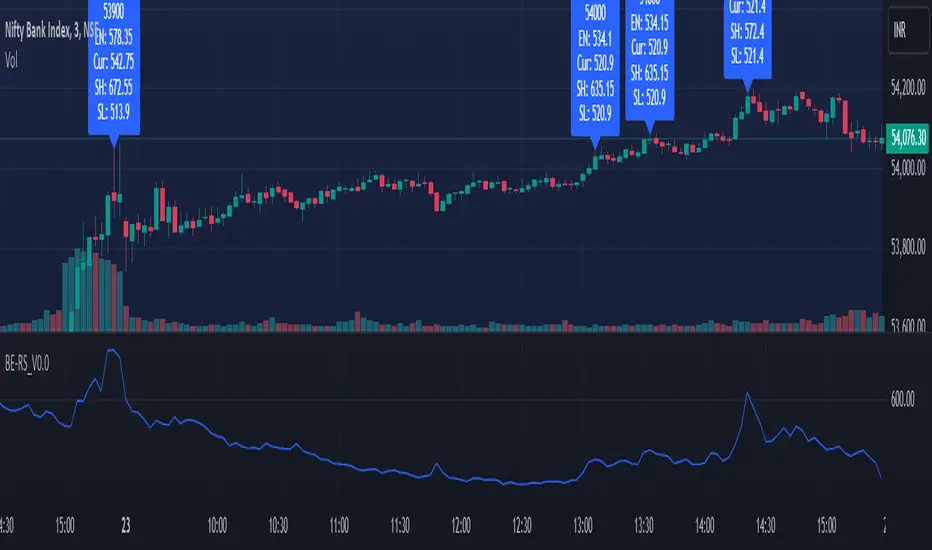

Sniper Entry Indicator, Crypto, Forex, Indices, I ndicator Description:
Momentum & Sideways Market Detector is a powerful TradingView indicator that combines the strengths of RSI (Relative Strength Index) and Moving Averages to identify market momentum and detect sideways movements. This versatile tool is designed to work effectively across various asset classes, including Cryptocurrencies, Forex pairs, Gold, and major stock indices like Nifty, BankNifty, Finifty, and Midcap.
Key Features:
Momentum Detection: The indicator uses RSI to gauge market momentum, highlighting overbought and oversold conditions to signal potential reversals by Displaying strength on the chart, above 90 it will be overbought and check for reversal trade, below 10 it will be oversold and check for the long opportunity.
Sideways Market Identification: It utilizes a combination of Moving Averages to detect low-volatility periods and sideways market conditions, helping traders avoid choppy markets. Area or label highlighted by blue means it is sideways, you can ignore entries in this zone.
Multi-Asset Compatibility: The indicator is optimized to perform well on diverse asset classes, including Crypto, Forex, Commodities, and Equity Indices, making it a versatile tool for traders of all types. It is compatible with Indian indices as well giving trader opportunity to see live trade with strike price entry and sl. It also trails the SL when reached the first target.
Customizable Parameters: Users can adjust RSI and Moving Average settings to suit their trading style and timeframe preferences.
Settings:
Stock/Option (Whether you want to trade Sport or it's option, if unchecked it will look for expiry of the stock option, month, and year, user also needs to provide the call and put option)
Spot Symbol (I have provided some of the spot symbols for the selection which will help him to configure it's F&O )
Backtest Day (User can backtest the data by changing the day to previous lookback, it is a very good feature to test the results.)
Remove lines from the table (If table is too long, i have provided the option to remove some of the lines from the table, provide number to remove the lines)
This indicator is a must-have for traders looking to enhance their strategy by accurately identifying market conditions and adapting their trades accordingly.

Time based Insights [Digit23]Description:
The NSE Trading Time Insights indicator is a powerful tool designed for traders on the National Stock Exchange (NSE) of India. It provides a comprehensive overview of different trading sessions throughout the day, offering valuable insights into market characteristics and potential trading strategies for each time period.
Key Features:
1. Dynamic Session Display: The indicator automatically detects the current trading session and highlights it in the table.
2. Customizable Table: Users can choose to display either a full table showing all sessions or focus on the current session only.
3. User-Editable Content: Time ranges, session characteristics, and trading insights are fully customizable by the user.
4. Visual Customization: Table position and color scheme can be adjusted to suit individual preferences.
5. Market Status Indicator: Clearly shows when the market is closed.
Sessions Covered:
1. Opening Bell
2. Mid-Morning
3. Lunch Hour
4. Early Afternoon
5. Power Hour
For each session, the indicator displays:
- Time Range
- Session Name
- Market Characteristics
- Trading Insights
Customization Options:
- Table Position: Choose from top-left, top-right, bottom-left, or bottom-right of the chart.
- Color Scheme: Customize colors for header, cells, highlighting, and market closed status.
- Session Details: Edit time ranges, characteristics, and trading insights for each session.
Usage:
This indicator is particularly useful for:
1. New traders learning about intraday market dynamics on the NSE.
2. Experienced traders looking for a quick reference of session characteristics.
3. Traders developing or refining time-based trading strategies.
4. Anyone seeking to understand the typical flow of the trading day on the NSE.
Note:
The indicator uses the chart's time to determine the current session. Ensure your chart is set to the correct time zone for accurate results.
Disclaimer:
This indicator is for informational purposes only. The provided insights and characteristics are general in nature and may not reflect current market conditions. Always conduct your own analysis and risk assessment before making trading decisions.
