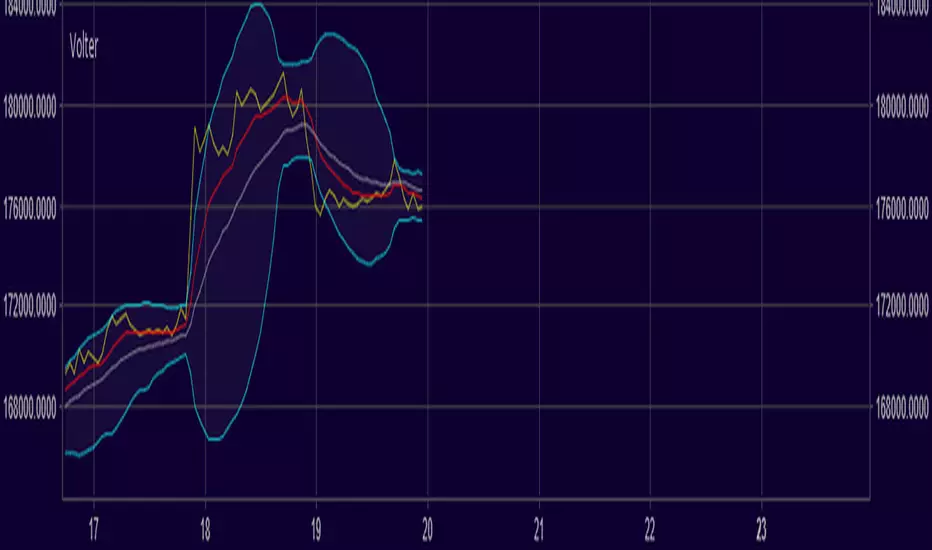
On Balance Volume Oscillator + Bollinger Bands [SigmaDraconis]On Balance Volume (OBV) Oscillator with Bollinger Bands (BB).
Inspired by @LazyBear OBV Oscillator (link below)
Added BB to the oscillator and colored the OBV line yellow when it's outside the bands' limits, useful for finding over-extended zones where price reversals have higher probability of happening.
BB bands can be deactivated and the oscillator can be used as originally built by LazyBear if the BB bands are disabled and the OBV area activated.
Finding divergences helps increasing price behavior predictability too.
BB area is colored green when OBV is above the 20-period moving average and colored red when below it. This can be deactivated on the options to use regular BB colors or no BB at all.
If you like it and use it to profit, please tip me below :)
Tip jars:
BTC: 15nMBiEGVrdGcu9C1h6QRcTNRvugHkqrMQ
ETH: 0xC33845946c48B61fBCbEA0367ec2238CaF2b73bc
BTS: sigma-draconis
OBV Oscillator from LazyBear -
Balanço de Volume (OBV)

Ultimate Money Flow (UMF), Stoch, Multi Time Frame (MTF) [cI8DH]This indicator adds stochastic, multi time frame, signal line, histogram, and bar coloring options to my previous indicators. It can also replicate standard Money Flow Index ( MFI ), Chaikin's Accumulation/Distribution Line ( ADL ), On Balance Volume ( OBV ) and Price-Volume Trend ( PVT ). This indicator can be used for analyzing momentum, buy/sell pressure, overbought/oversold conditions, and trendiness/choppiness, as well as identifying swings (stoch). Chart below shows example multi-TF setup with bar coloring.
For analyzing price, I made a similar indicator based on Absolute and Relative Strength Indices, which you can find in the link below.
Equation
Here is part of the code used in the script: pastebin.com
Standard MFI, OBV, ADL and PVT
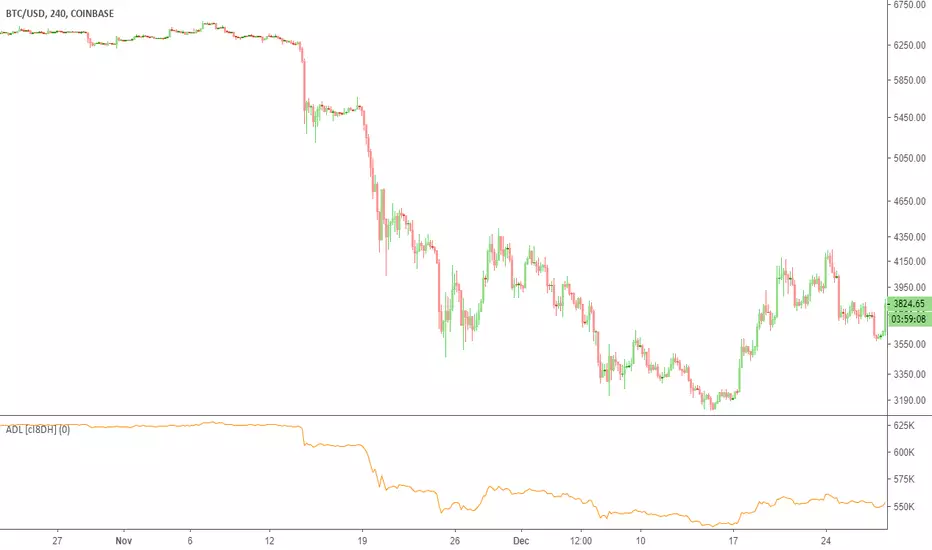
To validate the calculations, I stacked UMF on MFI, OBV, ADL, and PVT in the chart below (100% overlaps validate the calculations). It also shows how you can replicate these indicator if you'd like to use them, or if you want to make your own custom indicator by combining features from different indicators. I do not recommend MFI, ADL or OBV; read "why invent a new indicator" section below. (bear in mind that MFI scale is 0-100, while UMF scales is -100 to 100)
Money Flow based on "Balance of Power" (this is the default mode)
Balance of Power (BoP) equation is: (close - open) / (high - low)
In my opinion, BoP is the most accurate equation to measure the amount of volume accumulated or distributed. I used BoP in my previous open source indicators ADV , ADL , ADP and ADMF . I applied the "True Range" fix to BoP equation similar to what Twiggs did on CMF .
Aggregation Method
By changing aggregation methods, you can replicate my previous indicators which are also linked at the bottom of this page. Please read more about their applications in their respective pages.
aggregation method = Cumulative => ADL indicator: accumulation/distribution (price factoring should be turned off)
aggregation method = MA => ADMF indicator: accurate buy/sell pressure, momentum and divergence
aggregation method = MA Percent => ADP indicator: overbought/oversold conditions, buy/sell pressure, momentum and divergence, failure swings
Smoothing, signal line and histogram to detect trend and choppiness
You can apply additional smoothing to UMF. Also, you can add a signal line and histogram (histogram is the difference between main line and signal line). To do so, set the signal length to a number greater than one. Signal line can help you detect changes in trend similar to the signal line on MACD. If signal line criss-crosses UMF, it shows market is choppy. The worst case is when this criss-crossing coincides with UMF flattening near neutral line and histogram height is short; that means market is ded (until it is not; expansion following a contraction period is a common phenomena)! (Bear in mind that histogram will not show in stoch mode.)
Stochastic
To enable stoch, change the stoch length to a number greater than 1 (default stoch length for the built-in stoch RSI is 14). This length should be calibrated depending on TF and asset. If done correctly, it can be a powerful tool for identifying swings. Stoch can be combined with any aggregation method. I recommend using stoch with MA or cumulative aggregation methods. For conventional uses of stochastic, please read www.tradingview.com(STOCH) and www.tradingview.com(STOCH_RSI).
Experimental Bar coloring Feature
There is an option to color bars depending on UMF's position relative to the signal line. If both TFs are used in coloring and they are in disagreement, the TF with greater histogram height wins. There are two shades of green and red. The darker shade means both TFs agree. If you use the signal line, bar coloring can help with calibrating the indicator (play with parameters until you see a good looking chart i.e. a lot of green candles followed by a lot of red candles in a row). Please note that bar colors might change until candle(s) close(s). The bar coloring rules will most likely change in the future.
Notes
- Uncheck "Factor Price" for Bitmex or any other exchange that shows volume in terms of money.
- UMF is a replacement to ADP , ADMF and ADL , so no more updates for the old indicators!
- Smooth MA length N = EMA length 2*N-1
- Combined tickers, e.g. (COINBASE:BTCUSD+BITSTAMP:BTCUSD+KRAKEN:XBTUSD)/3, can mitigate inconsistency issues between different exchanges (I recommend not mixing USD and USDT pairs together)
Why invent a new indicator
I have spent a great deal of time to find the best equation that represents accumulation/distribution. Each of the well-known methods have a major flaw.
- Winner-take-all problem
MFI, OBV and to some extent Williams AD assign accumulation or distribution based on the direction of change in price. They don't account for the amount of change. That means the indicator does not differentiate between a full candle and a doji candle.
- Extreme divergence problem
Chaikin tried to avoid winner-take-all problem. However, he ended up with a solution that, in my opinion, is even worse. A big flaw of Chaikin's indicators is that they can diverge too much from price. Most responsive indicators in this class, require at least two candles to diverge from price, but CMF/ADL can diverge in a single candle. Chaikin used the same component ( aka Chaikin's money flow multiplier) in both CMF and ADL. CMF 's flaws may not be as visible because it is a normalized oscillator. However, this common flaw is more evident in accum/dist indicator which keeps all past information in its memory. As you can see in the chart below, accum/dist is constantly rising during an obviously distribution period.
ADV (Volume)
ADP
ADMF
ADL
Please give a like, and share the interesting configurations you find in the comments.

Enhanced On Balance VolumeEnhanced On Balance Volume
"On-balance volume (OBV) is a momentum indicator that uses volume flow to predict changes in stock price.
Joseph Granville first developed the OBV metric in the 1960s.
He believed that when volume increases sharply without a significant change in the stock's price, the price will eventually jump upward, and vice versa."
The On Balance Volume generalizes.
Only the direction of change is taken into consideration, making the price irrelevant.
Enhanced On Balance Volume comes to life when the entire price action is being considered - the lows and highs.
// I looked around on TradingView and there was no such indicator.
// This is a version of the well known On Balance Volume, ported to Pinescript, meant for markets with volume data.
OBV+OBV+ is a OBV study enhanced with a linear regression moving average.
Default Settings:
Linear Regression of OBV: 34
Activate Vertical Bar Highlights and/or Signal Flags for:
- RSI crossing its Linear Regression . (Default: Both On)
Users can also do extra tuning in Style Section of Format options.
To use this indicator we need to observe the market's behaviour and identify which settings are fit for the timeframe and type market trading.
Recommended suggested settings
Linear Regression of OBV: 34/21
The market behaves differently when the pacing changes, volatility changes and when it trends or when it ranges. Develop an understanding of it with the help of this study.
Avoid risking more than 1% per trade. Be responsible for always making a priority about protecting capital and managing risk.
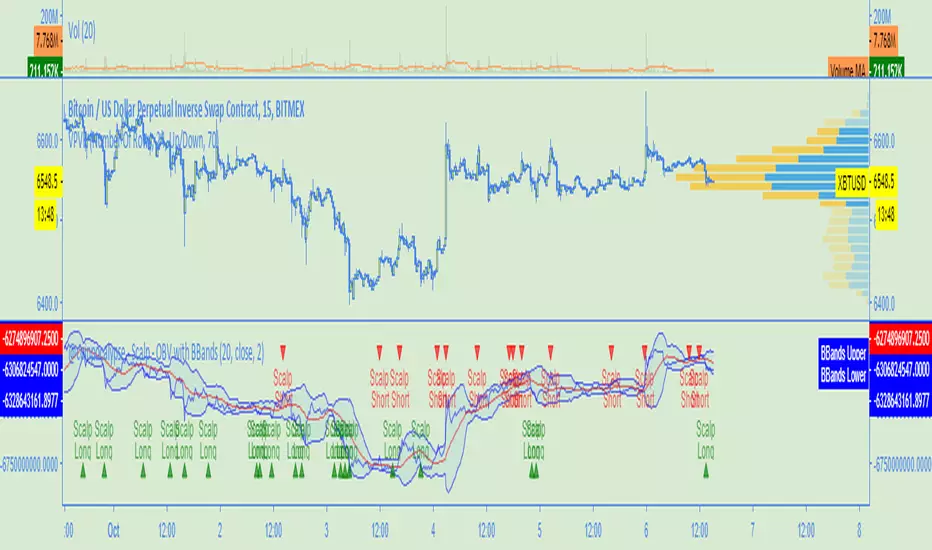
@coinpocalypse - Scalp Script - OBV with BBandsThis is a scalp script for the M15, tested on XBTUSD with good results.
Still some work to do, but easy to use.

NeoIchi
The idea of this oscillator / indicator came from Ichimoku , how it draws and how it calculates different averages in different scales.
The formula used for this indicator is totally different from Ichimoku , as you can compare the left and right charts, with same setting between my indicator and ichimoku , different results show up.
The inputs that you can use for this indicator/oscillator :
1- HLC3 (better to through it on the chart just like ichimoku
2- acceleration - deceleration (set the first parameter to 5 and the second to 34 for standard calculations)
3- pure volume
4- OBV ( On Balance Volume )
5- Bill Williams MFI ( Market Facilitation Index )
6- Momentum : This one can have different options : set with Barry Burn's formula and bar scale for when the charts are 1 to 3 ratio (B 3) or when they are not 1 to 3 (B), Bill William standard (W), Hybrid with barry's input (Would be bar close but I replaced it with HLC3, better results) but Bill William time scale for calculations (H), and finally, use Bill Williams MFI as input but use Barry Burn's time scales in formula (H M)
If you have any specific input in mind that you think would be nice to have in this system, through a comment bellow and I will add it to the system.
This oscillator / indicator is for sale, you can buy a life long licence that would include all updates with 0.01 BTC. Send the BTC + transaction fee to the wallet address bellow :
12EDAYA52DzcXdh9aLC9Pqqfhm1jNMjxNo
after sending the BTC , contact me in pm and send the transaction ID with your trading view's ID and I will give you access to this oscillator / indicator

OBV with 13 EMA - TRIOn Balance Volume with 13 Exponential Moving Average.
Taught in school Level 1 program.
BitMEX Funding Toolbox [NeoButane]BitMEX's funding rates as described on their website.
Usage of the indicator:
Cumulative funding is a running sum of funding, similar to OBV. The idea is that funding can be used to predict current sentiment or market direction. The blue line is cumulative funding and the orange is a MVWAP used as a signal to determine current trend. Longs are paid when the blue line is going down.
Cumulative funding oscillator is the running sum of funding but made to be able to discern more recent trends.
Funding rate and premium index is as the name states.
Pictures of funding directly from BitMEX's funding history: imgur.com
The indicator will auto-select XBTUSD or ETHUSD depending which ticker is currently being viewed; if it is not on bitcoin or ethereum it defaults to XBTUSD funding.
References used:
www.bitmex.com
www.bitmex.com
More pictures:

Volume ENTERThis is an OBV ( On Balance Volume ) with two different moving averages on it plus a bollinger band set to OBV to find the squeeze and expansion points on OBV. As you many know, OBV is one of those indicators that can show you the volume and not only that but also the direction that volume is going.

Variable Volume Oscillator v1 [NeoButane]These are volume based indicators put onto an oscillator by using SMA for most of them. Most volume based indicators are leading indicators so you may find a use for each of them. The WMA is a length of 21, as suggested by the original inventor of OBV. It is useful for crosses and determining future moves.
What's currently included:
OBV Oscillator, remade. The formula has been changed to smooth out the way OBV is calculated during a trending move
OBV Oscillator, original OBV formula.
Price Volume Trend Oscillator. Similar to OBV, except price is taken into account as well.
Price Volume Trend Oscillator, log.
Accumulation/Distribution. (close - low) - (high - close) / (high - low), then multiplied by volume
Chaikin Money Flow. Very similar to accum/dist except it was already made into an oscillator.
OBV just by itself
Experimental function that utilizes a part of CCI

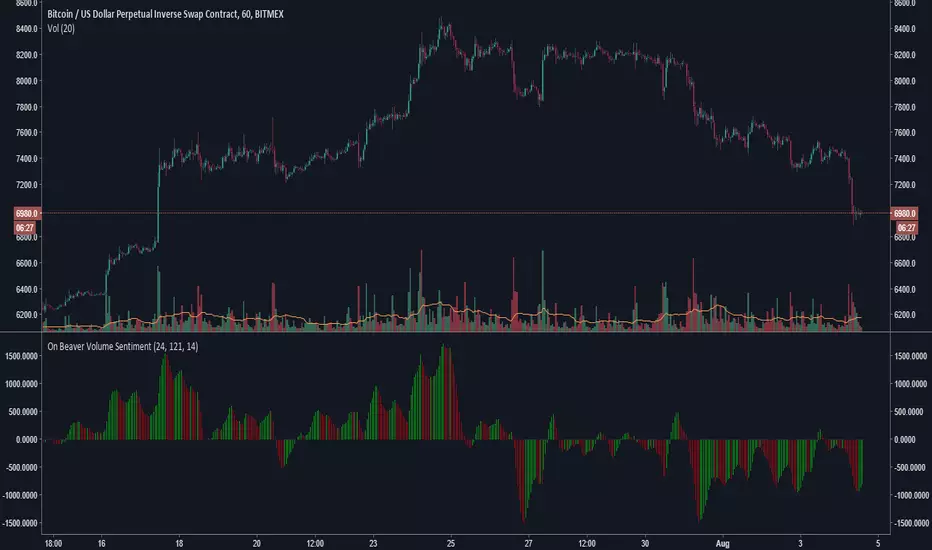
On Beaver Volume SentimentGeneral Market sentiment decoded from two Lazybear OBV's and a CCI.
Lots of strategies with this.
Main point is this indicator tries to be extra sensitive to relative volume changes but keep grounded in sentiment with the cci.
Let me know if you use this!
-Beaverman
Accumulation/Distribution Volume (ADV) [cI8DH]This is the simplified and optimized version of my original ADV indicator. It shows both regular volume bars and the accumulated/distributed (A/D) portion of them. The equation is elegant and intuitive. It calculates candle body to candle height ratio and multiplies it by volume: volume*(close-open)/(high-low). This is the building block of my three other indicators, ADL, ADP and ADMF.
- The volume bars has two shades of green and red. The dark shade shows amount of A/D and the light shade shows total volume (what you see on a regular volume indicator).
When money volume is enabled, volume is multiplied by price. As you can see in the chart below, trade volume in terms of USD was growing over the past years.
- Blue line is the moving average of A/D and the orange line is for total volume. When "Baseline Chart" option is enabled, this moving average is identical to ADMF indicator which can be a powerful indicator for assessing buy/sell pressure as well as money flow and volume divergences. You can turn off volume bars (from style menu) for better visibility or you can use the below indicators.
Please note that ADMF is now available as a part of ADP indicator as well and I recommend using the latter since ADP can also replace CMF and MFI indicators.
- If you change the aggregation to cumulative (while having money volume disabled), the gray line becomes identical to On Balance Volume (OBV) and the blue line identical to my ADL indicator. The latter I would argue is more accurate than Chaikin's ADL, William's A/D and OBV.

Accumulation/Distribution Level (ADL) [Cyrus c|:D]This indicator shows Accumulation/Distribution level which can be used for confirming trends or reversals (via divergence). It is an alternative to Chaikin's Accumulation/Distribution Line (ADL) and On Balance Volume (OBV) indicators. It can also replicate PVT and OBV via options in the input menu.
Here is a comparison of four related indicators:
OBV is too simple and has serious flaws as explained in PVT's wiki.
Chaikin's ADL is a broken indicator as can be seen in the chart below:
A/D Level addresses the flaws in these two indicators. It simply sums up portions of the volume that contributes to price change. These portions are visualized in dark green and red on "Accumulation/Distribution Volume (ADV)" indicator. This can also be achieved by ADV indicator if you are nerd enough.
PS: There is Williams A/D as well which is also a broken indicator.
Accumulation/Distribution VolumeThis is a simple yet powerful indicator that can replace volume, Money Flow, Chaikin Money Flow, Price Volume Trend (PVT), Accumulation/Distribution Line (ADL), On Balance Volume (OBV).
When "Baseline Chart" option is disabled, it looks similar to regular volume. The volume bars has two shades of green and red. The dark shade shows amount of accumulation and the light shade shows total volume (what you see on a regular volume indicator). Blue line is the moving average (or cumulative total) of A/D and the gray line is for total volume.
When money volume is enabled, volume it multiplied by price. As you can see in the chart below, trade volume in terms of USD was declining after ATH. This is not the case in regular volume chart which shows instrument volume (chart above).
In Baseline view, the aggregation method you choose can turn it into different indicators. With EMA/SMA aggregation, blue and gray line shows buy/sell pressure. At 0, there is not buy or sell pressure.
If you turn off volume bars (from style menu), it gives you a reliable indicator to measure divergence. This should be more reliable than most other range-bound indicators (i.e. RSI, MFI, CMF). I will publish a TA about correctly measuring divergence (it's a must read even if you are a pro trader). Make sure that the length is set to a large number on smaller TFs such as 4h.
For following results, set aggregation to cumulative and turn off money volume:
When wick weight=0, the GRAY line is identical to OBV indicator.
When normalized by spread and wick weight=10, the BLUE line is identical to ADL (improved by true range).
When normalized by previous bar price, wick weight=0, the BLUE line is identical to PVT.
How I use this indicator:
- Baseline chart, replaced my regular volume indicator
- Mostly 4h TF for divergence
- EMA aggregation (and occasional cumulative aggregation) with length above 50. I change the length to 100 and 200 for confirmation.
- Wick weight=0 or max 2.
With this indicator, you can learn how different indicators are built and how they are different from each other. I will publish a TA to explain more about different indicators and their pros and cons.
I will publish this indicator without volume bars and additional options to make it range bound.

CCI OBV 4Kmod of lazy bear's OBV coded CCI , which indicates CCI state by changing the color of the OBV. now it shows you when CCI is overbought or oversold, not just one or the other
when CCI > 100, that's an oversold signal and OBV line turns green
when CCO -0.54% < -100, that's an undersold signal and OBV line turns red
CCI threshold can be changed (ex. 200 and -200)
EMA is overlaid, too, in orange, and that period can be changed

OBV.v - Simple On Balance Volume indicatorA simple OBV indicator using your choice of wma or ema. The length of the MA can be adjusted, as well as the colors used.
OBV changes to green when above the moving average and changes to red when below the moving average. The OBV crosses are to be used as your buy and sell signals.

On Balance Volume locked 5min (CVI)OBV shows the cumulation of the volume bars. All the volume in a green bar gets added to the obv and all the volume in a red bar gets subtracted. At a higher timeframe this can be misleading, because it filters out a lot of volume. This indicator locks the obv at 5 minutes, giving more information about the total amount of added and subtracted volume.